Abstract
In this work, we performed a proof-of-concept experiment for phase-contrast x-ray imaging (PCXI) based on a single antiscatter grid and a polychromatic x-ray source. We established a table-top setup which consists of a focused-linear grid having a strip density of 200 lines/inch, a microfocus x-ray tube having a focal-spot size of about 5 μm, and a CMOS-type flat-panel detector having a pixel size of 48 μm. By using our prototype PCXI system and the Fourier demodulation technique, we successfully obtained attenuation, scattering, and differential phase-contrast images of improved visibility from the raw images of several selected samples at x-ray tube conditions of 90 kVp and 0.1 mAs. Further, fusion image (e.g., the attenuation+the scattering) may have an advantage in displaying details of the sample's structures that are not clearly visible in the conventional attenuation image. Our experimental results indicate that single-grid-based approach seems a useful method for PCXI with great simplicity and minimal requirements on the setup alignment.
Go to : 
References
1. D. Chapman, W. Thomlinson, R. Johnston, et al: Diffraction enhanced x-ray imaging. Phys. Med. Biol. 42(11):2015–2025. 1997.
2. L. Levine and G. Long: X-ray imaging with ultra-small-angle x-ray scattering as a contrast mechanism. J. Appl. Crystallogr. 37:757–765. 2004.
3. H. Wen, E. Bennett, R. Kopace, A. Stein, and V. Pai: Single-shot x-ray differential phase-contrast and diffraction imaging using two-dimensional transmission gratings. Opt. Lett. 35(12):1932–1934. 2010.
4. M. Endrizzi, P. Diemoz, T. Millard, et al: Hard X-ray dark-field imaging with incoherent sample illumination. Appl. Phys. Lett. 104:024106. 2014.
5. T. Davis, D. Gao, T. Gureyev, A. Stevenson, and S. Wilkins: Phase-contrast imaging of weakly absorbing materials using hard x-rays. Nature. 373:595–598. 1995.
6. M. Ando, K. Yamasaki, F. Toyofuku, et al: Attempt at visu alizing breast cancer with x-ray dark field imaging. Japan J. Appl. Phys. 44(17):L528–L531. 2005.
7. H. Wen, E. Bennett, M. Hegedus, and S. Rapacchi: Fourier x-ray scattering radiography yields bone structural information. Radiology. 251(3):910–918. 2009.
8. H. Wen, E. Bennett, M. Hegedus, and S. Carroll: Spatial harmonic imaging of x-ray scattering-Initial results. IEEE Trans. Med. Imaging. 27(8):997–1002. 2008.
9. C. Kottler, C. David, F. Pfeiffer, and O. Bunk: A two-directional approach for grating based differential phase contrast imaging using hard x-rays. Opt. Express. 15:1175–1181. 2007.
Go to : 
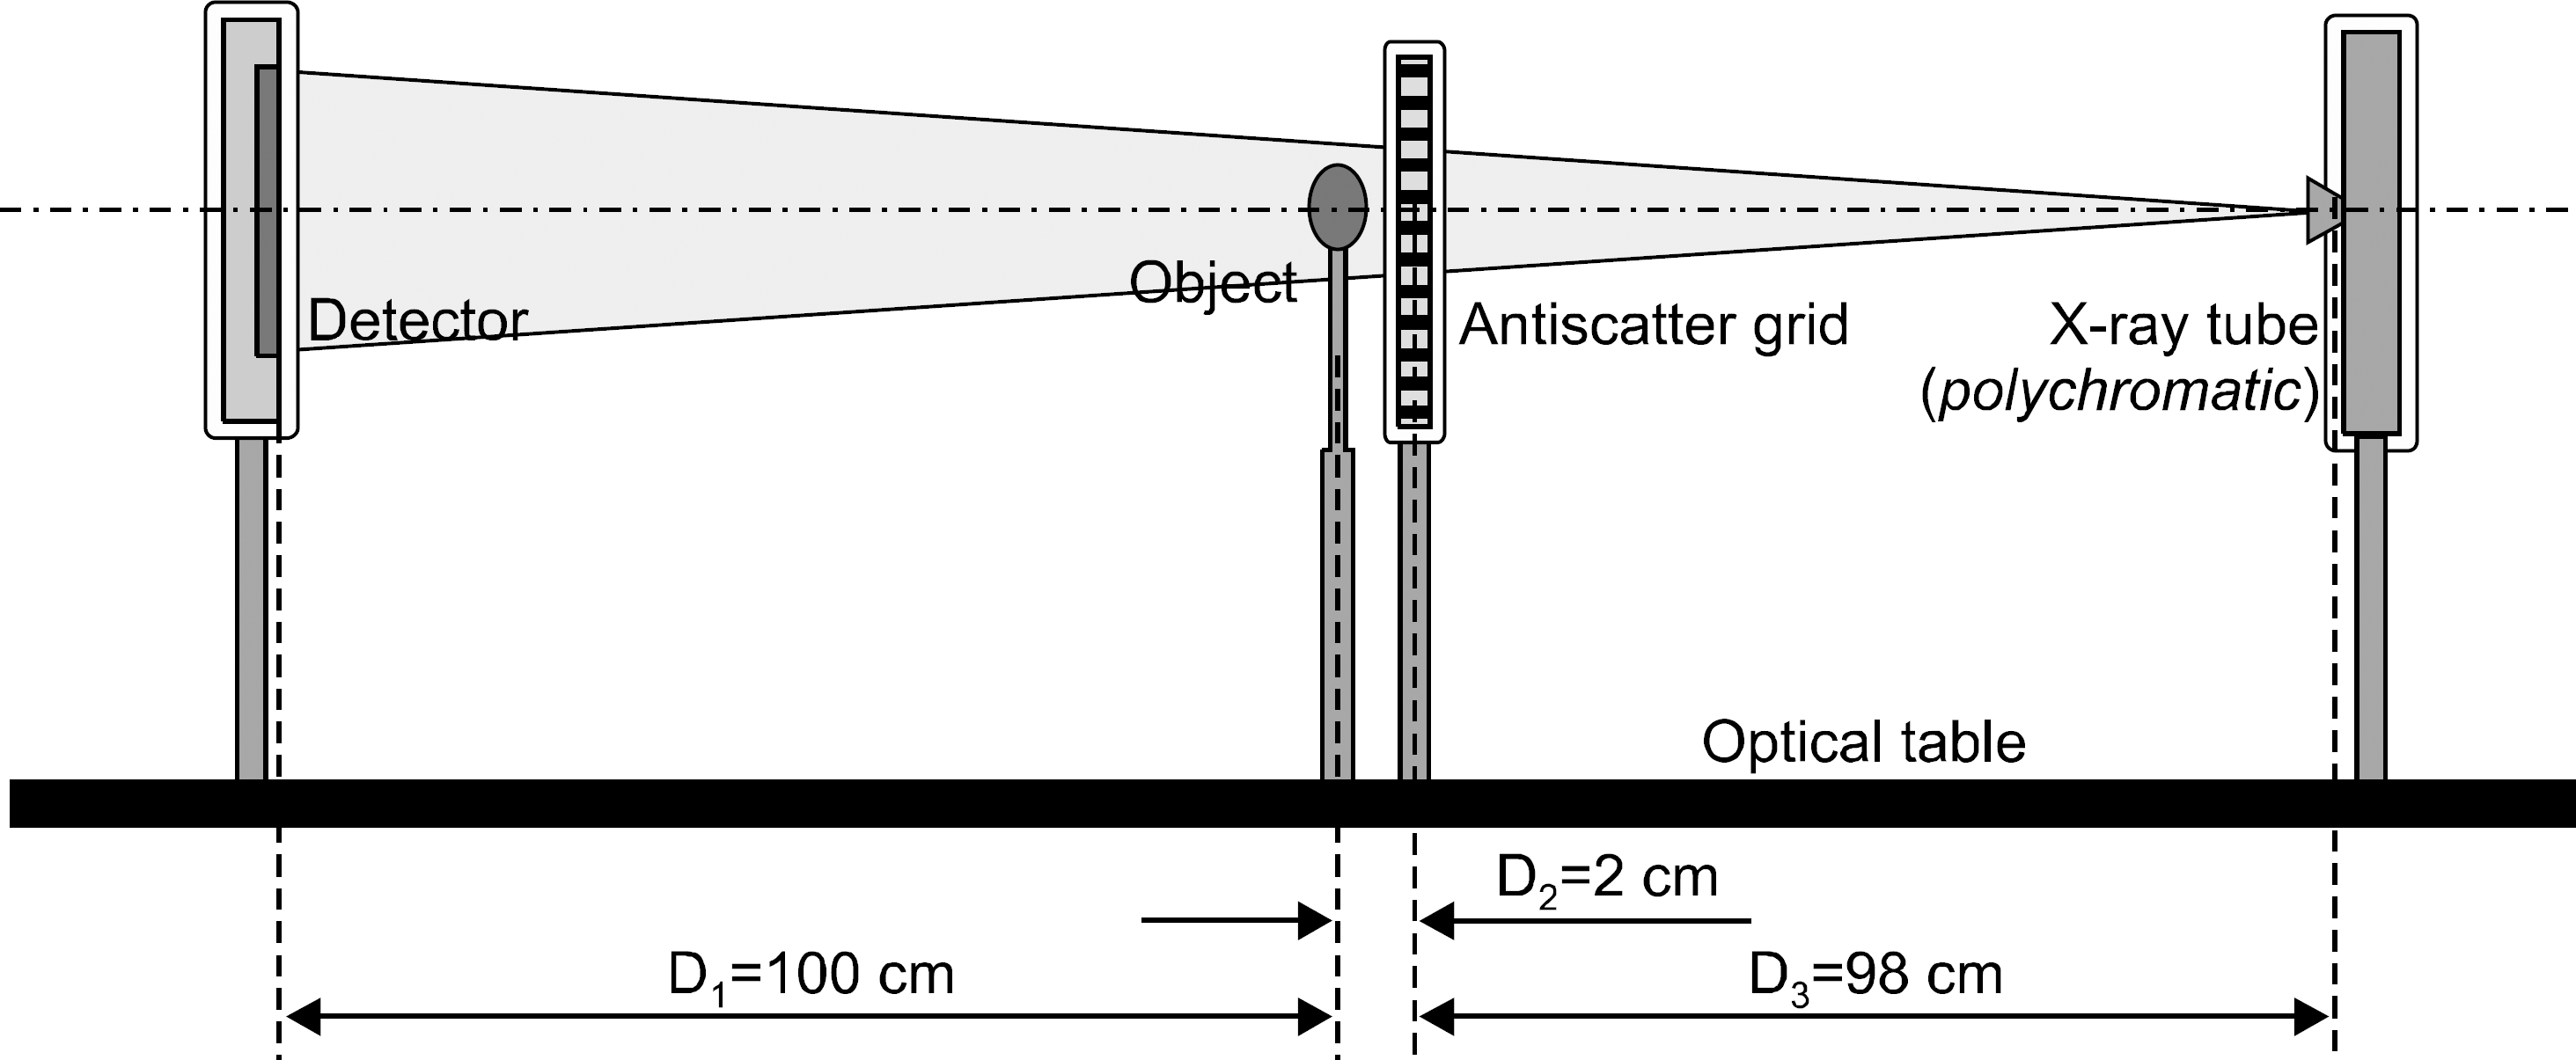 | Fig. 1.Schematic illustration of a system layout for the single-grid-based phase-contrast x-ray imaging (PCXI). Here, an antiscatter grid is placed between the x-ray tube and the detector, and an examined object is placed immediately behind the grid. |
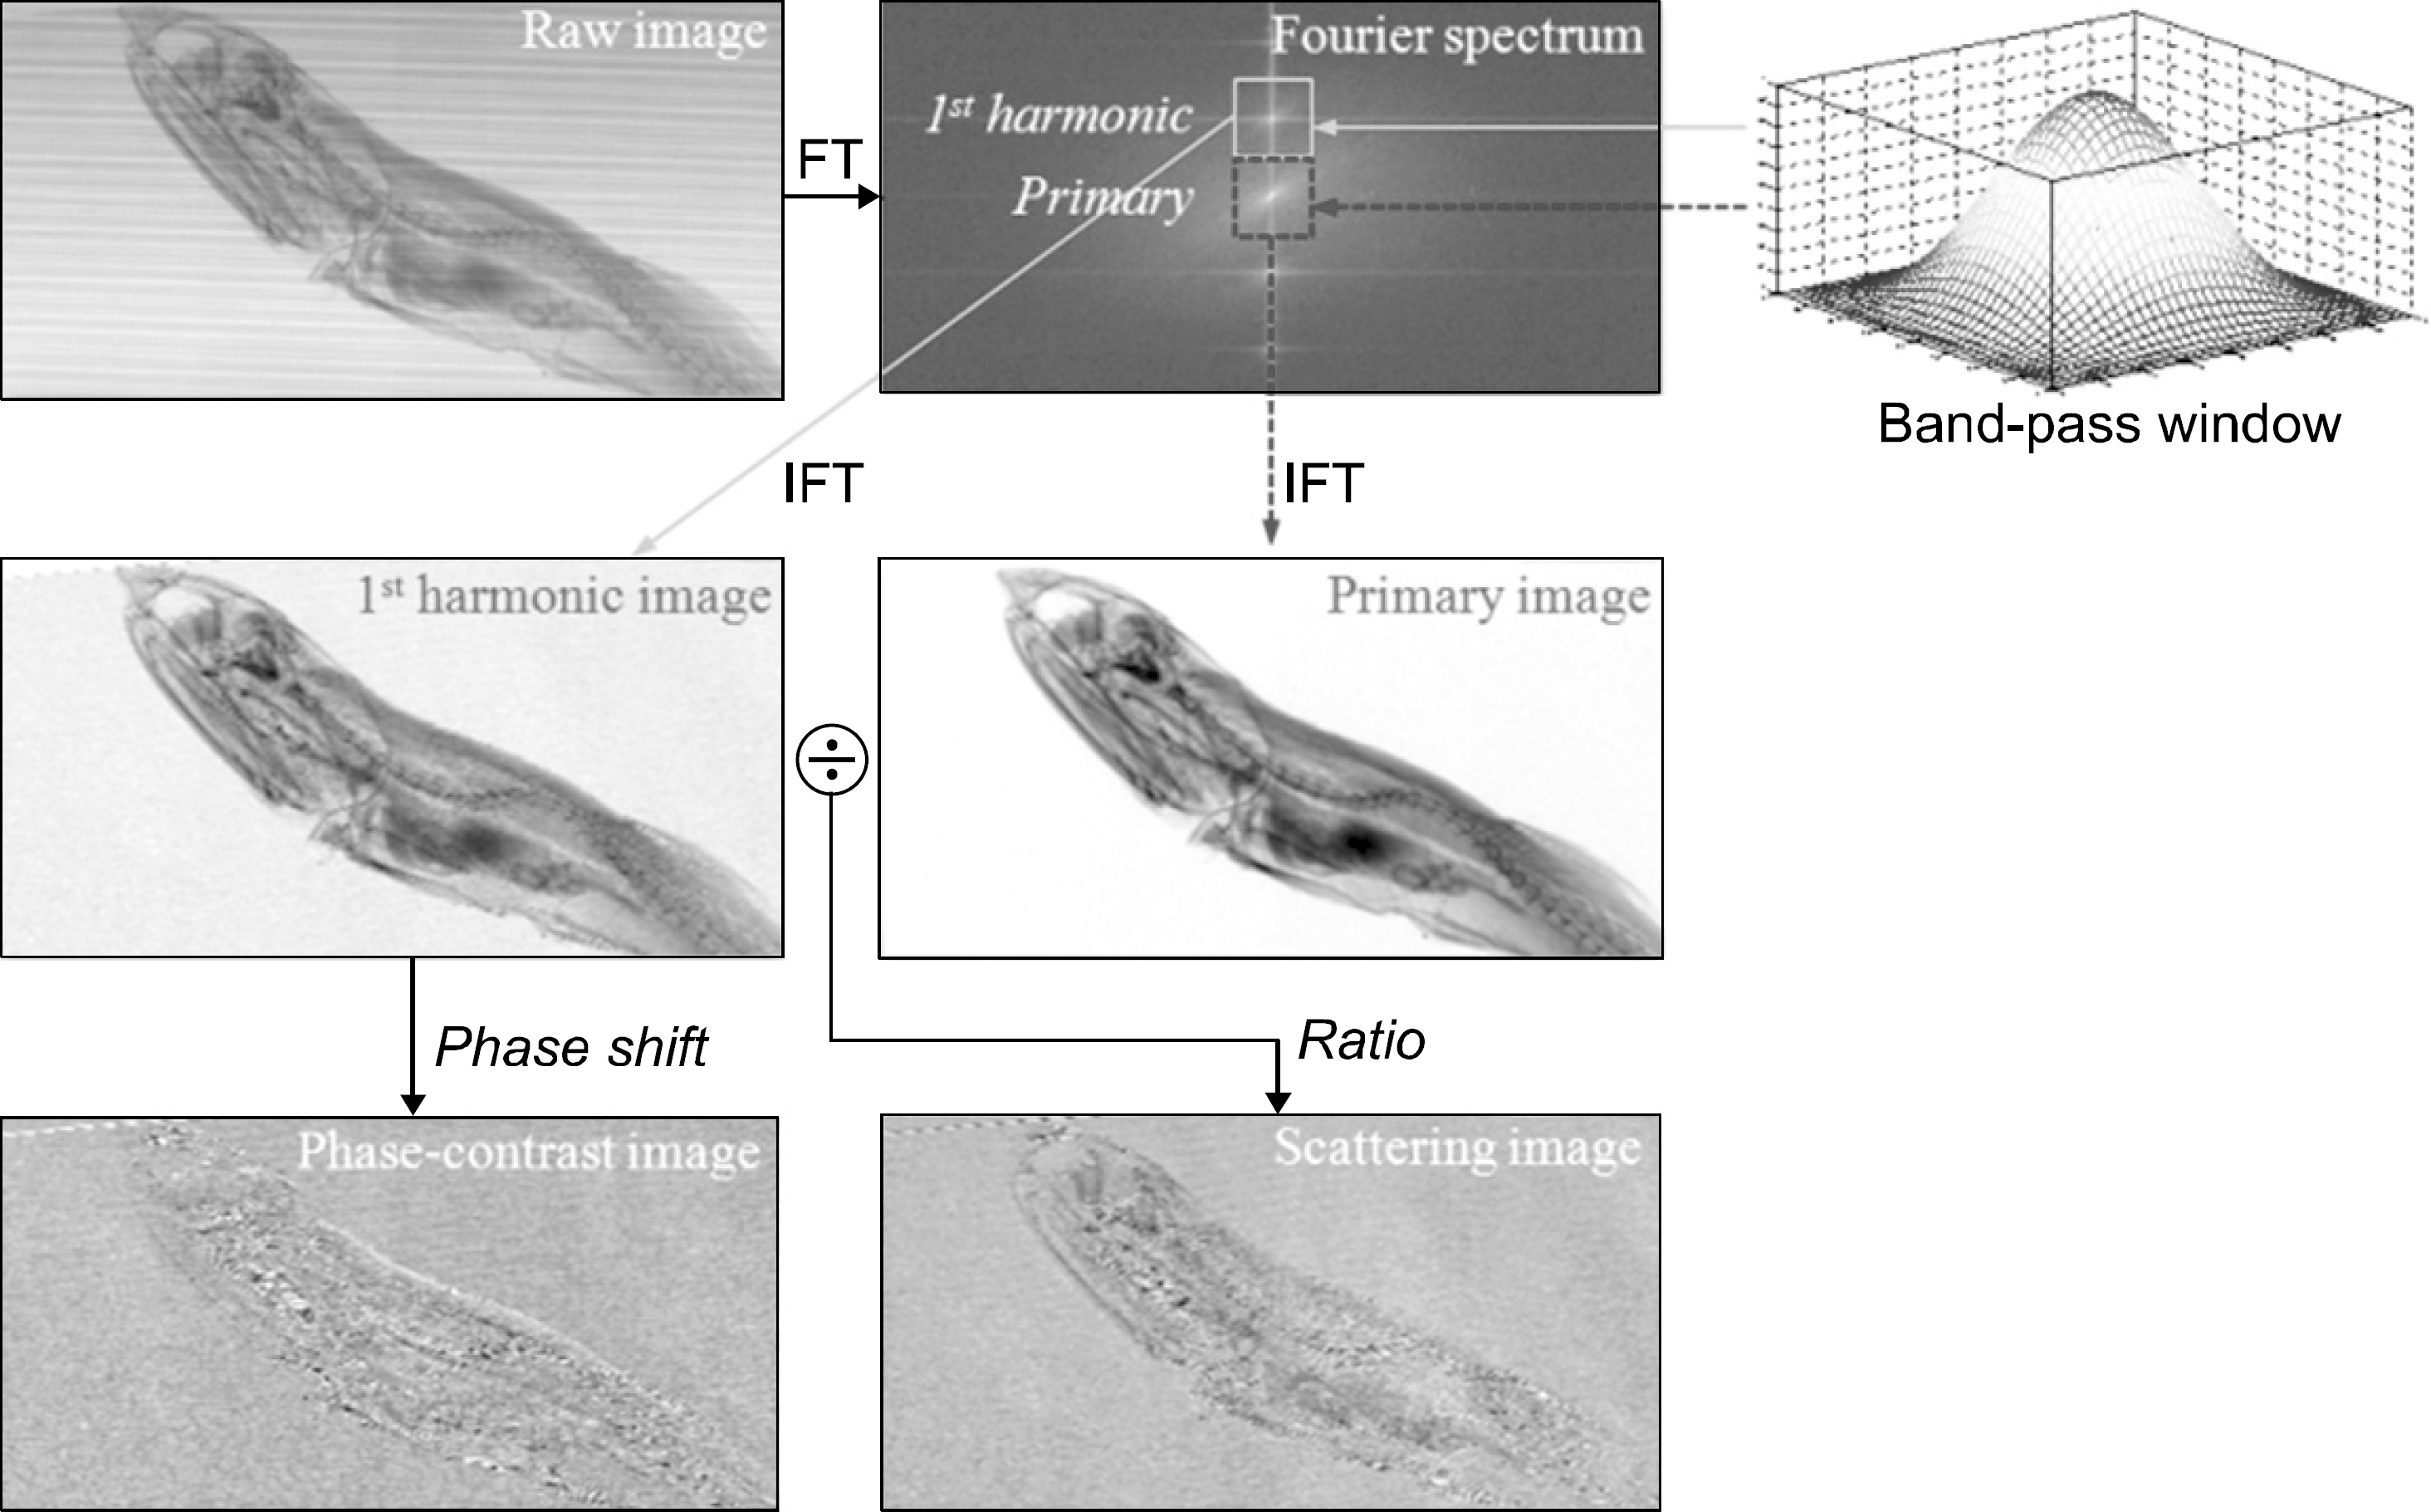 | Fig. 2.Simplified single-grid-based phase-contrast x-ray imaging (PCXI) procedure. The areas surrounding the primary and the first harmonic peaks are selected with a bandpass filter separately, and then inverse-Fourier transformed to yield the primary image and the first harmonic image of the object. |
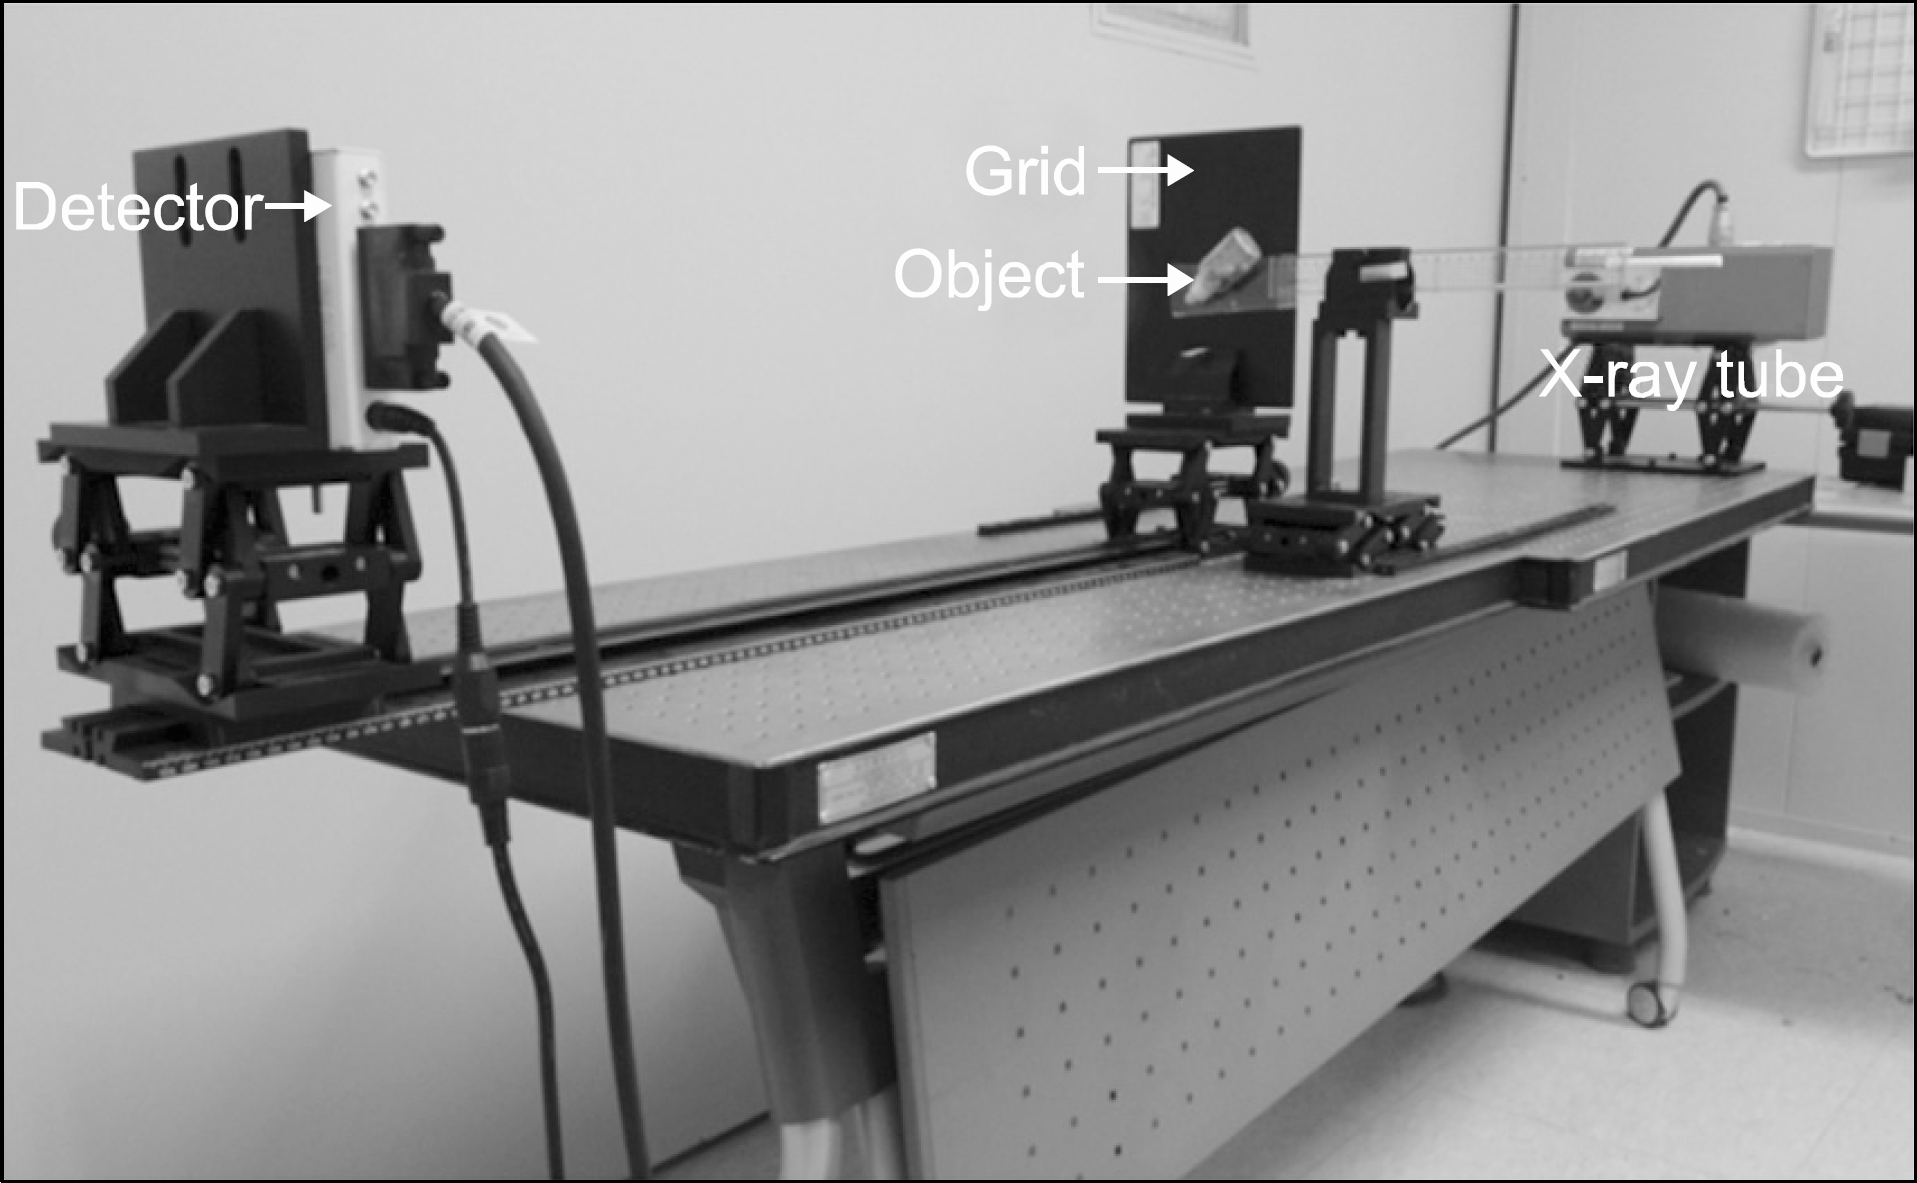 | Fig. 3.Photograph of a table-top setup we established for this work. It consists of a microfocus x-ray tube having an about 5- μm focal spot size (Hamamatsu, L7910), a focused-linear grid of a 200-lines/inch strip density (JPI Healthcare Corp.), and a CMOS image sensor of a 48-μm pixel resolution and a 2,048×1,024 matrix (Rad-icon Imaging Corp., Shad-o-Box 2048). |
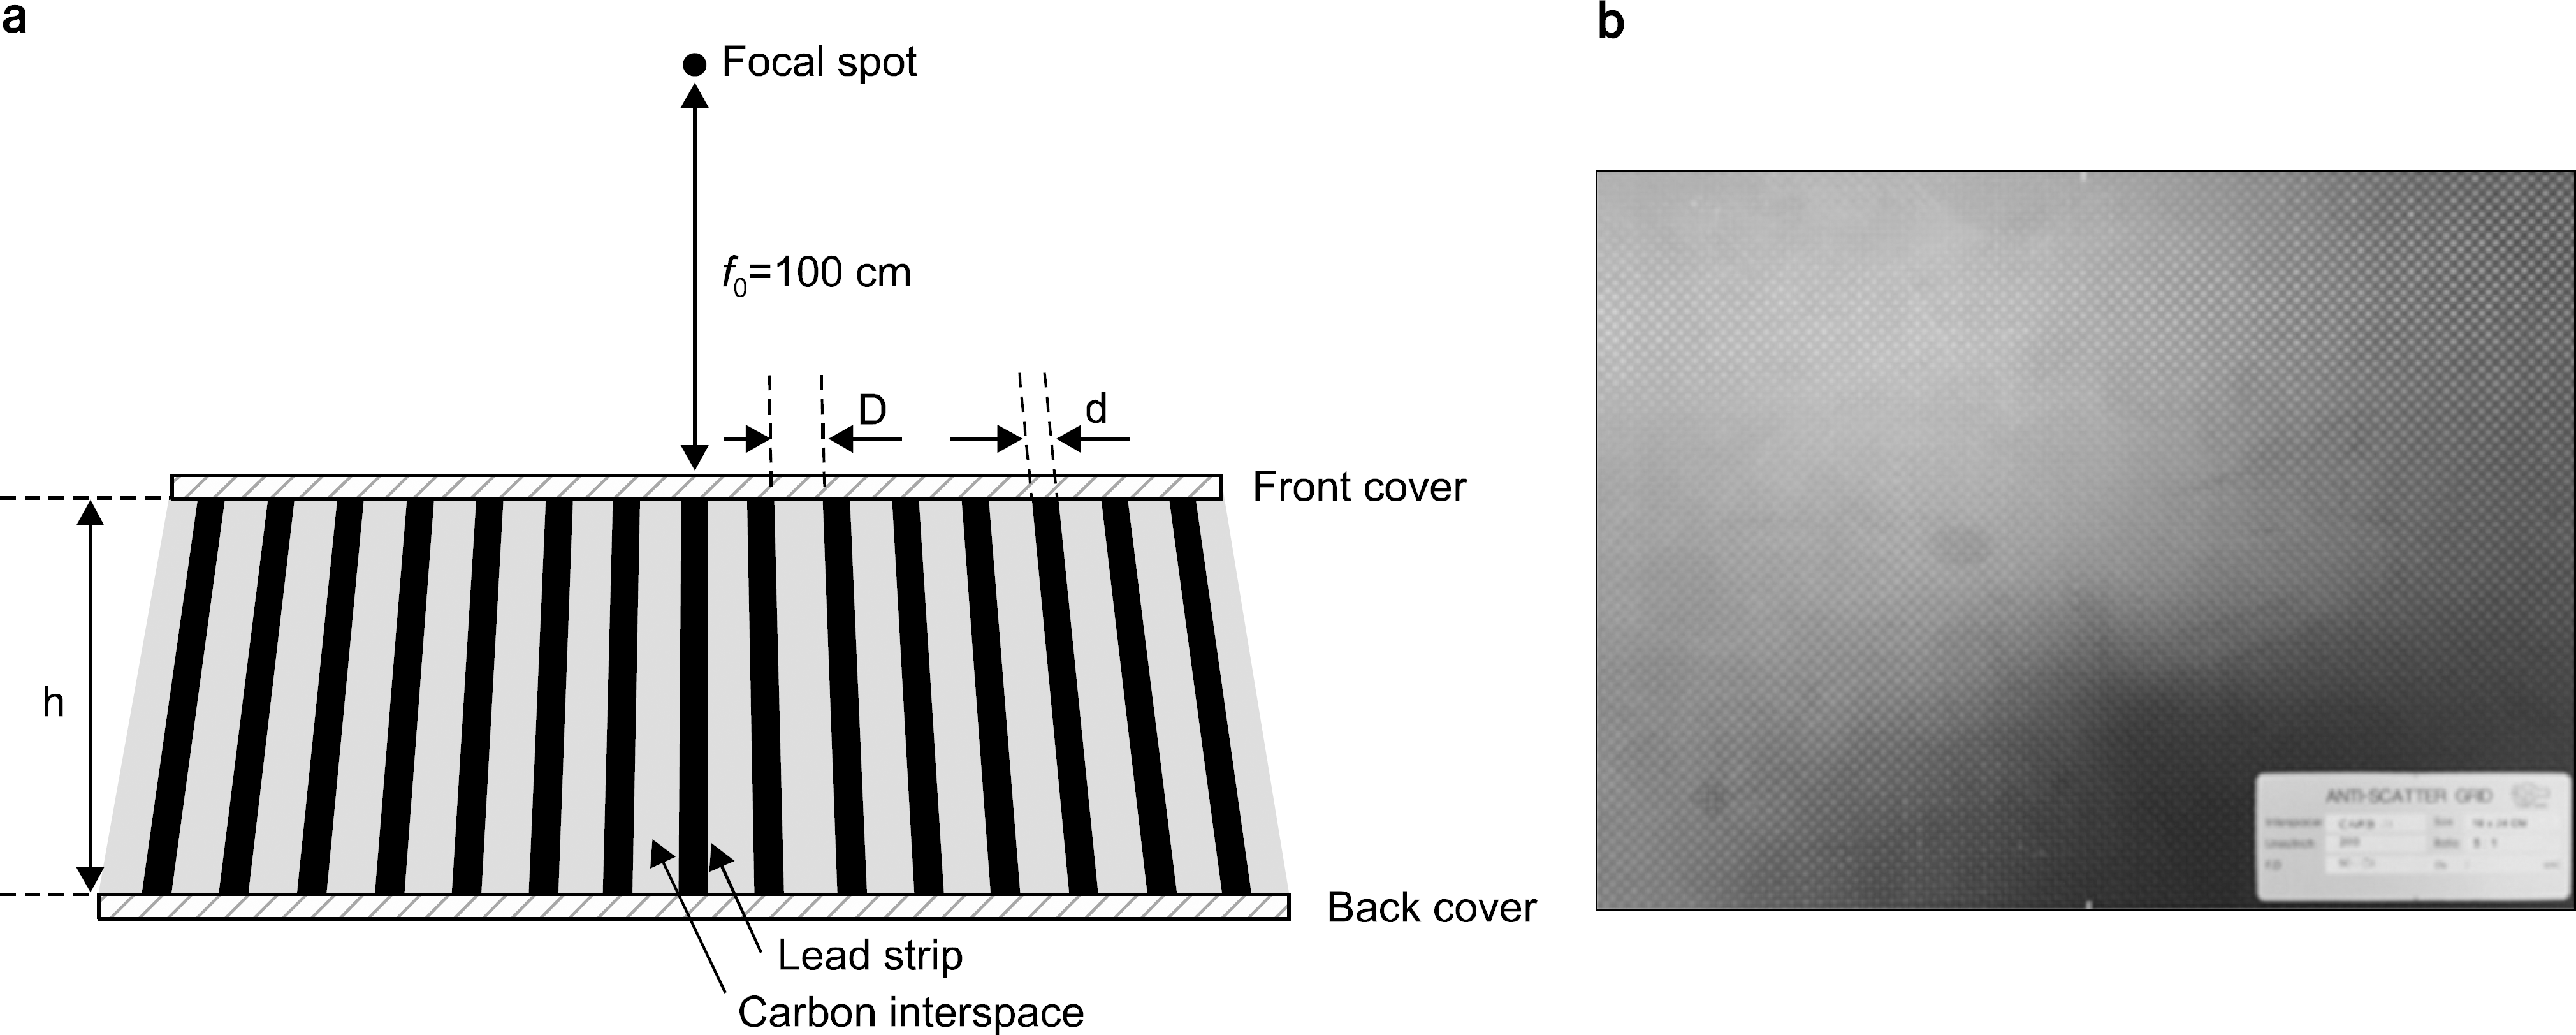 | Fig. 4.(a) Schematic drawing and (b) a photograph of the grid that we used. Here, D and d are the thicknesses of the grid interspace and the lead strip, respectively, and h is the height of the grid plate; D=0.102 mm, d=0.025 mm, and h=0.510 mm (i.e., P0=D+d=127 μm). The grid has a focal distance of 100 cm and a grid ratio of 5:1. |
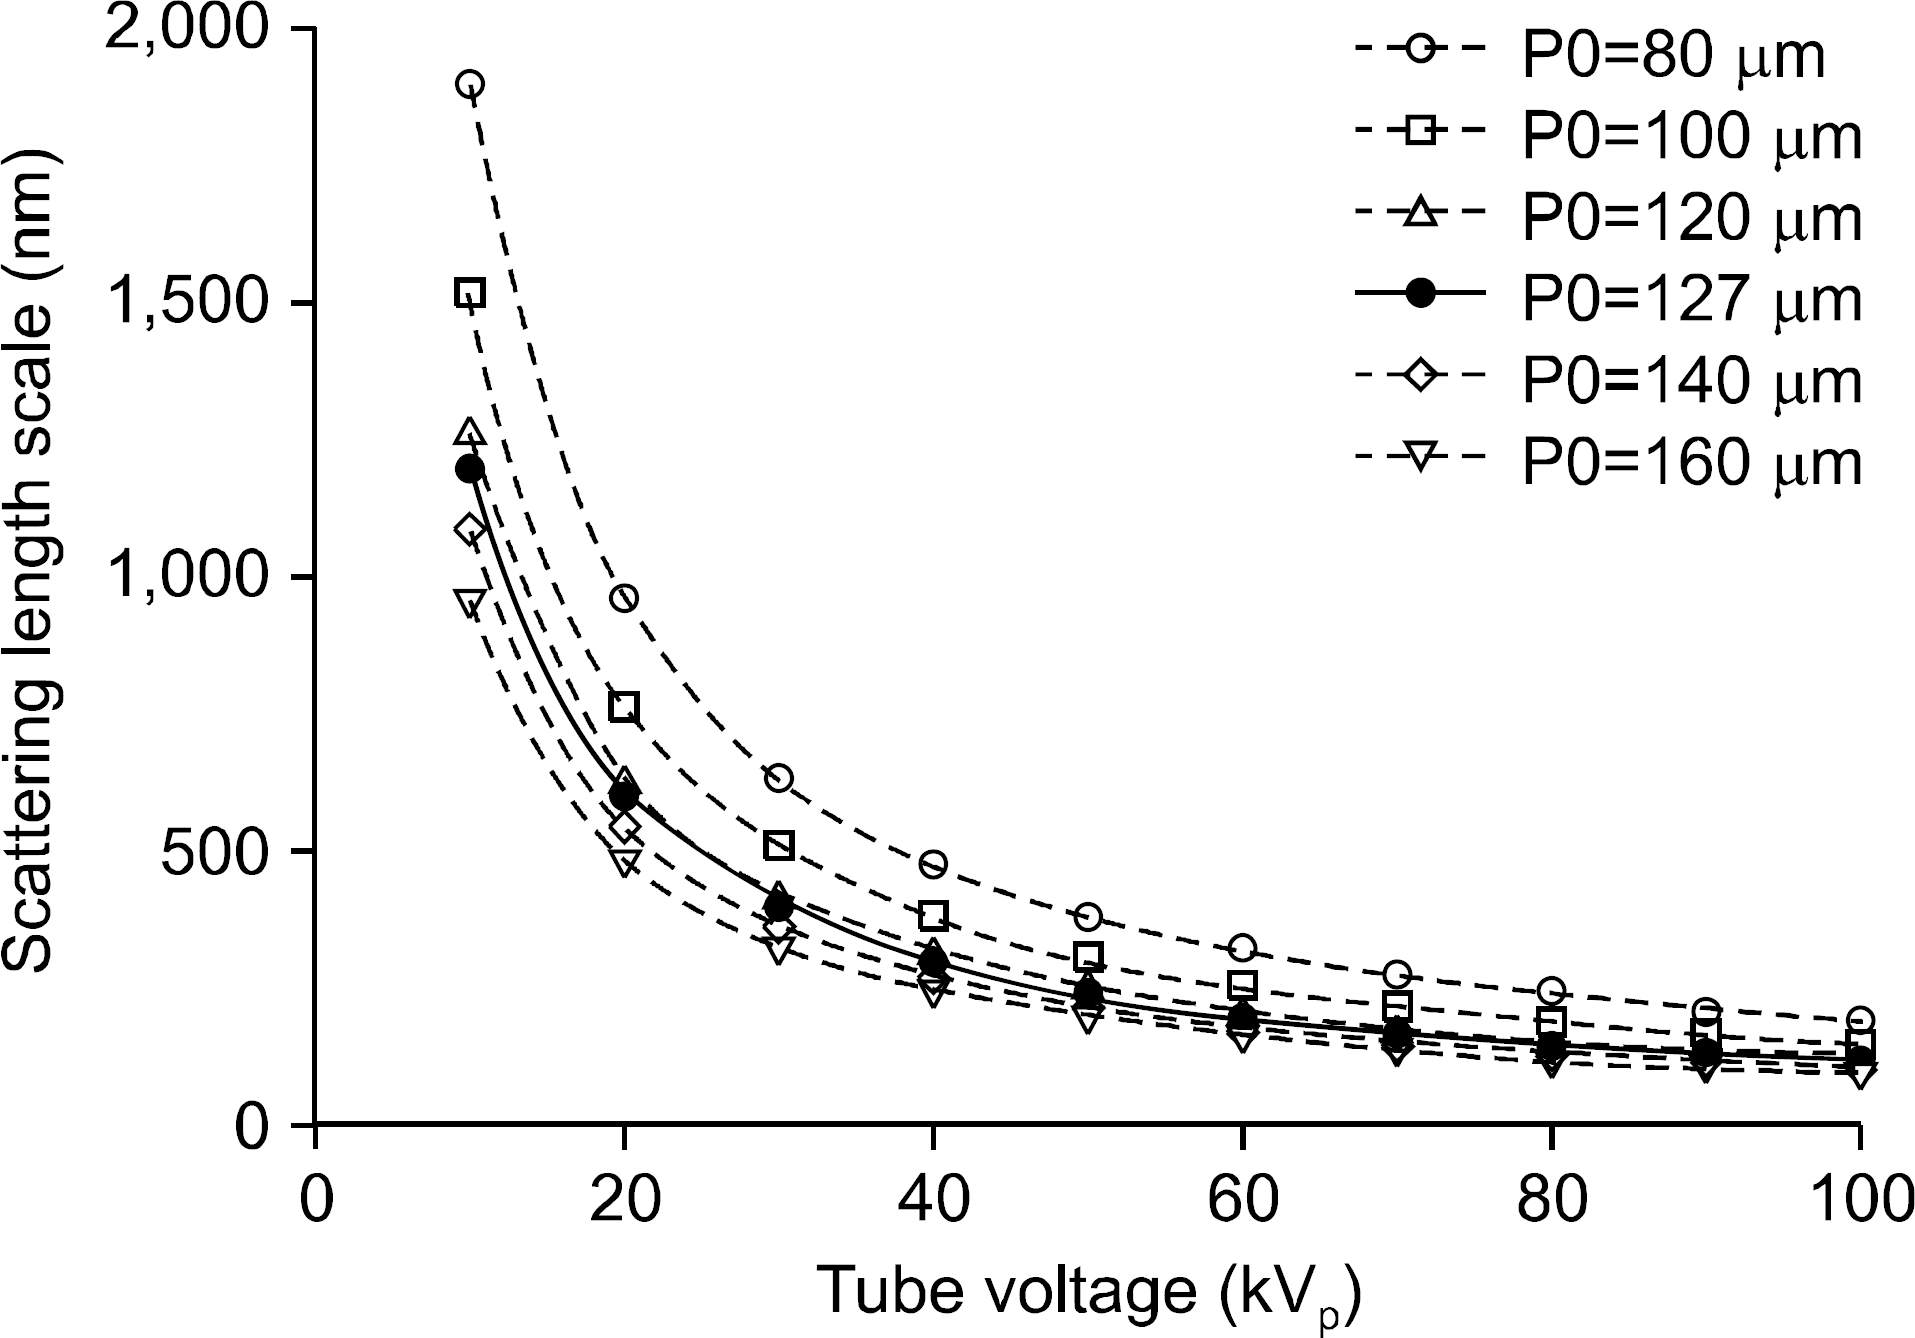 | Fig. 5.Scattering length scale estimated as a function of the x-ray tube voltage for several grid periods. The larger the scattering length scale, the higher the scattering signal. For our system setup, the scale was estimated about l=133 nm. |
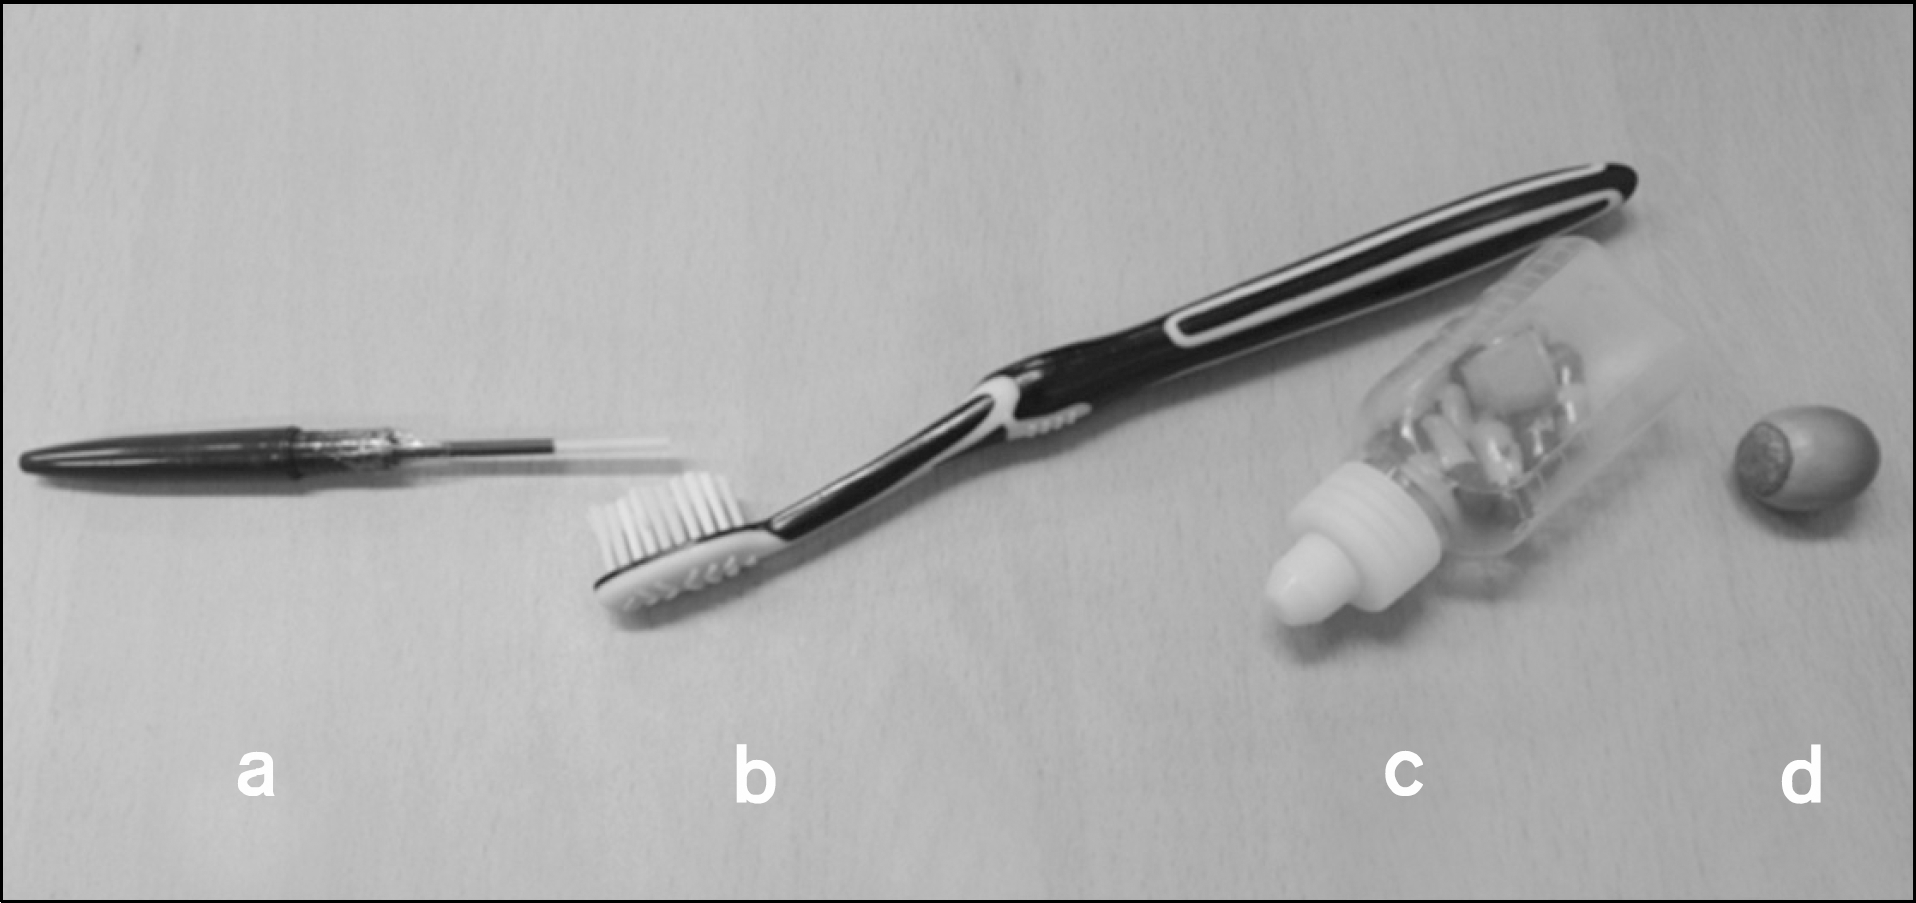 | Fig. 6.Some selected samples used in the PCXI experiment: (a) a ball-point pen, (b) a toothbrush, (c) a small pill container, and (d) an acorn. |
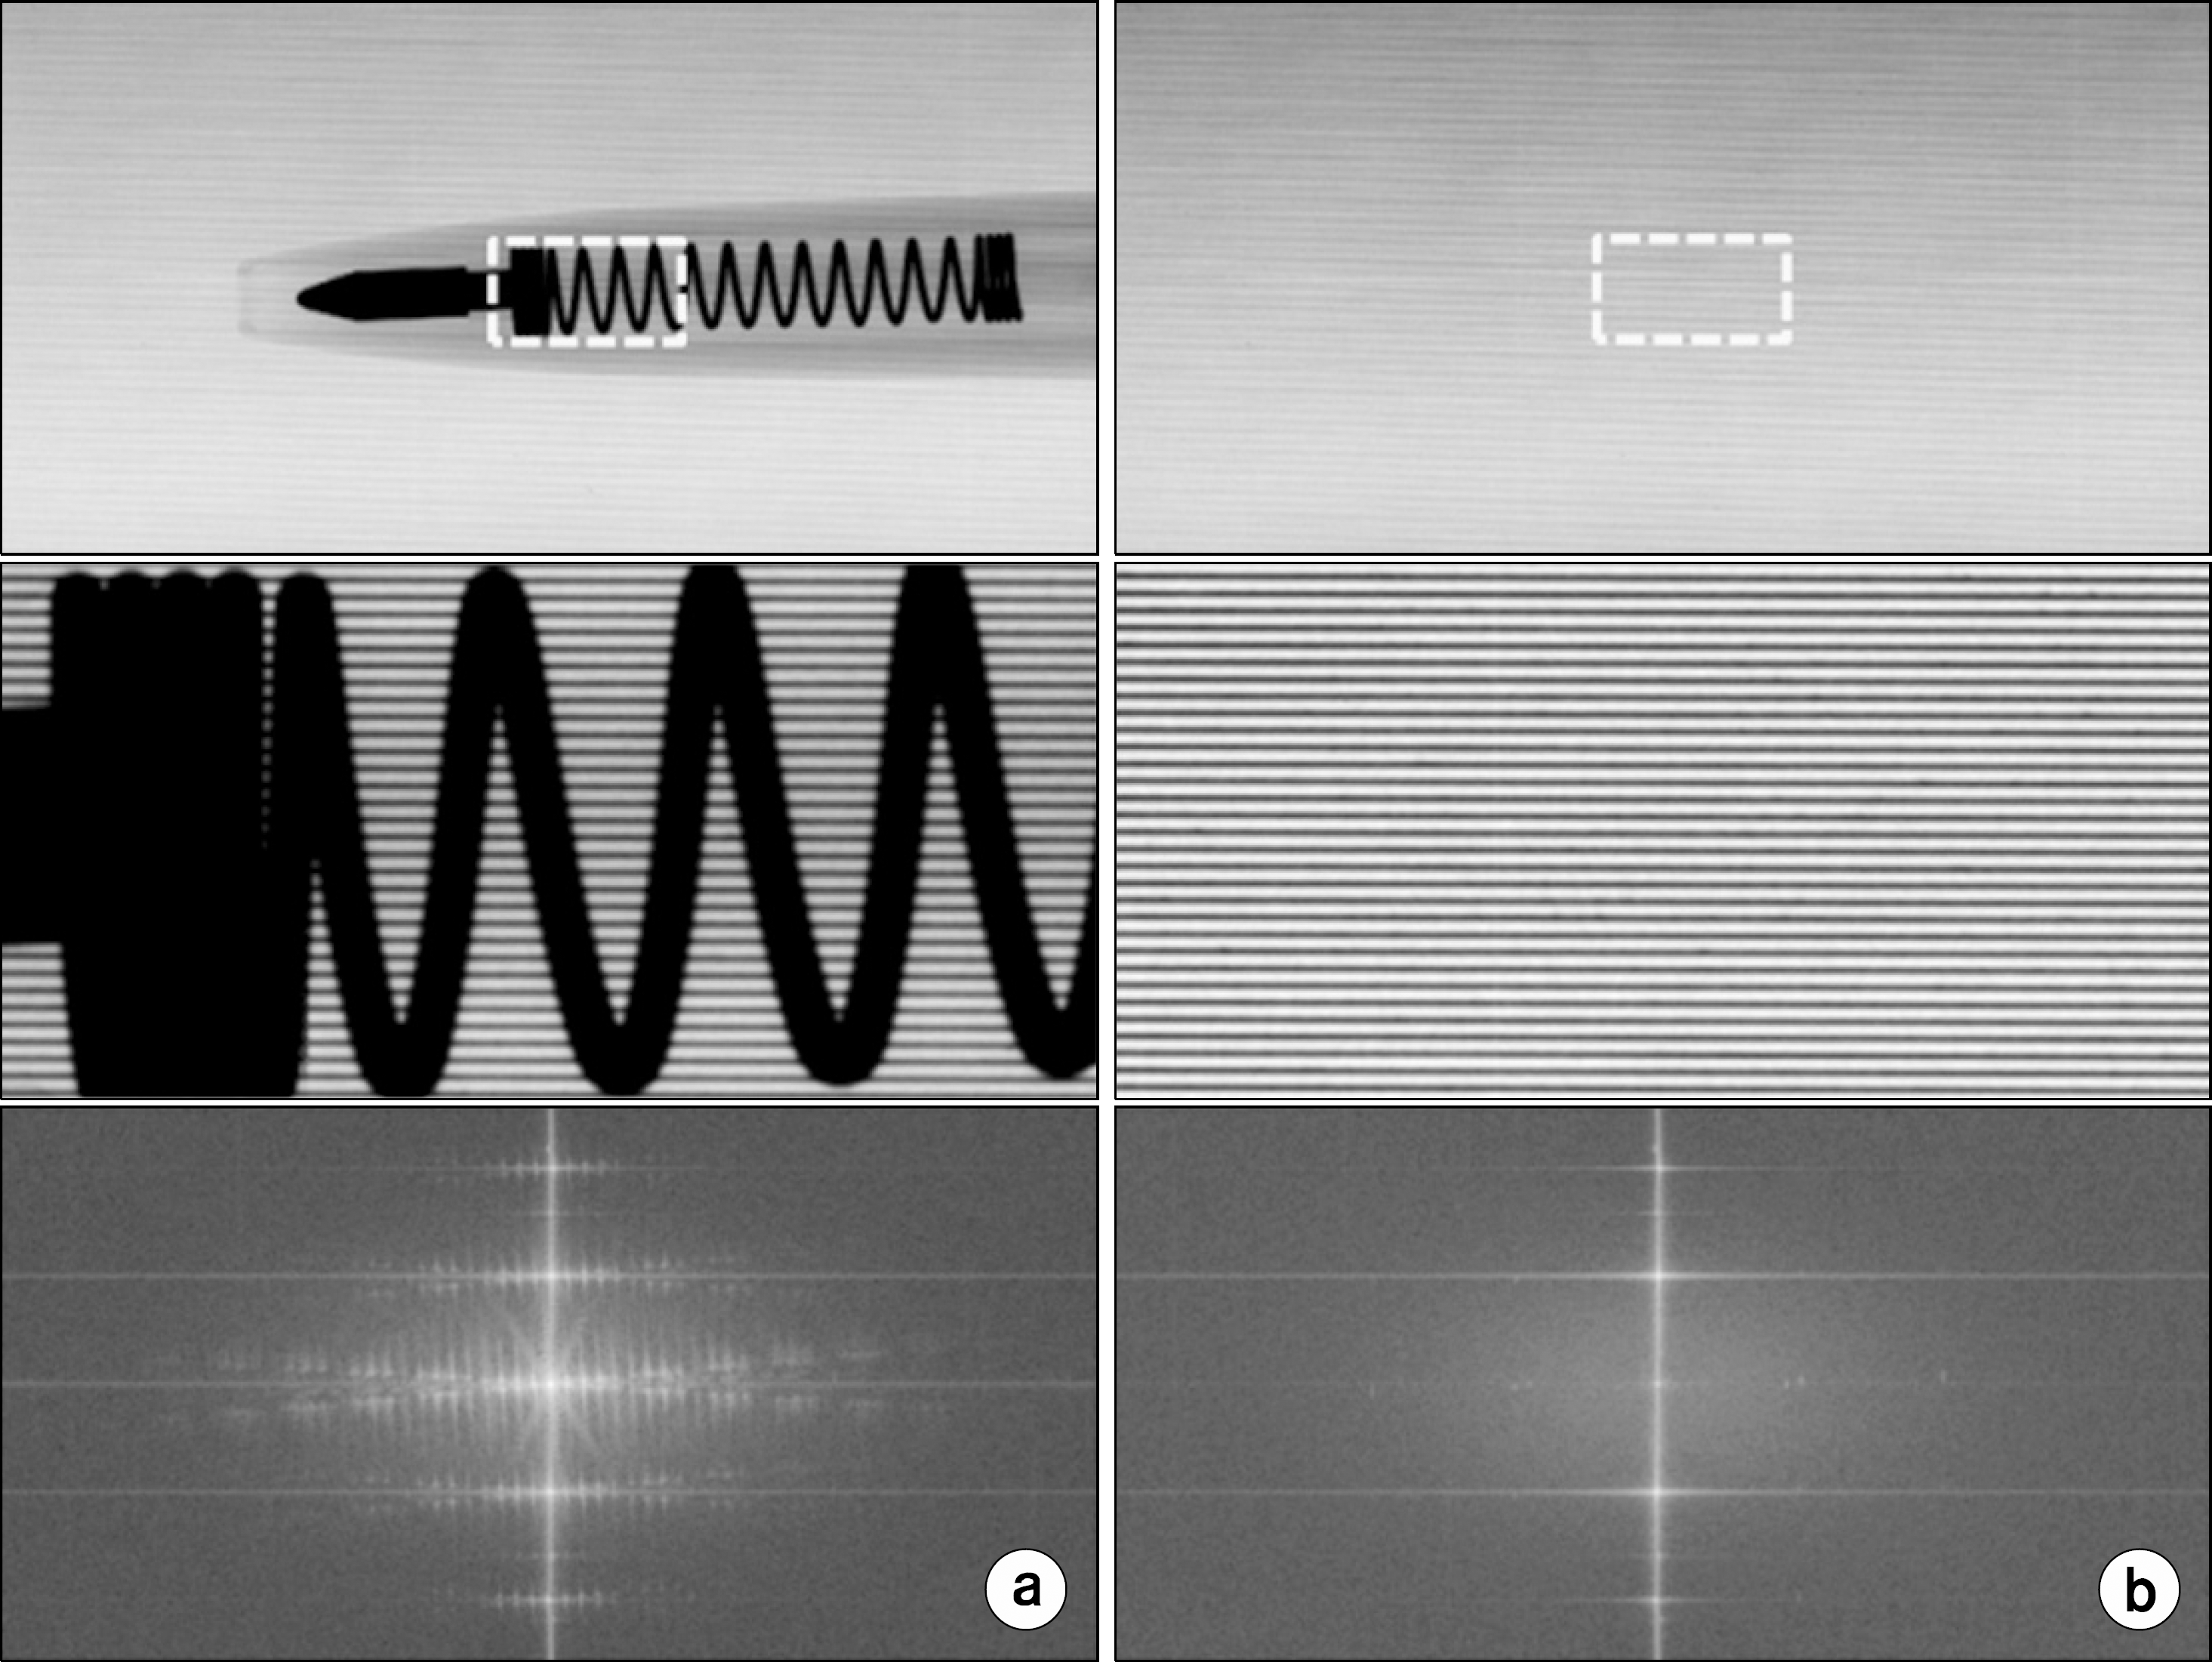 | Fig. 7.Raw images (top) and the Fourier spectrums (bottom) of (a) a ball-point pen taken with the grid and (b) the grid only (note the screen moiréin the raw images). Enlarged images of the area inside the dot box are also indicated in the middle; the grid shadow is clearly visible with no screen moiré. |
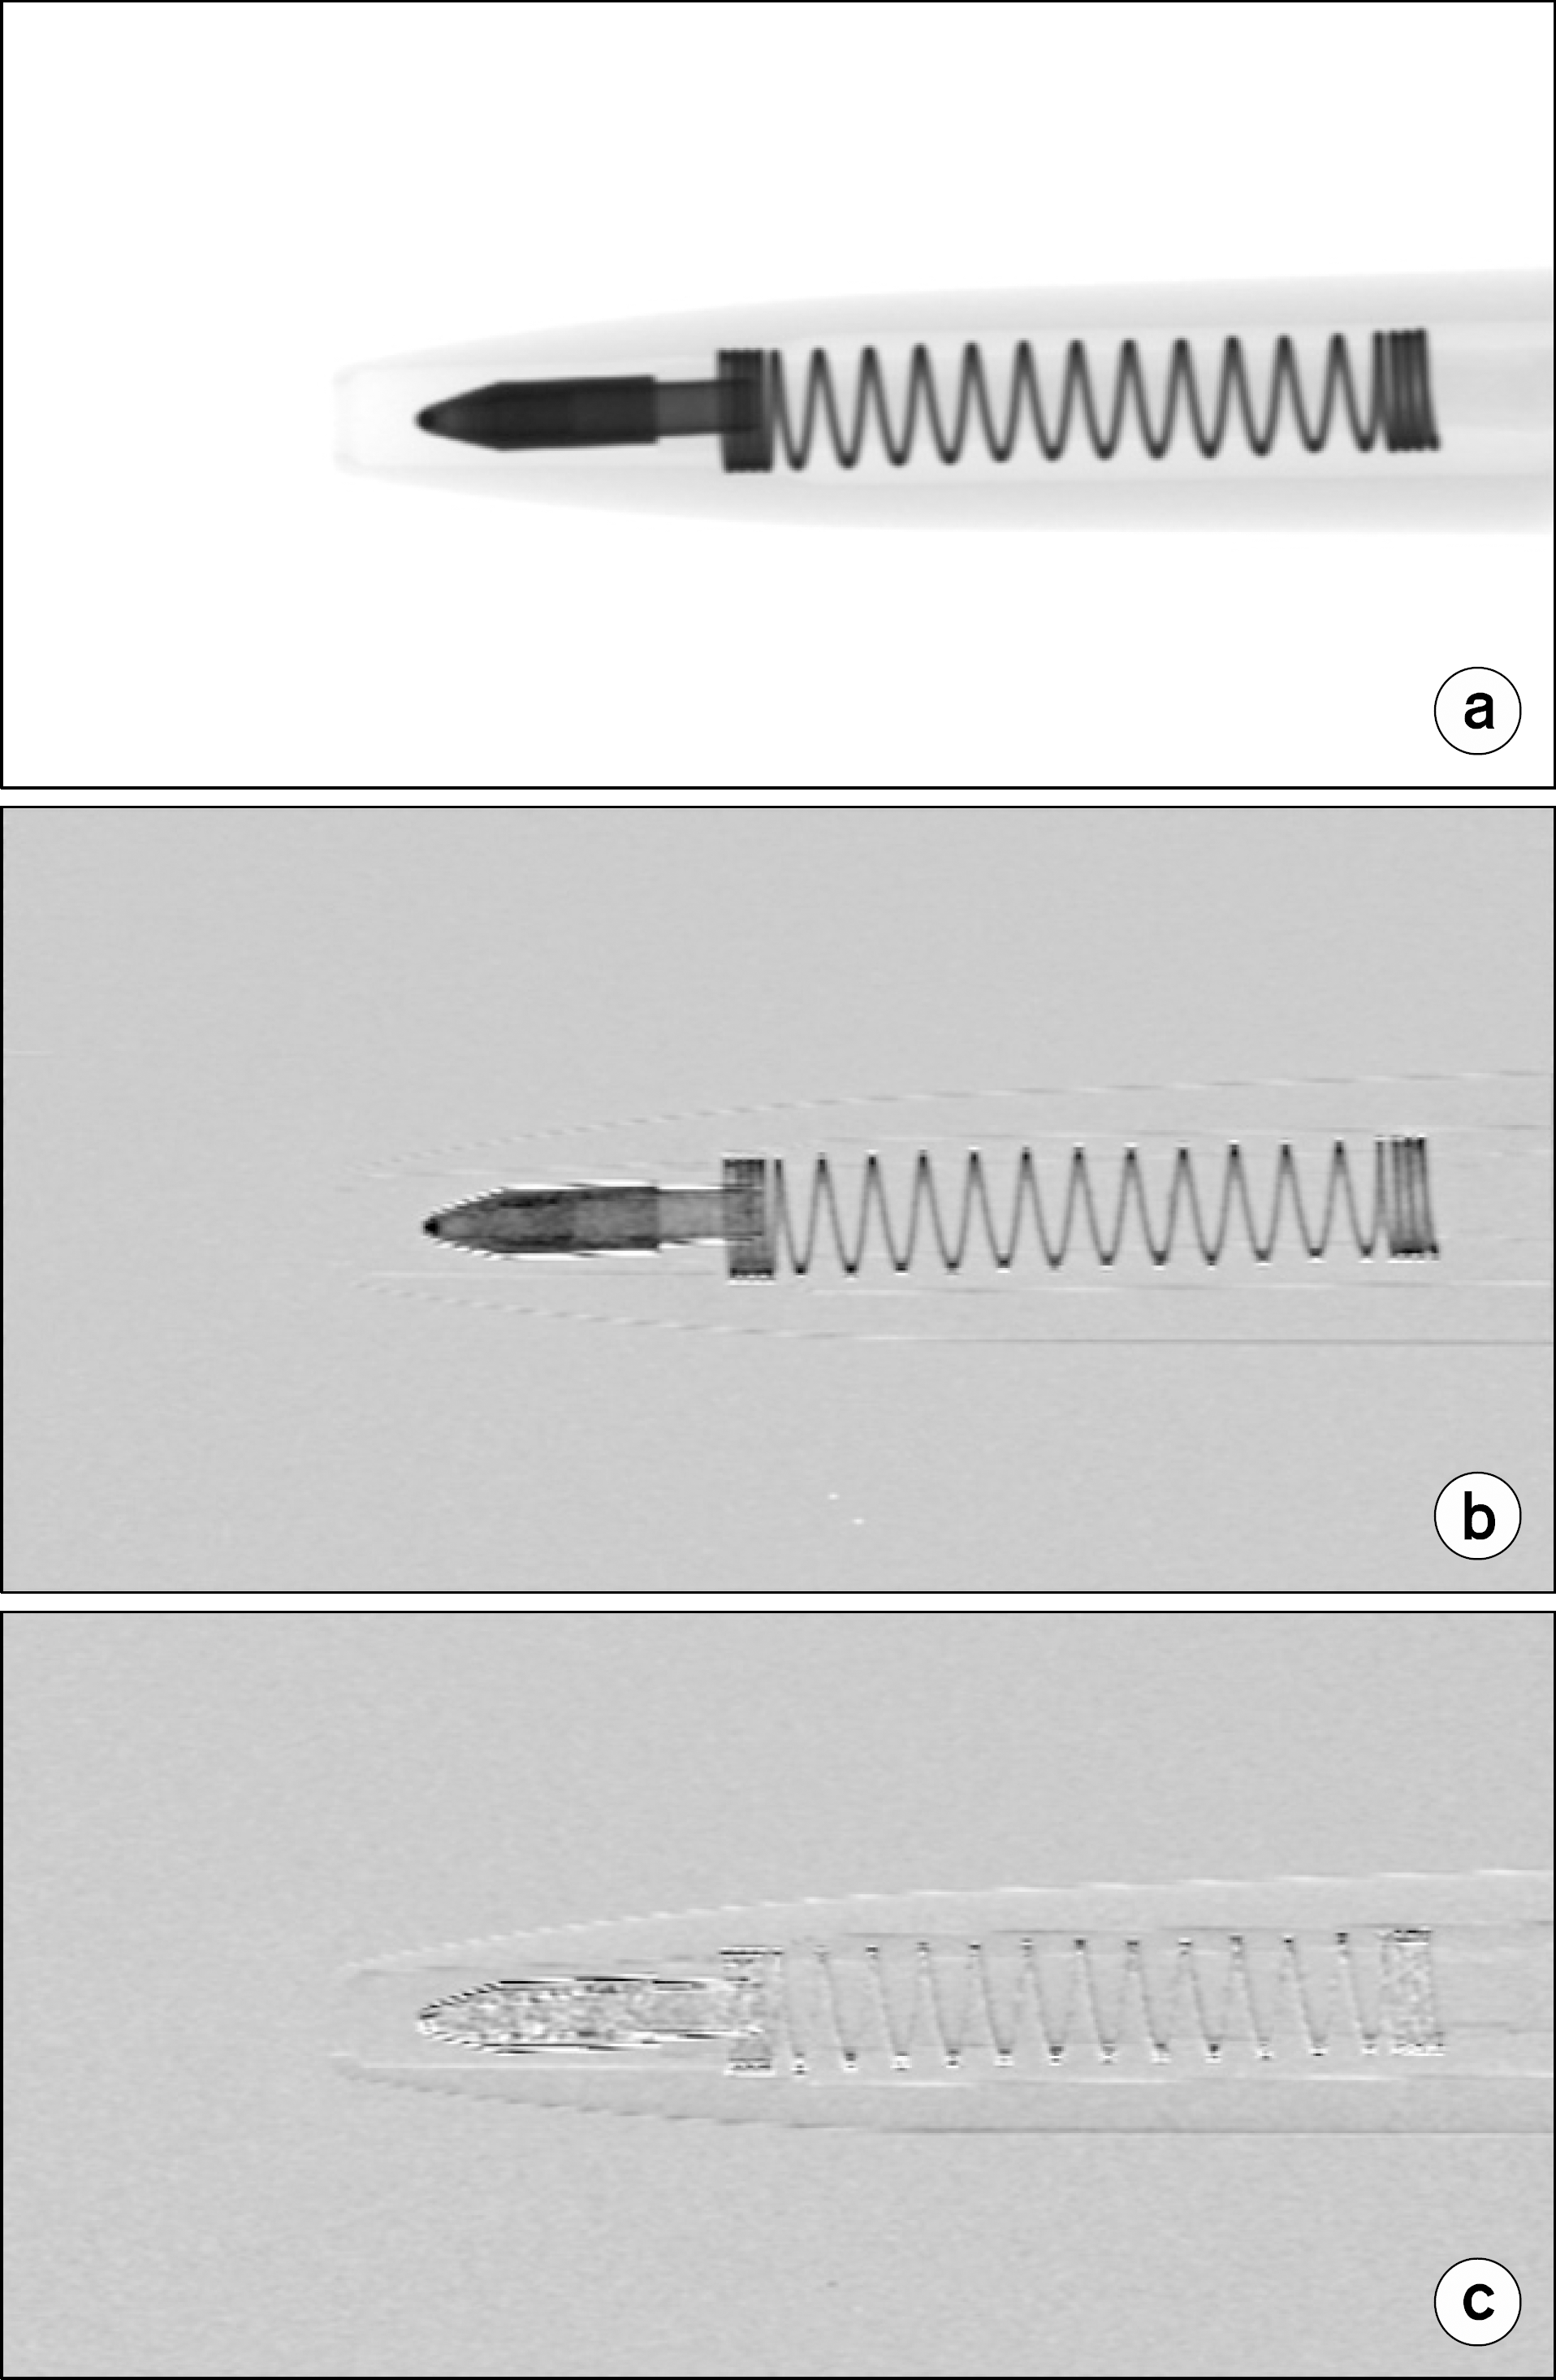 | Fig. 8.Complete sets of results retrieved from a single raw image of a ball-point pen in Fig. 7 taken at x-ray tube conditions of 90 kVp and 0.1 mAs: (a) the attenuation image, (b) the scattering image, and (c) the phase-contrast image. |
 | Fig. 9.Complete sets of results for the other samples retrieved from their raw images: (a) a toothbrush, (b) a small pill container, and (c) an acorn. |
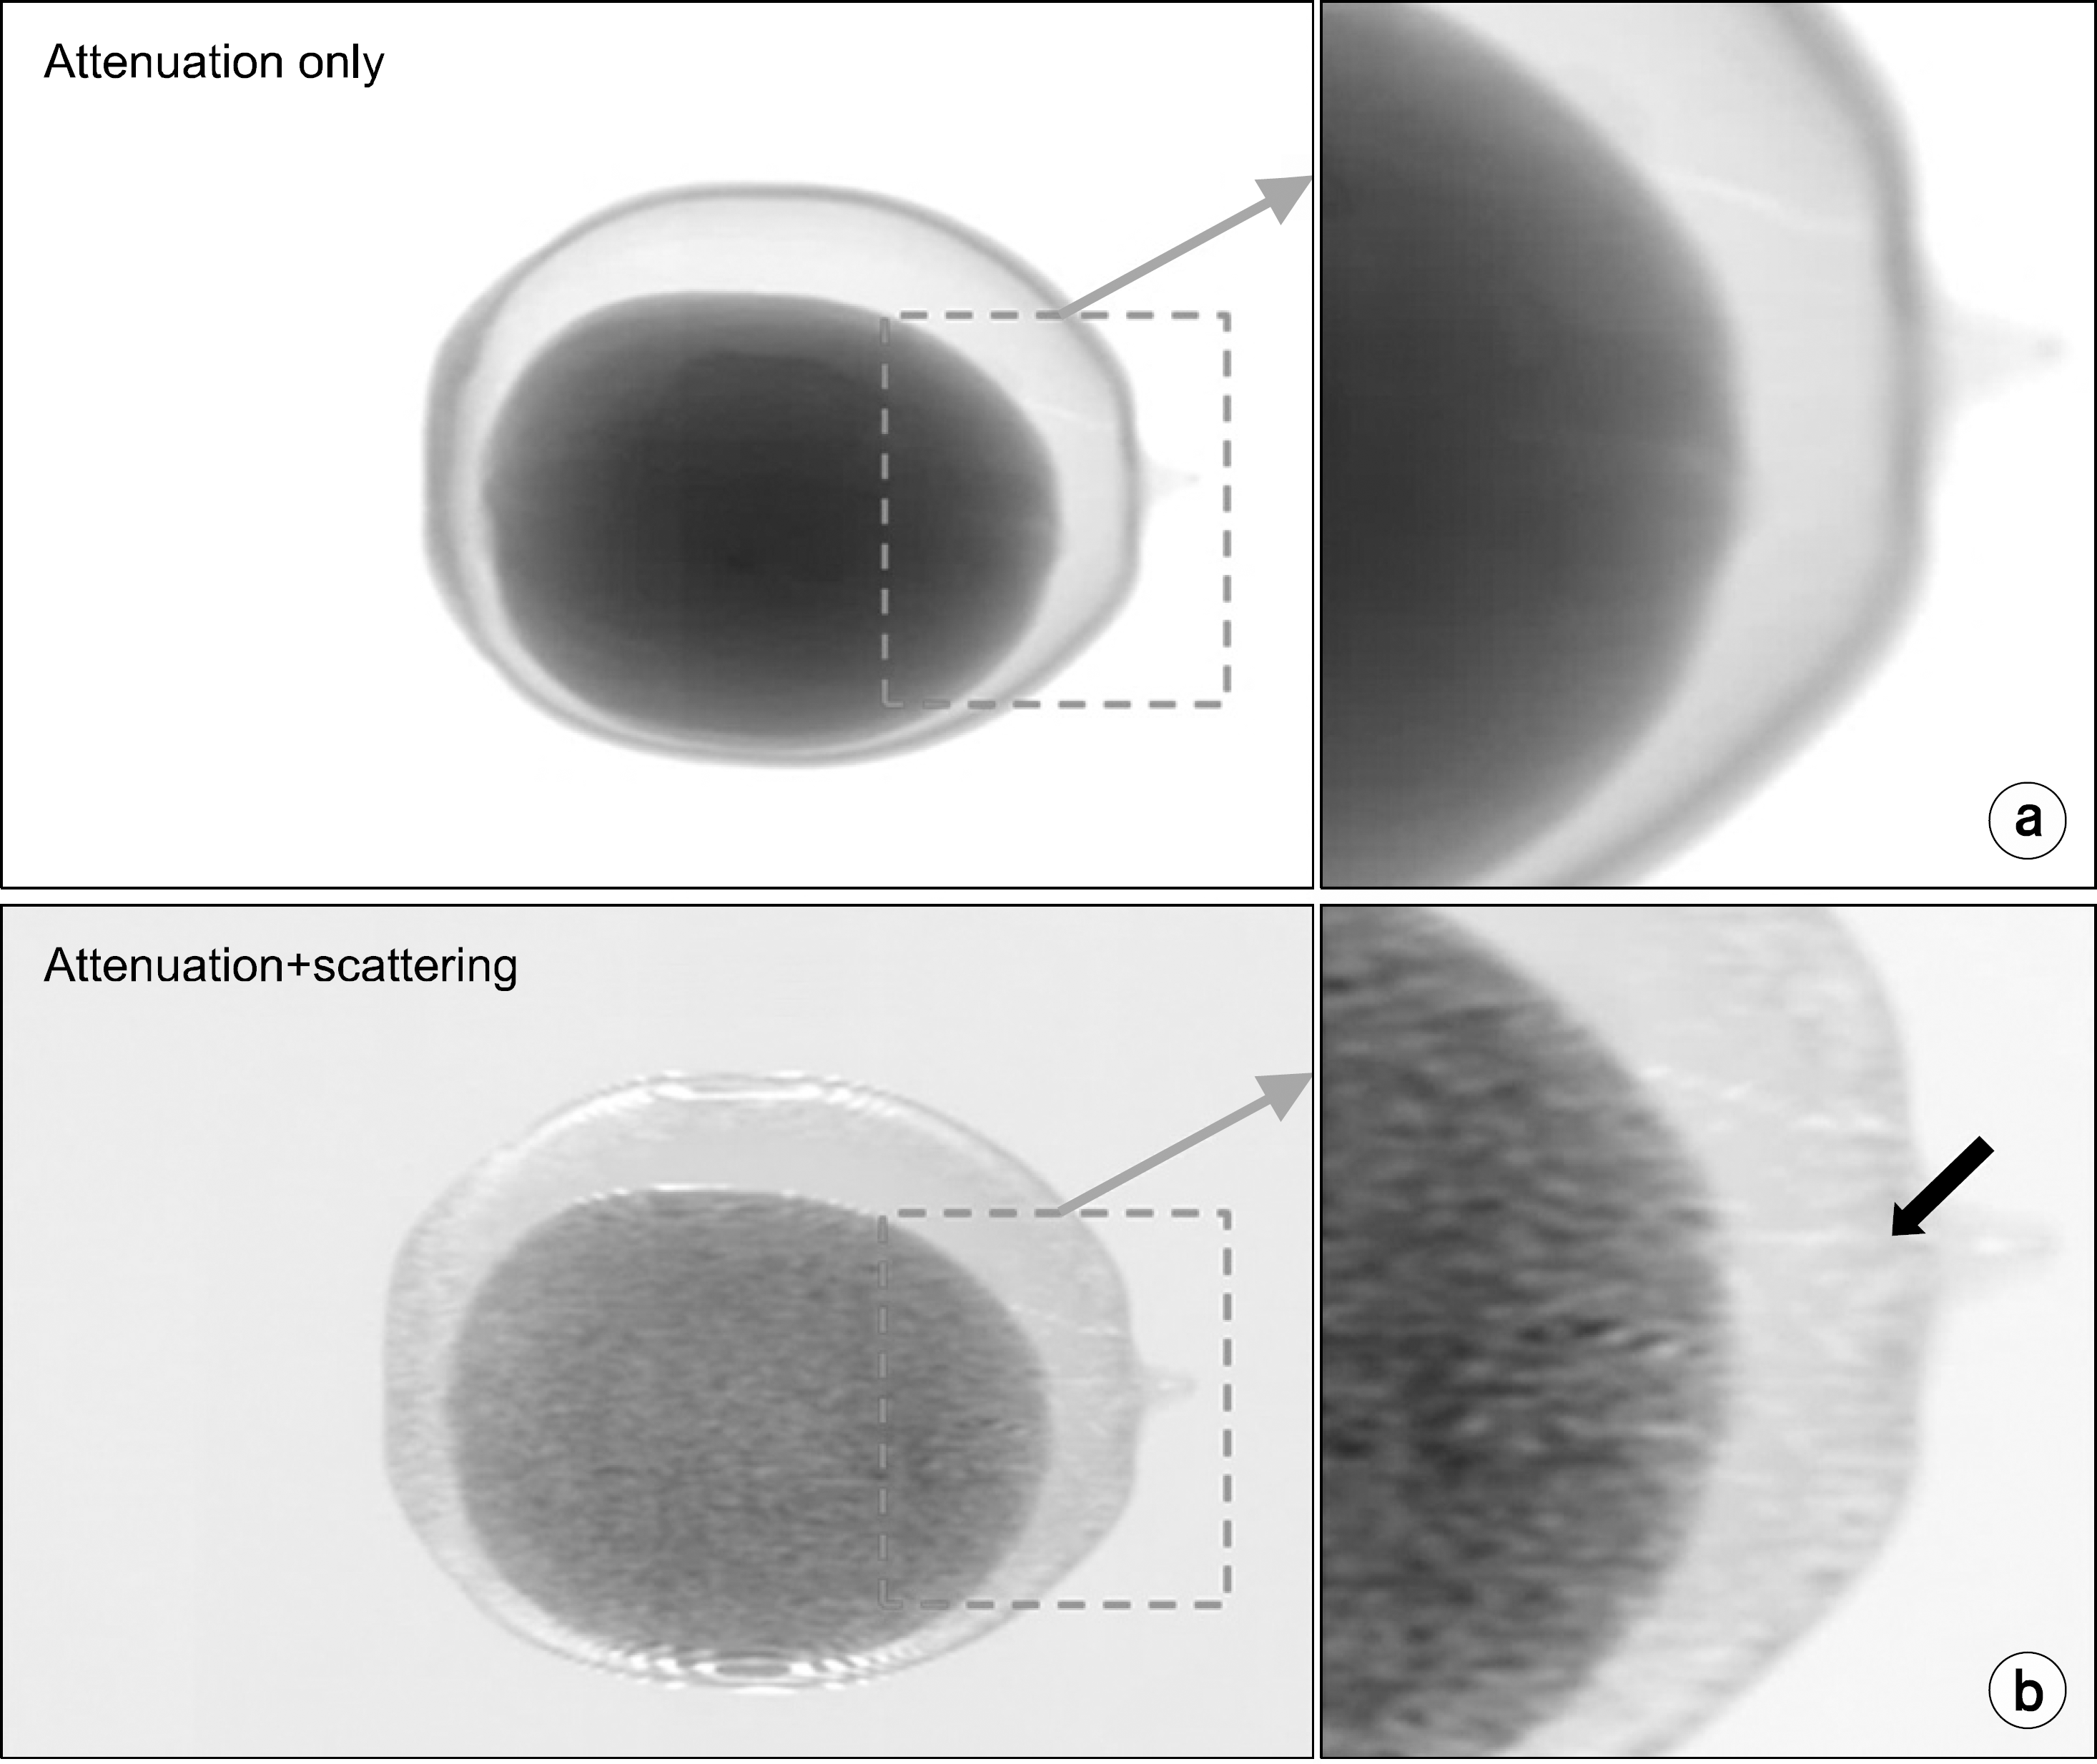 | Fig. 10.Comparison of the image characteristics between (a) the attenuation-only image and (b) the fusion image (i.e., the atte-nuation+the scattering) in Fig. 9(c). Note that the acorn gemmule indicated by an arrow in (b) is more discernable in the fusion image than in the attenuation-only image. |


 PDF
PDF ePub
ePub Citation
 Print
Print


 XML Download