Abstract
The purpose of this study is to perform a dosimetric evaluation of amplitude-based respiratory gating for the delivery of volumetric modulated arc therapy (VMAT). We selected two types of breathing patterns, subjectively among patients with respiratory-gated treatment log files. For patients that showed consistent breathing patterns (CBP) relative to the 4D CT respiration patterns, the variability of the breath-holding position during treatment was observed within the thresholds. However, patients with inconsistent breathing patterns (IBP) show differences relative to those with CBP. The relative isodose distribution was evaluated using an EBT3 film by comparing gated delivery to static delivery, and an absolute dose measurement was performed with a 0.6 cm3 Farmer-type ion chamber. The passing rate percentages under the 3%/3 mm gamma analysis for Patients 1, 2 and 3 were respectively 93.18%, 91.16%, and 95.46% for CBP, and 66.77%, 48.79%, and 40.36% for IBP. Under the more stringent criteria of 2%/2 mm, passing rates for Patients 1, 2 and 3 were respectively 73.05%, 67.14%, and 86.85% for CBP, and 46.53%, 32.73%, and 36.51% for IBP. The ion chamber measurements were within 3.5%, on average, of those calculated by the TPS and within 2.0%, on average, when compared to the static-point dose measurements for all cases of CBP. Inconsistent breathing patterns between 4D CT simulation and treatment may cause considerable dosimetric differences. Therefore, patient training is important to maintain consistent breathing amplitude during CT scan acquisition and treatment delivery.
References
1. M Teoh, C H Clark, K Wood, et al. Volumetricmodulated arctherapy: areviewofcurrentliteratureandclinicalusein practice. Br J Radiol. 84:967–996. 2011.
2. Li R, Mok E, Han B, et al. Evaluationofthegeometricaccu-racyofsurrogate-basedgatedVMATusingintrafractionkilovoltagex-rayimages. Med Phys. 39:2686–2693. 2012.
3. Choi K, Xing L, Koong A, et al. Firststudyofon-treatment volumetricimagingduringrespiratorygatedVMAT.Medical physics.UnitedStates: AmericanAssociationofPhysicistsin Medicine.40 (. 2013.
4. Jiwon Sung, Myonggeun Yoon, Weon Kuu Chung, et al. EvaluationoftheAccuracyforRespiratory-gatedRapidArc. PROGRESSinMEDICALPHYSICS.24, No.2 (. 2013.
5. G. Nicolini, E. Vanetti, A. Clivio, et al: Preclinicalevaluationofrespiratory-gateddeliveryofvolumetricmodulatedarc therapywithRapidArc.Phys.Med.Biol. 55:347–357. 2010.
6. J. Qian, L. Xing, W. Liu, et al: Doseverificationforrespiratorygatedvolumetricmodulatedarctherapy.Phys.Med.Biol. 56:4827–838. 2011.
7. Craig Riley, Yong Yang, Tianfang Li, et al. Dosimetric evaluationoftheinterplayeffectinrespiratory-gatedRapidArc radiationtherapy. Med. Phys. 41:011715. 2014.
8. Otto K. Volumetricmodulatedarctherapy: IMRTinasingle gantryarc. Med. Phys. 35(1):310–17. 2008.
9. D. A. Low, W. B. Harms, S. Mutic, et al: Atechniquefor thequantitativeevaluationofdosedistributions.Med.Phys. 25:656–661. 1998.
10. N. Agazaryan, T. D. Solberg, J. J. DeMarco: Patient specificqualityassuranceforthedeliveryofintensitymodulated radiotherapy.J.Appl.Clin.Med.Phys. 4:40–50. 2003.
11. Valeria Casanova Borca, Massimo Pasquino, Giuliana Russo, et al. DosimetriccharacterizationanduseofGAFCH-ROMICEBT3filmforIMRTdoseverification.J.ofAppl.Clin. Med.Phys.14: No.2 (. 2013.
12. Kan MWK, Cheung JYC, Leung LHT, et al. Theaccuracy ofdosecalculationsbyanisotropicanalyticalalgorithmsforster-eotacticradiotherapyinnasopharyngealcarcinoma.Phys.Med. Biol. 56:397. 2011.
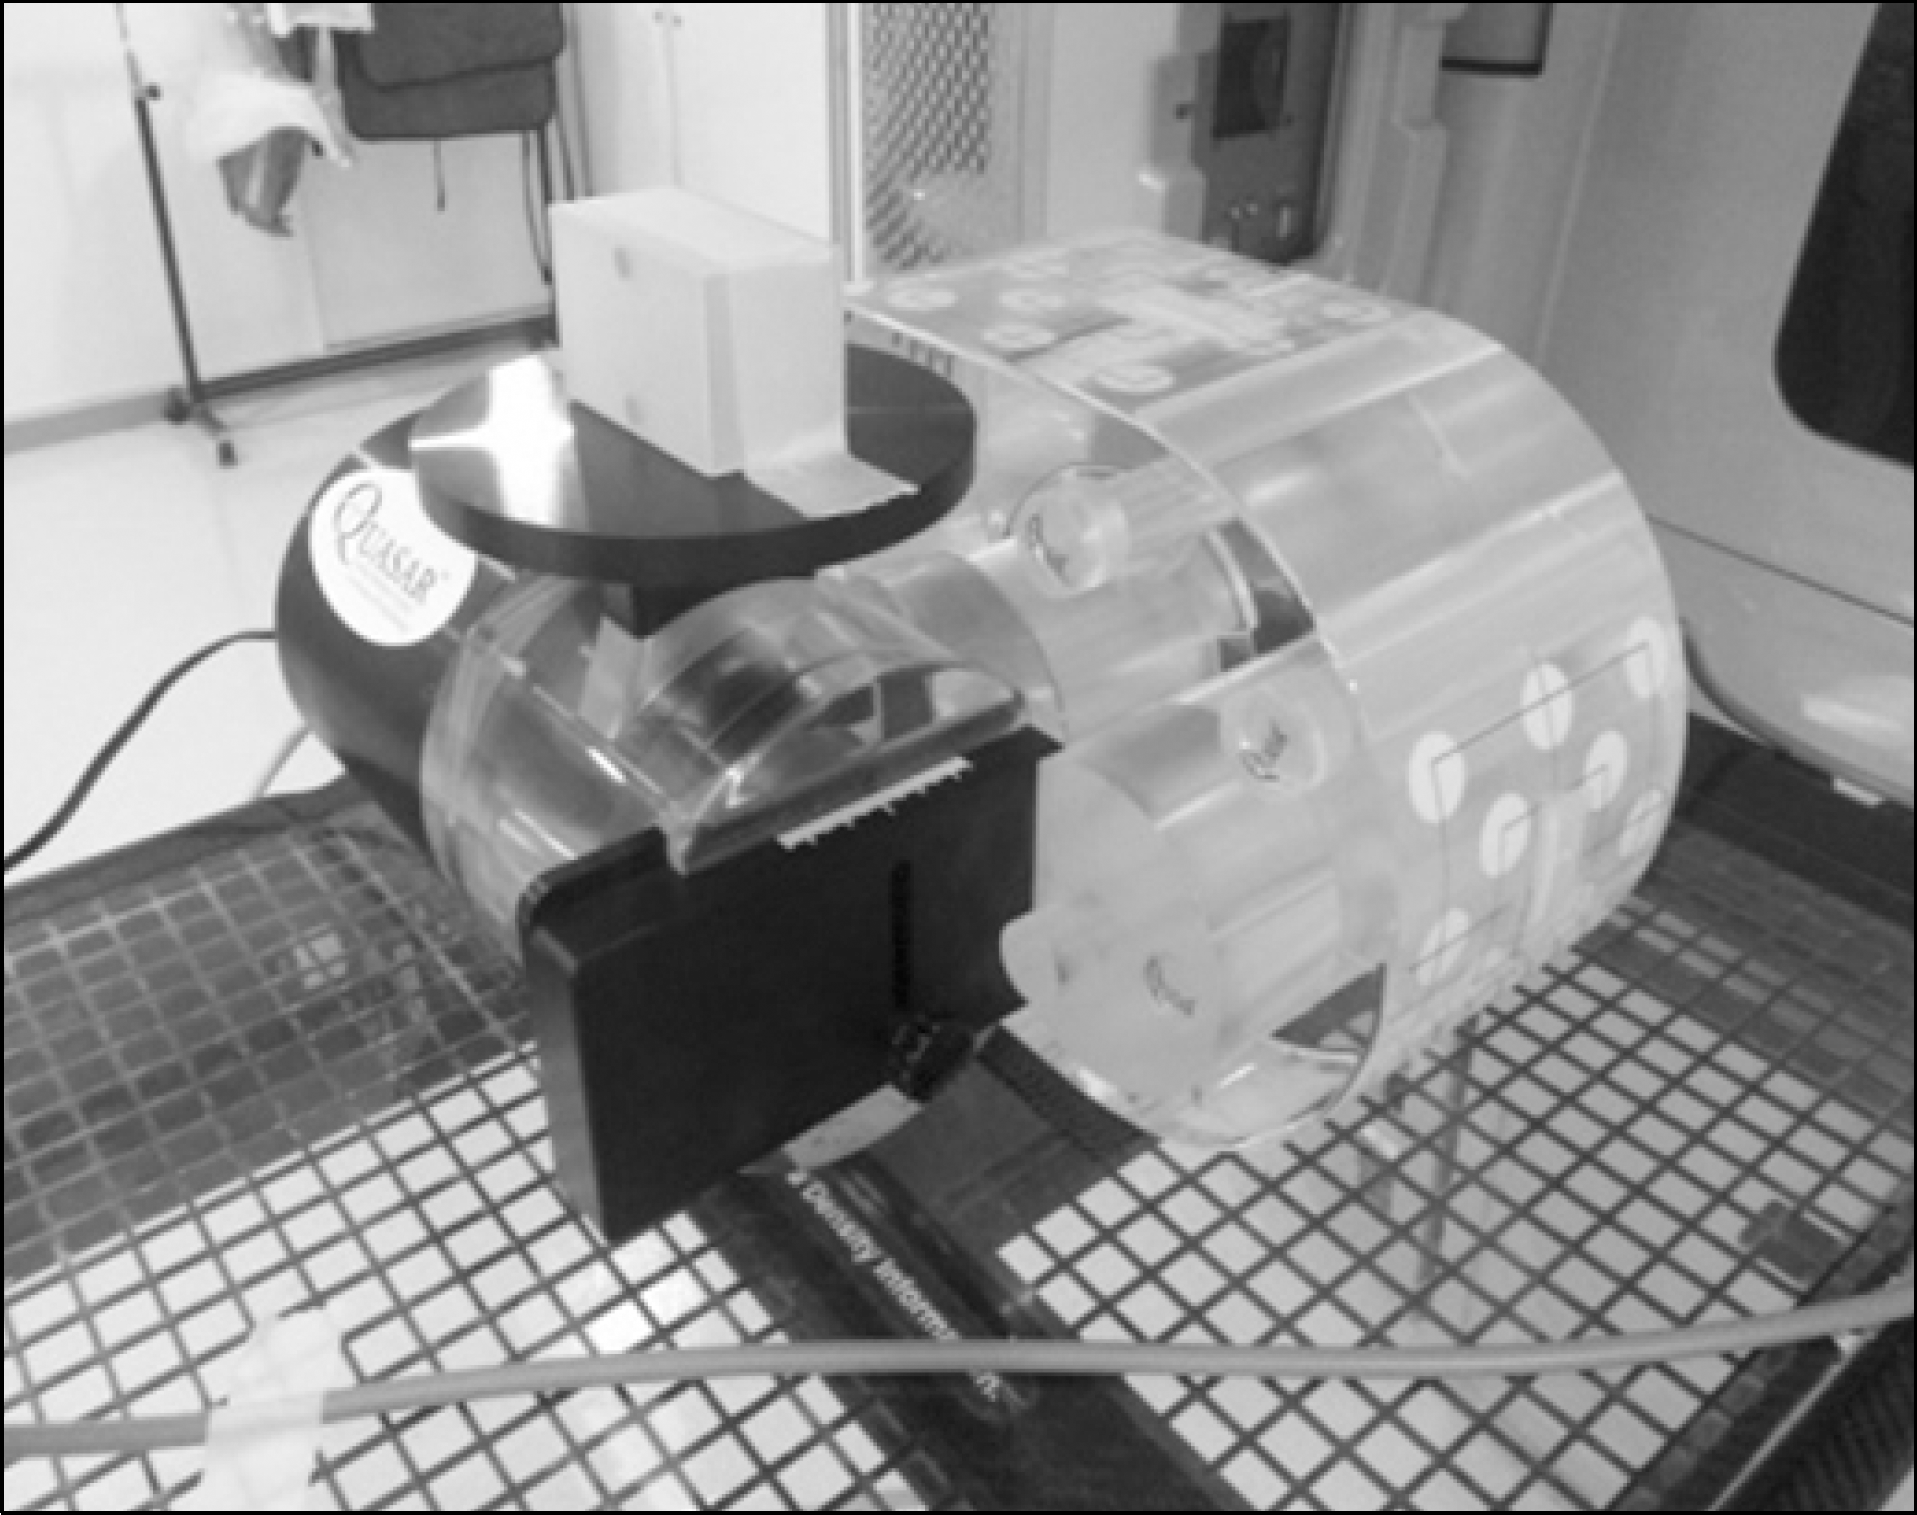
Fig. 1.
Experimental setup of the programmable respiratory motion phantom. The insert containing the film or ion chamber moves in the inferior-superior direction, and the top platform moves in the anterior-posterior direction for the RPM block.

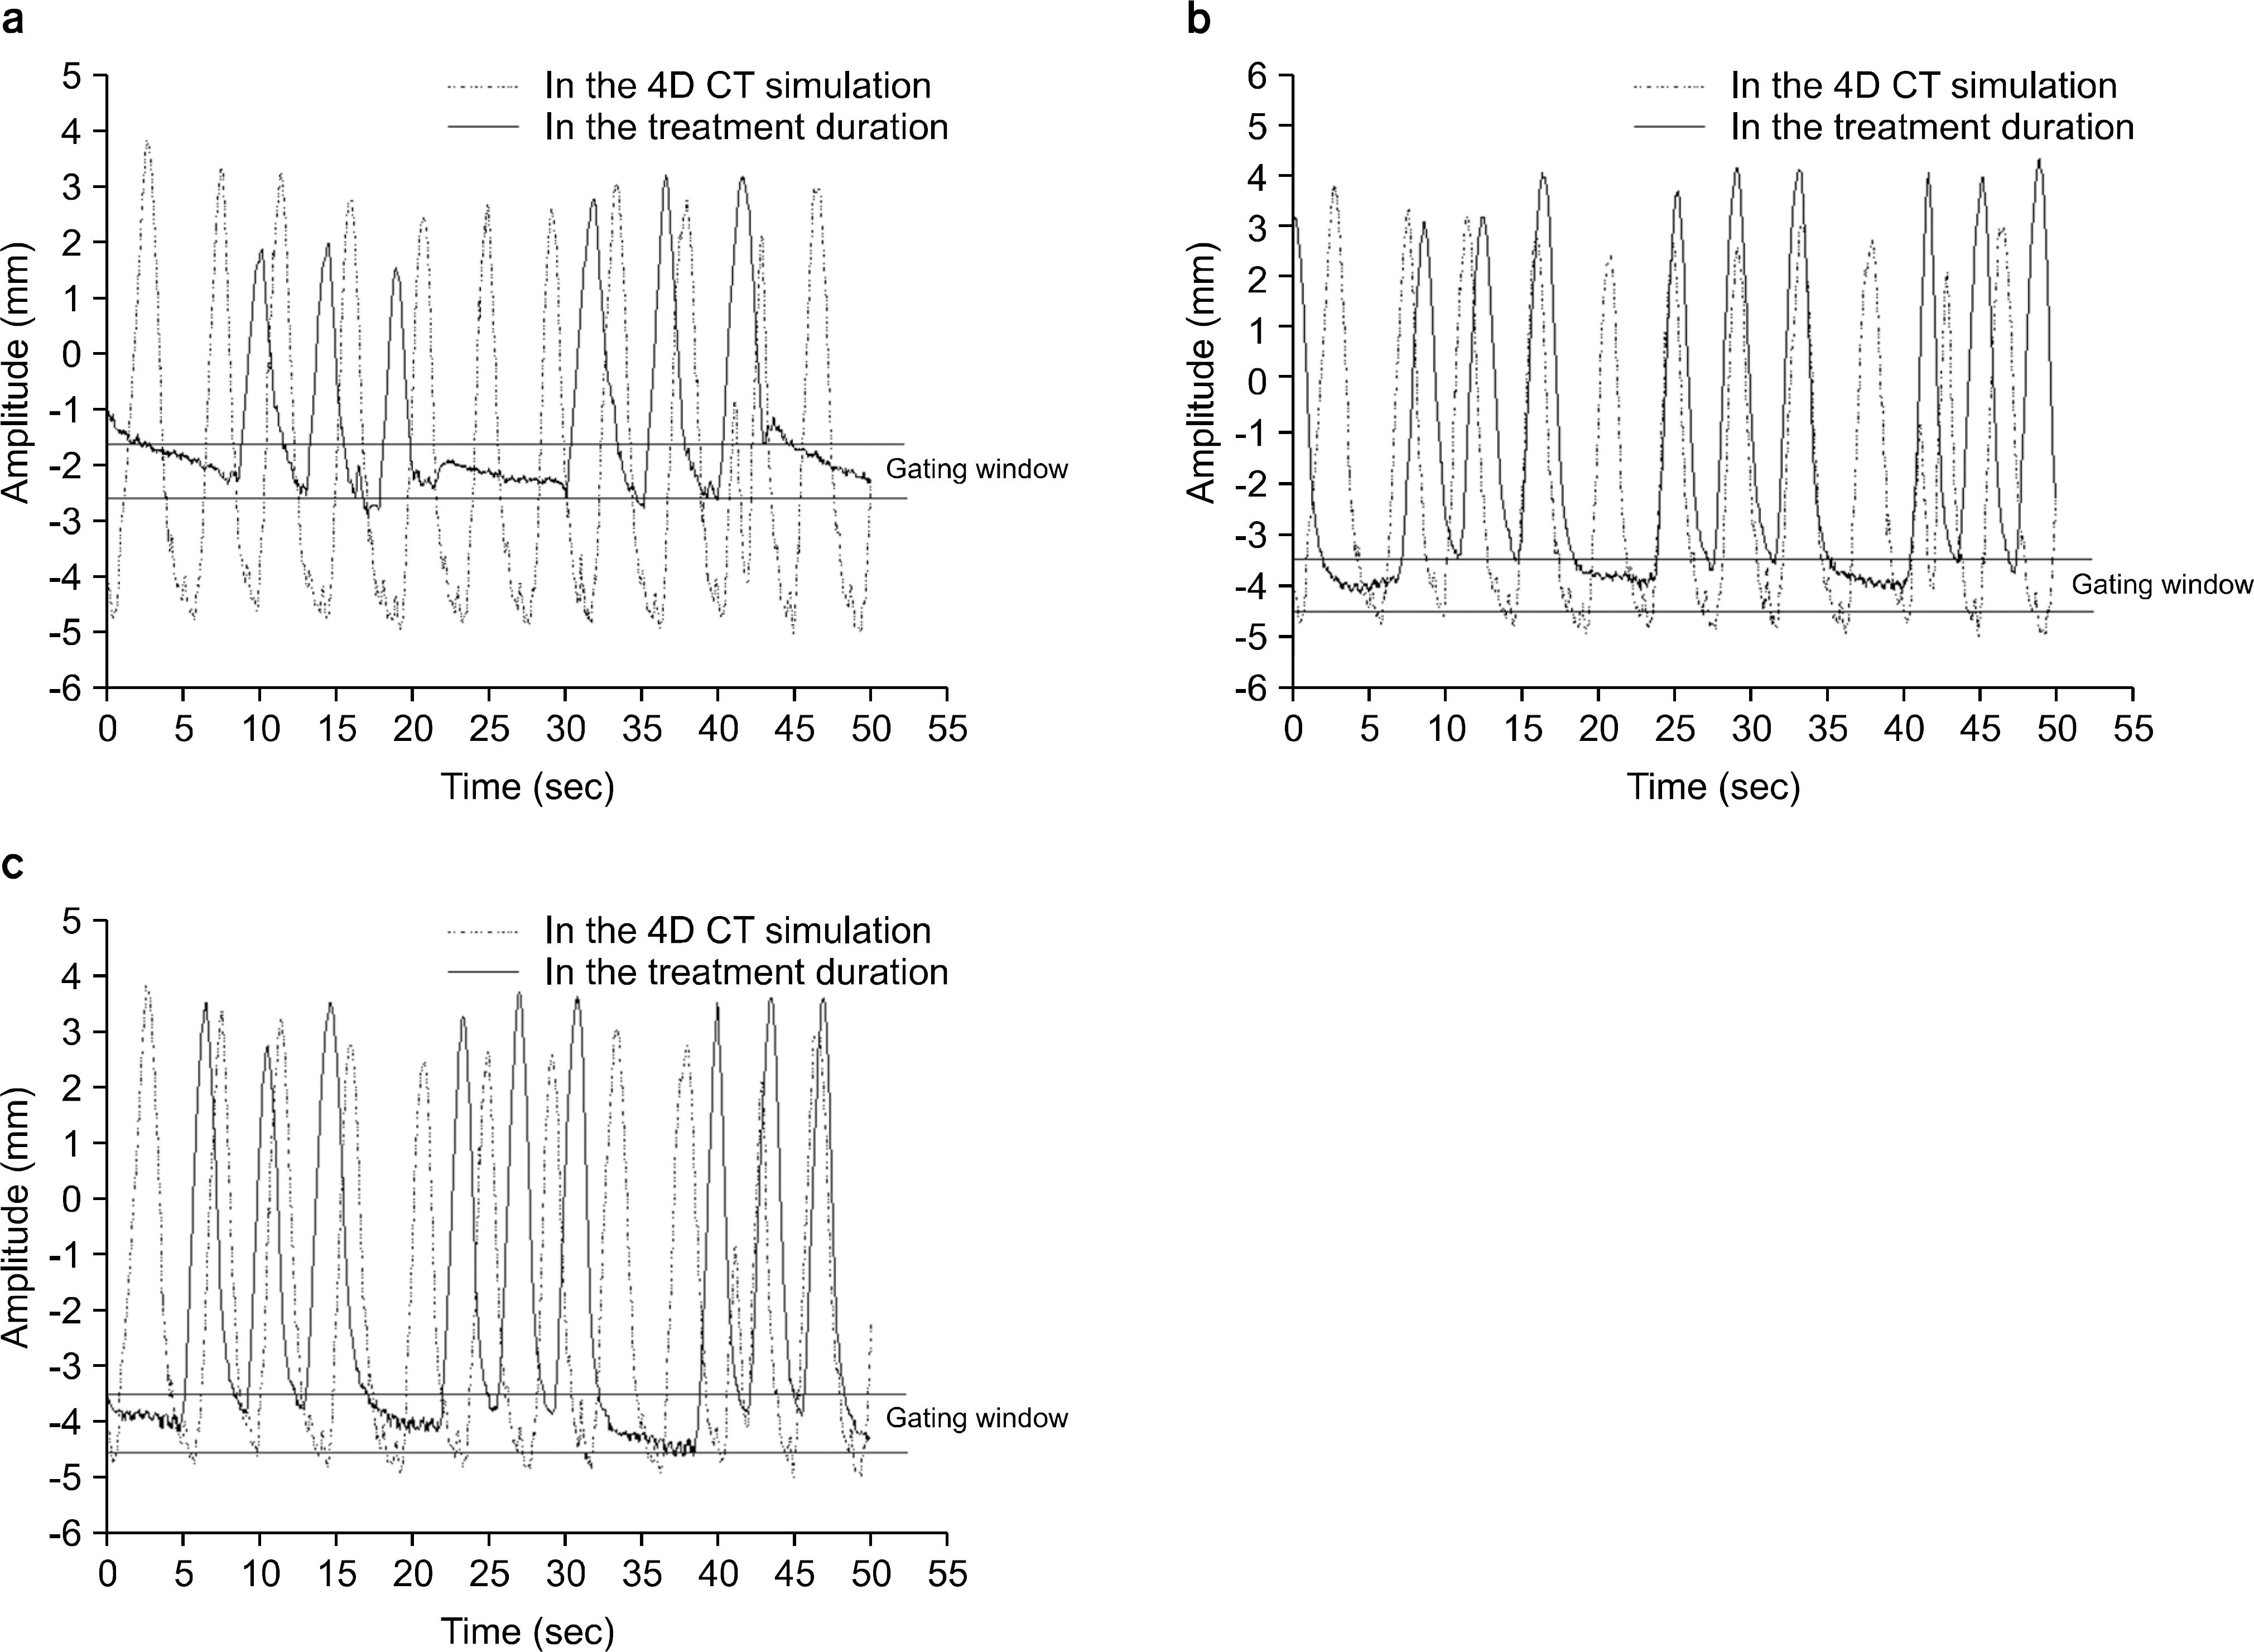
Fig. 2.
The respiratory curves for Patient 1 corresponding to 1st (a), 2nd (b), and 3rd (c) fraction of the treatment. The beam “ON” is triggered at the gating window.

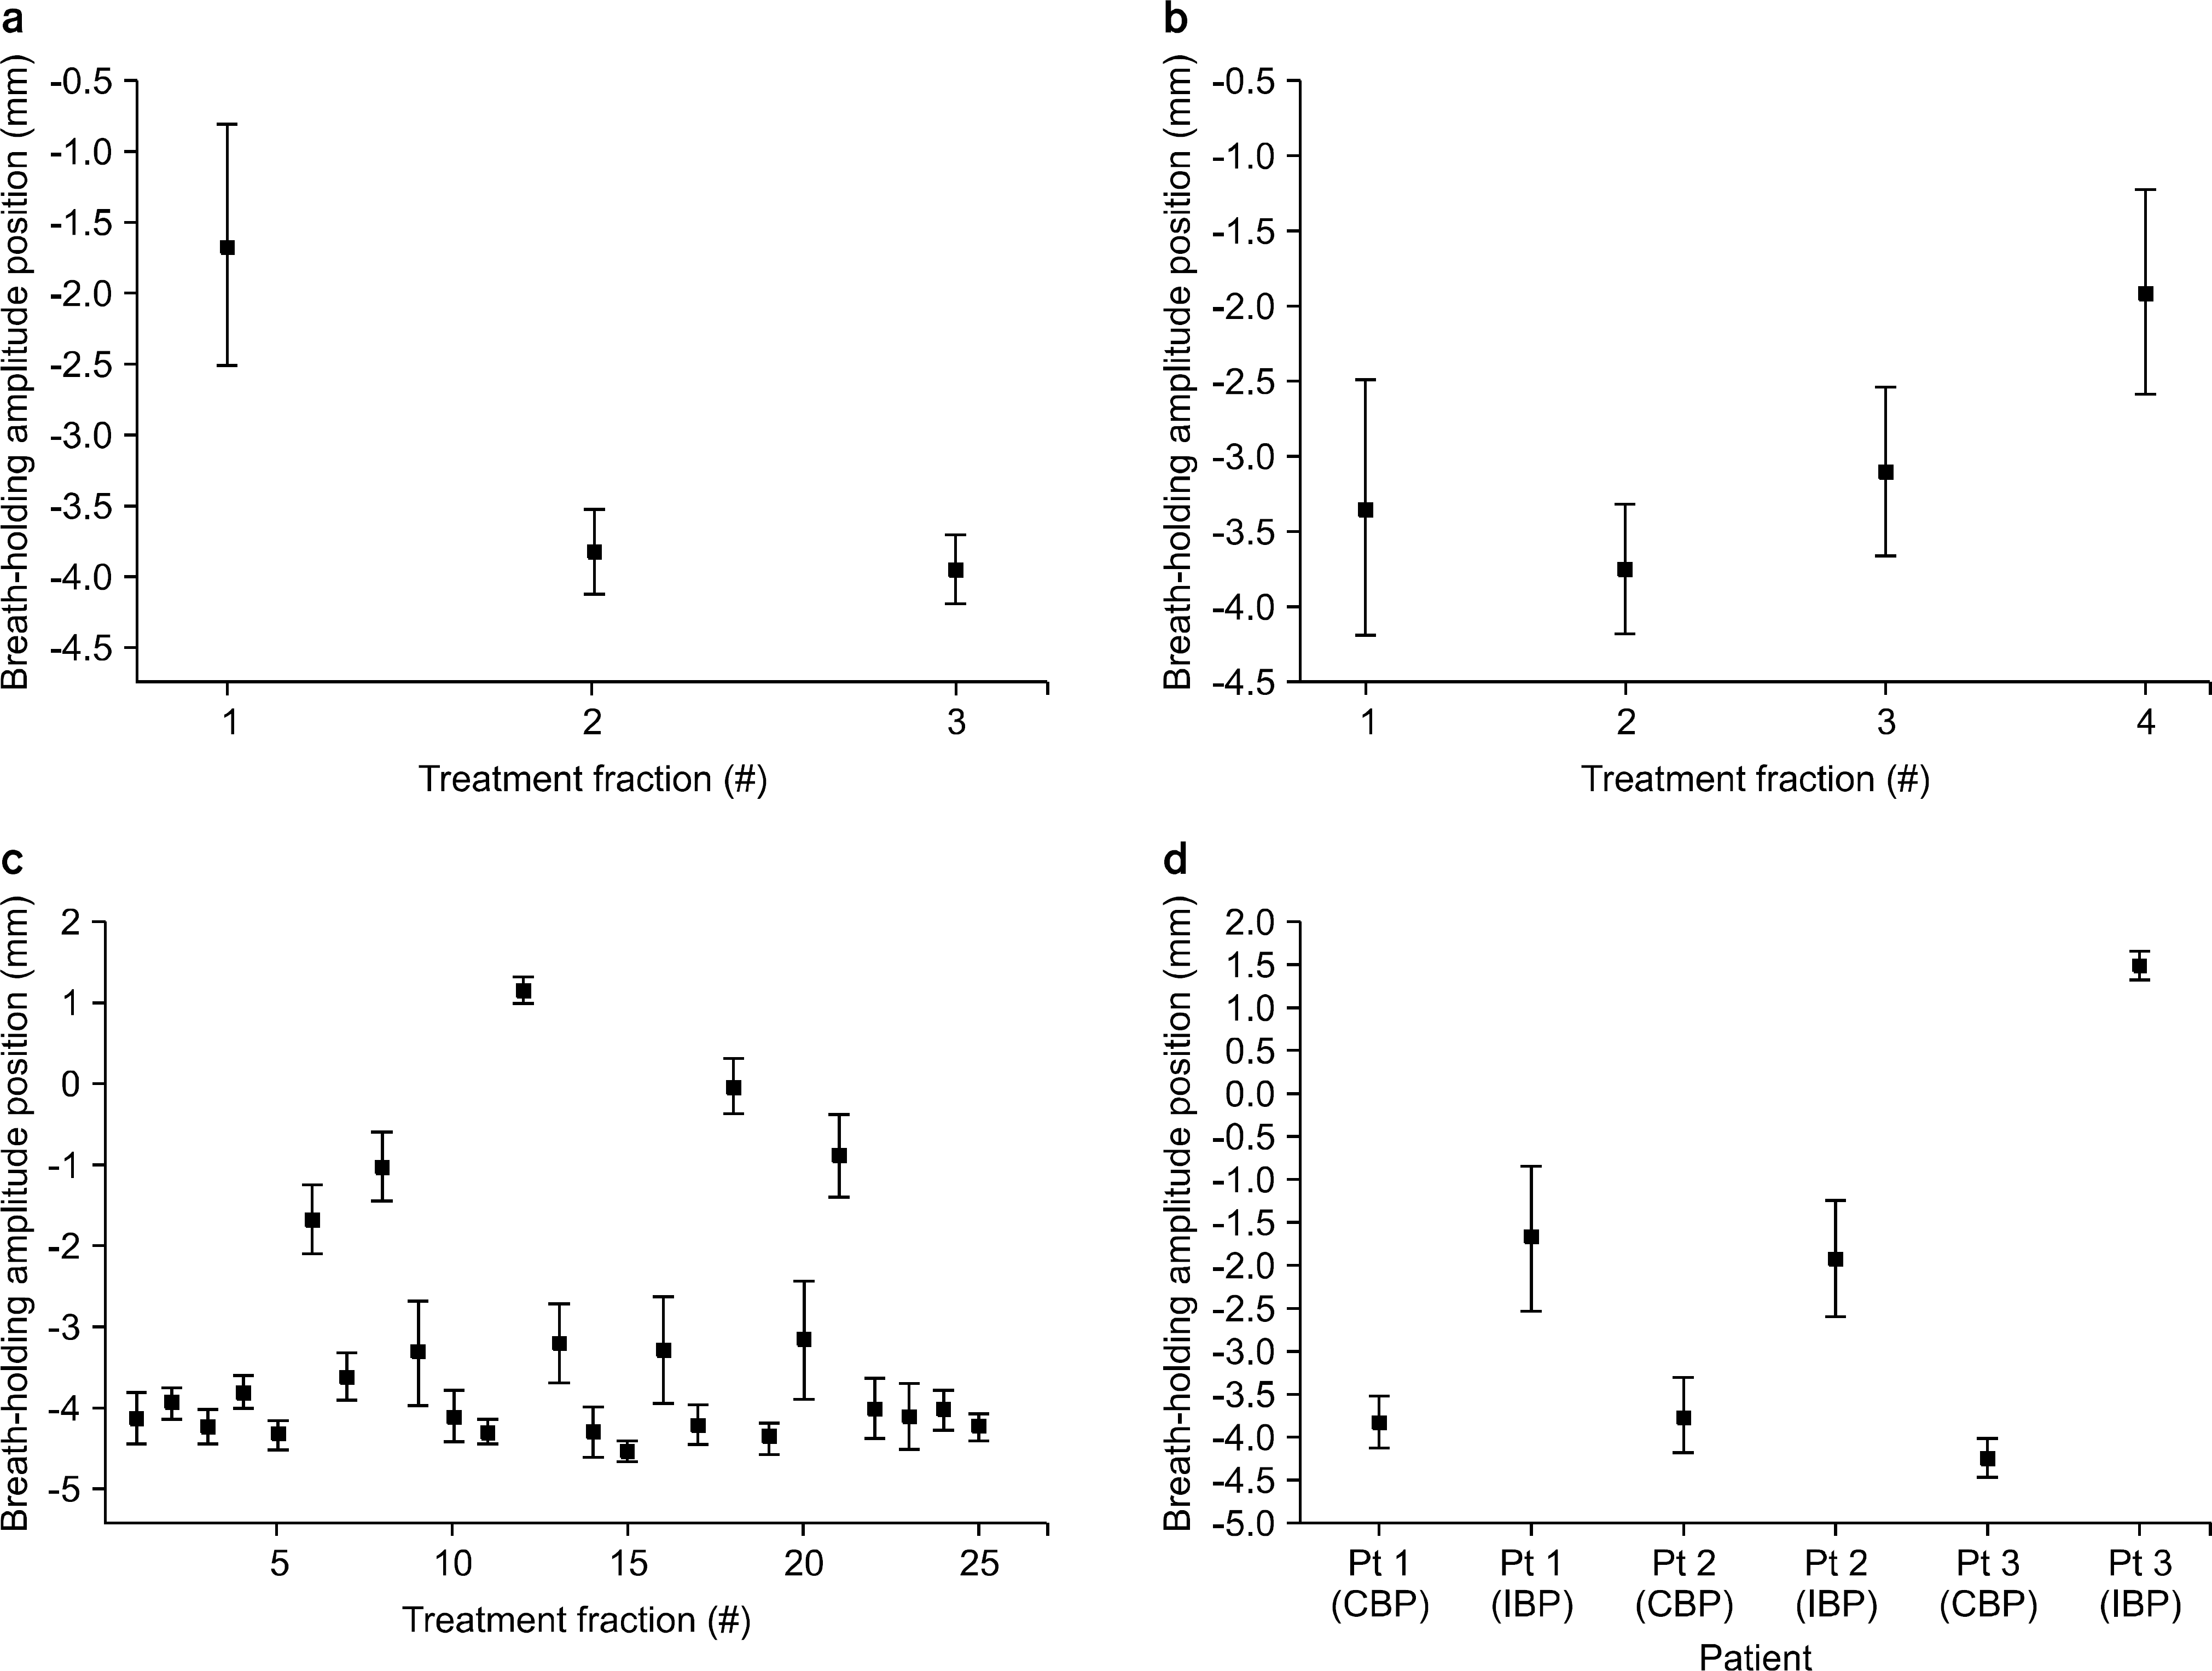
Fig. 3.
The breath-holding position from marker signals are shown specifically for Patients 1 (a), 2 (b), and 3 (c). The error bars represent the amplitude standard deviations determined over the duration of the treatment. Subjectively selected patients' breathing patterns (d) are shown.

Fig. 4.
Isodose distributions and gamma statistics comparison of gated VMAT (thin solid) vs static (thick solid) dose delivery based on the patient's respiratory trace data sets. The isodose levels shown are 90%, 70%, 50%, and 30%, and the gamma pass-rate maps show a 3% dose difference, with a 3 mm distance-to-agreement criteria.

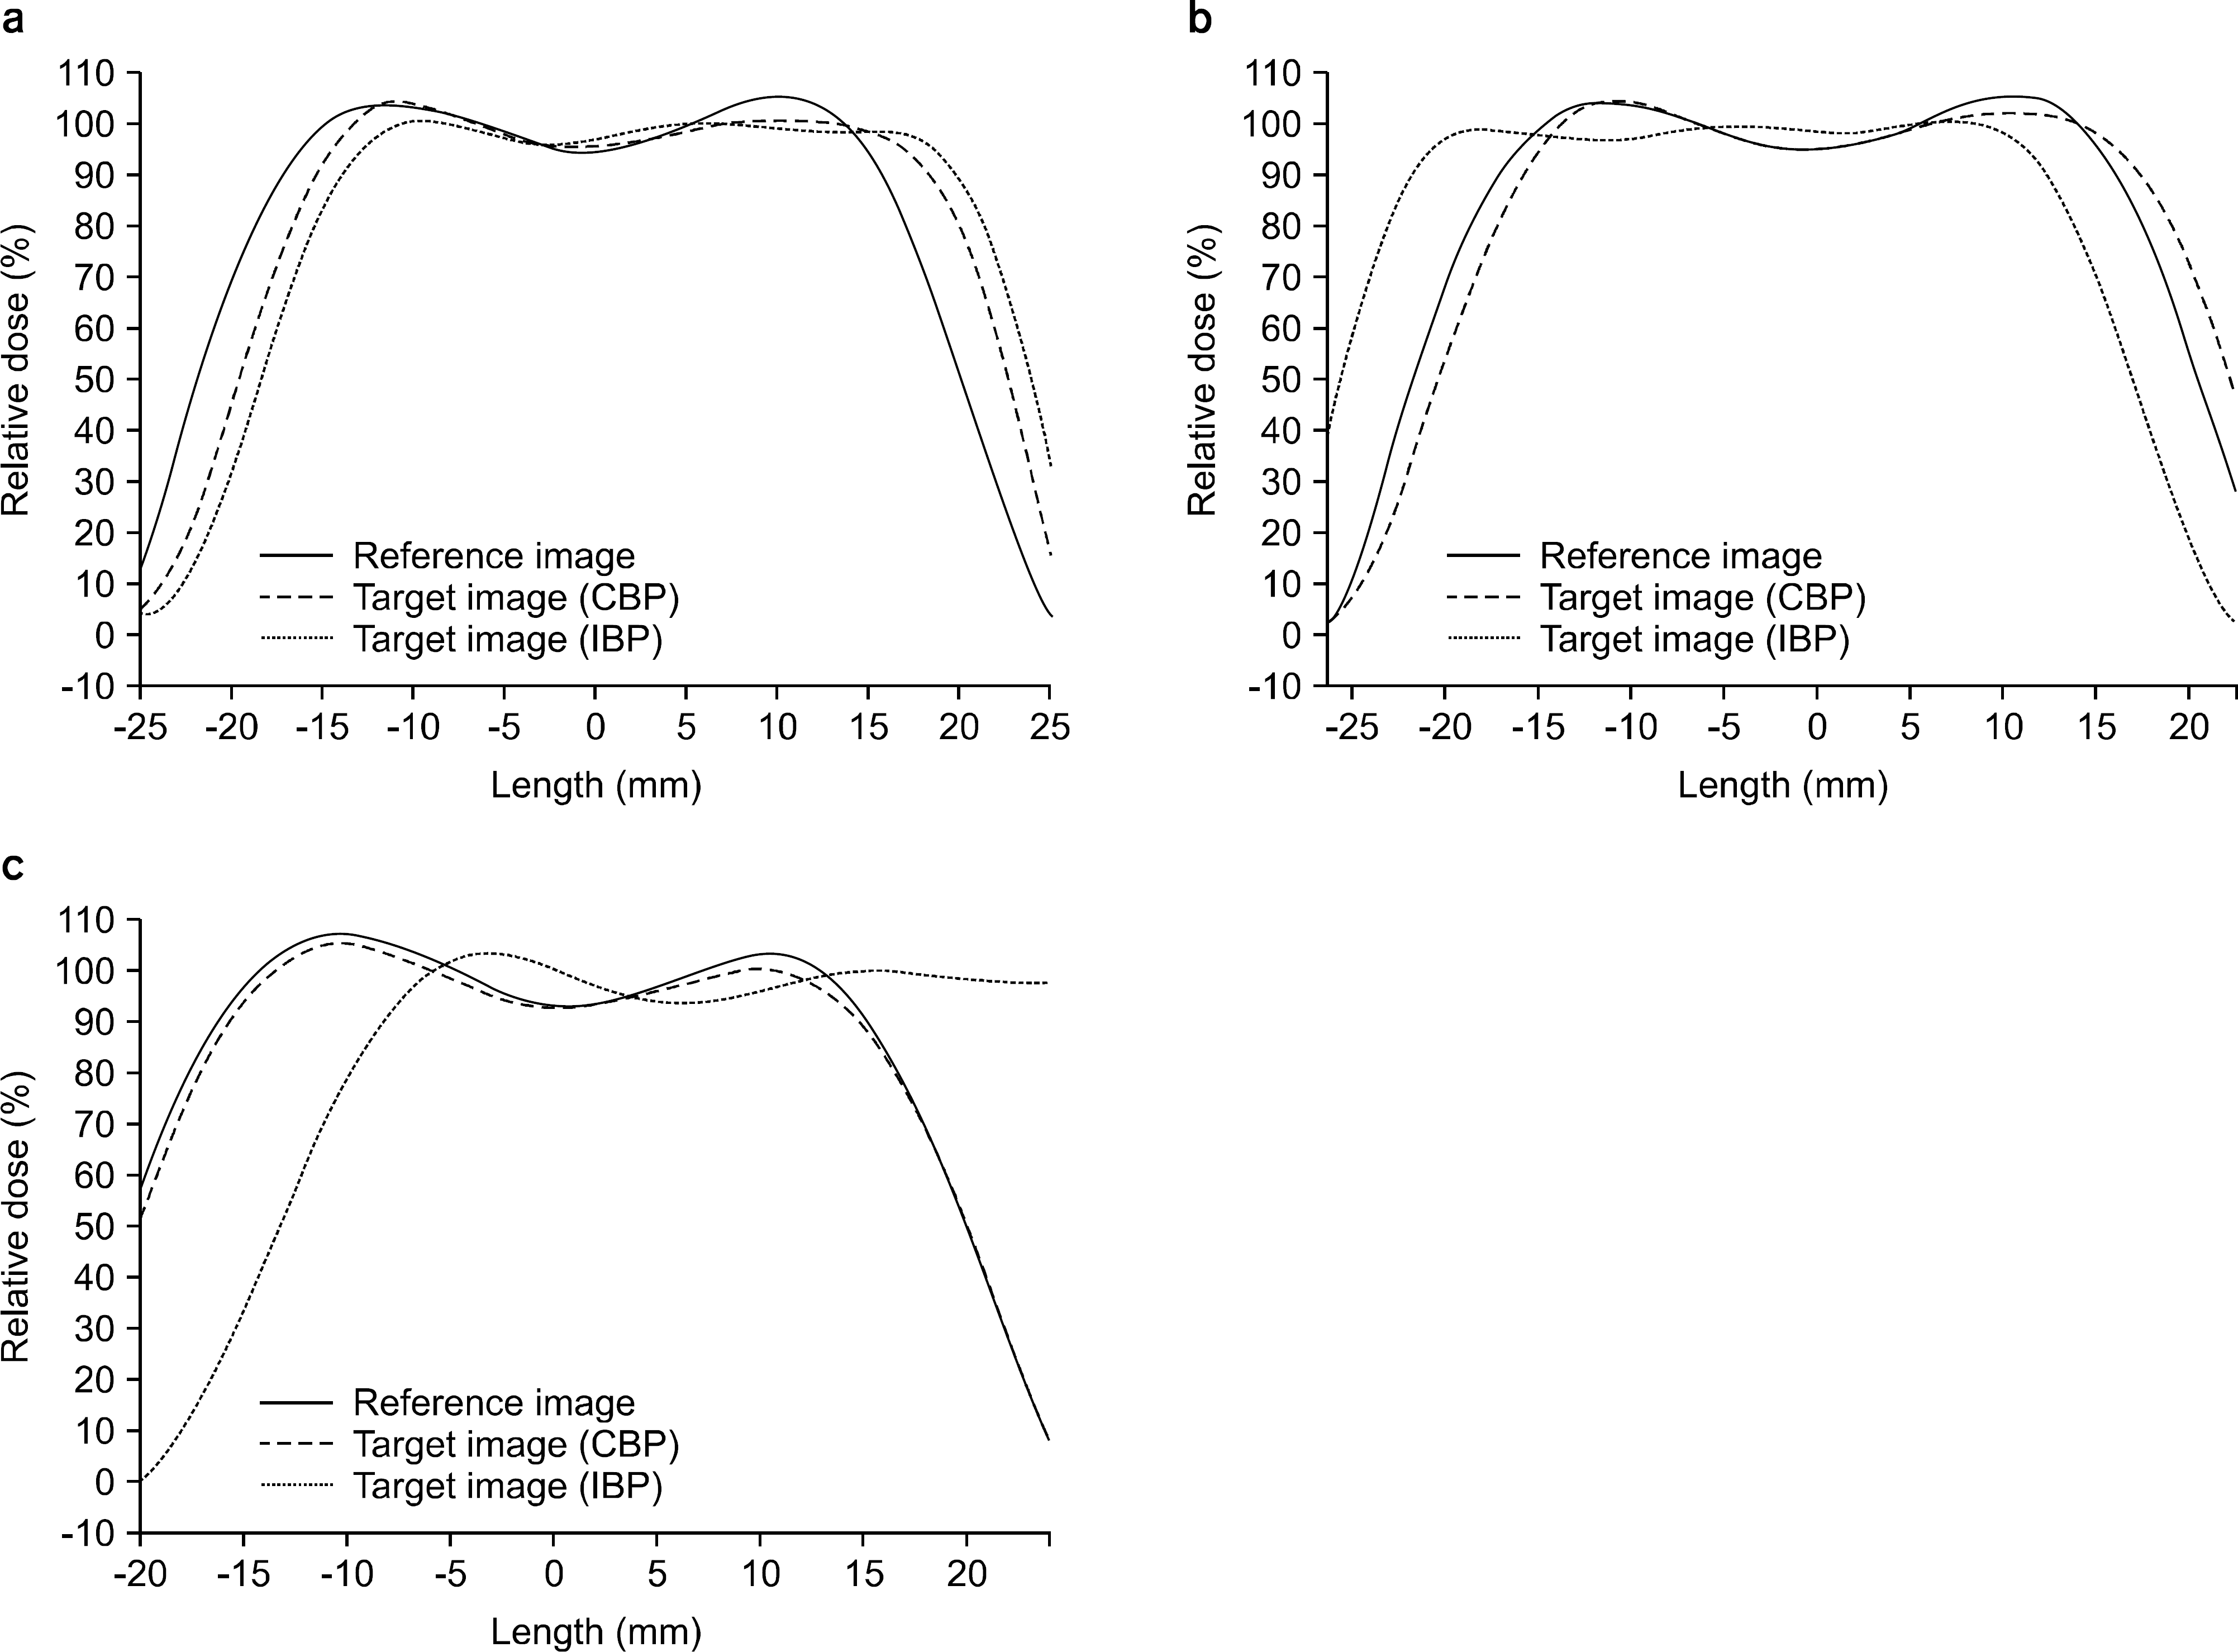
Fig. 5.
Vertical dose profiles for the gated VMAT (solid) vs static (dash dot dot) dose delivery based on the patients' respiratory trace data sets. The results for Patient 1 (a), 2 (b), and 3 (c) are shown.

Table 1.
Characteristics of the study patients derived from 4D CT.
| Tumor infor | mation∗ | |||||
|---|---|---|---|---|---|---|
| Patient | Gender/Age | Pathology | Location | GTV (cm3) | Max liver motion amplitude (mm) | Breathing period (s) |
| 1 | M†/59 | HCC‡ | S6§ | 5.85 | 7.2 | 3.4 |
| 2 | M/60 | HCC | PVTT∥ | 68.41 | 14.1 | 5.1 |
| 3 | M/39 | HCC | S5 – S8 | 2,764.86 | 9.2 | 5 |
Table 2.
Summary of the gated VMAT treatment plans investigated in this study.
Table 3.
Characteristics of respiration determined over the treatment duration for individual patients.
| Patient | Total delivery time | Total Breath-holding time | Number of breath-holding | Mean breath-holding tpb‡ (s) | Breath-holding amplitude position (mm) | ||
|---|---|---|---|---|---|---|---|
| Mean | Std | ||||||
| 1 | (CBP∗) (IBP†) | 30 min 05 s 30 min 02 s | 12 min 22 s 11 min 57 s | 79 83 | 9.4 8.3 | −3.82 −1.67 | 0.30 0.85 |
| 2 | (CBP) | 24 min 44 s | 8 min 48 s | 56 | 9.4 | −3.75 | 0.43 |
| (IBP) | 21 min 28 s | 8 min 23 s | 47 | 10.7 | −1.91 | 0.68 | |
| 3 | (CBP) | 10 min 48 s | 3 min 13 s | 39 | 4.9 | −4.21 | 0.23 |
| (IBP) | 9 min 14 s | 3 min 10 s | 26 | 7.3 | 1.50 | 0.17 | |
Table 4.
Percentage difference in dose from the ion chamber measurements.
| Patient | Compared to static (%) | Compared to TPS (%) | Difference between static delivery and TPS (%) |
|---|---|---|---|
| 1 (CBP∗) | 2.12±0.21 | 3.65±0.21 | 1.6 |
| (IBP†) | 6.51±0.73 | 7.94±0.71 | |
| 2 (CBP) | 2.48±0.12 | 3.98±0.12 | 2.3 |
| (IBP) | 8.23±0.41 | 9.86±0.40 | |
| 3 (CBP) | 1.52±0.96 | 2.88±0.94 | 1.4 |
| (IBP) | 55.54±0.66 | 56.23±0.65 |


 PDF
PDF ePub
ePub Citation
 Print
Print


 XML Download