Abstract
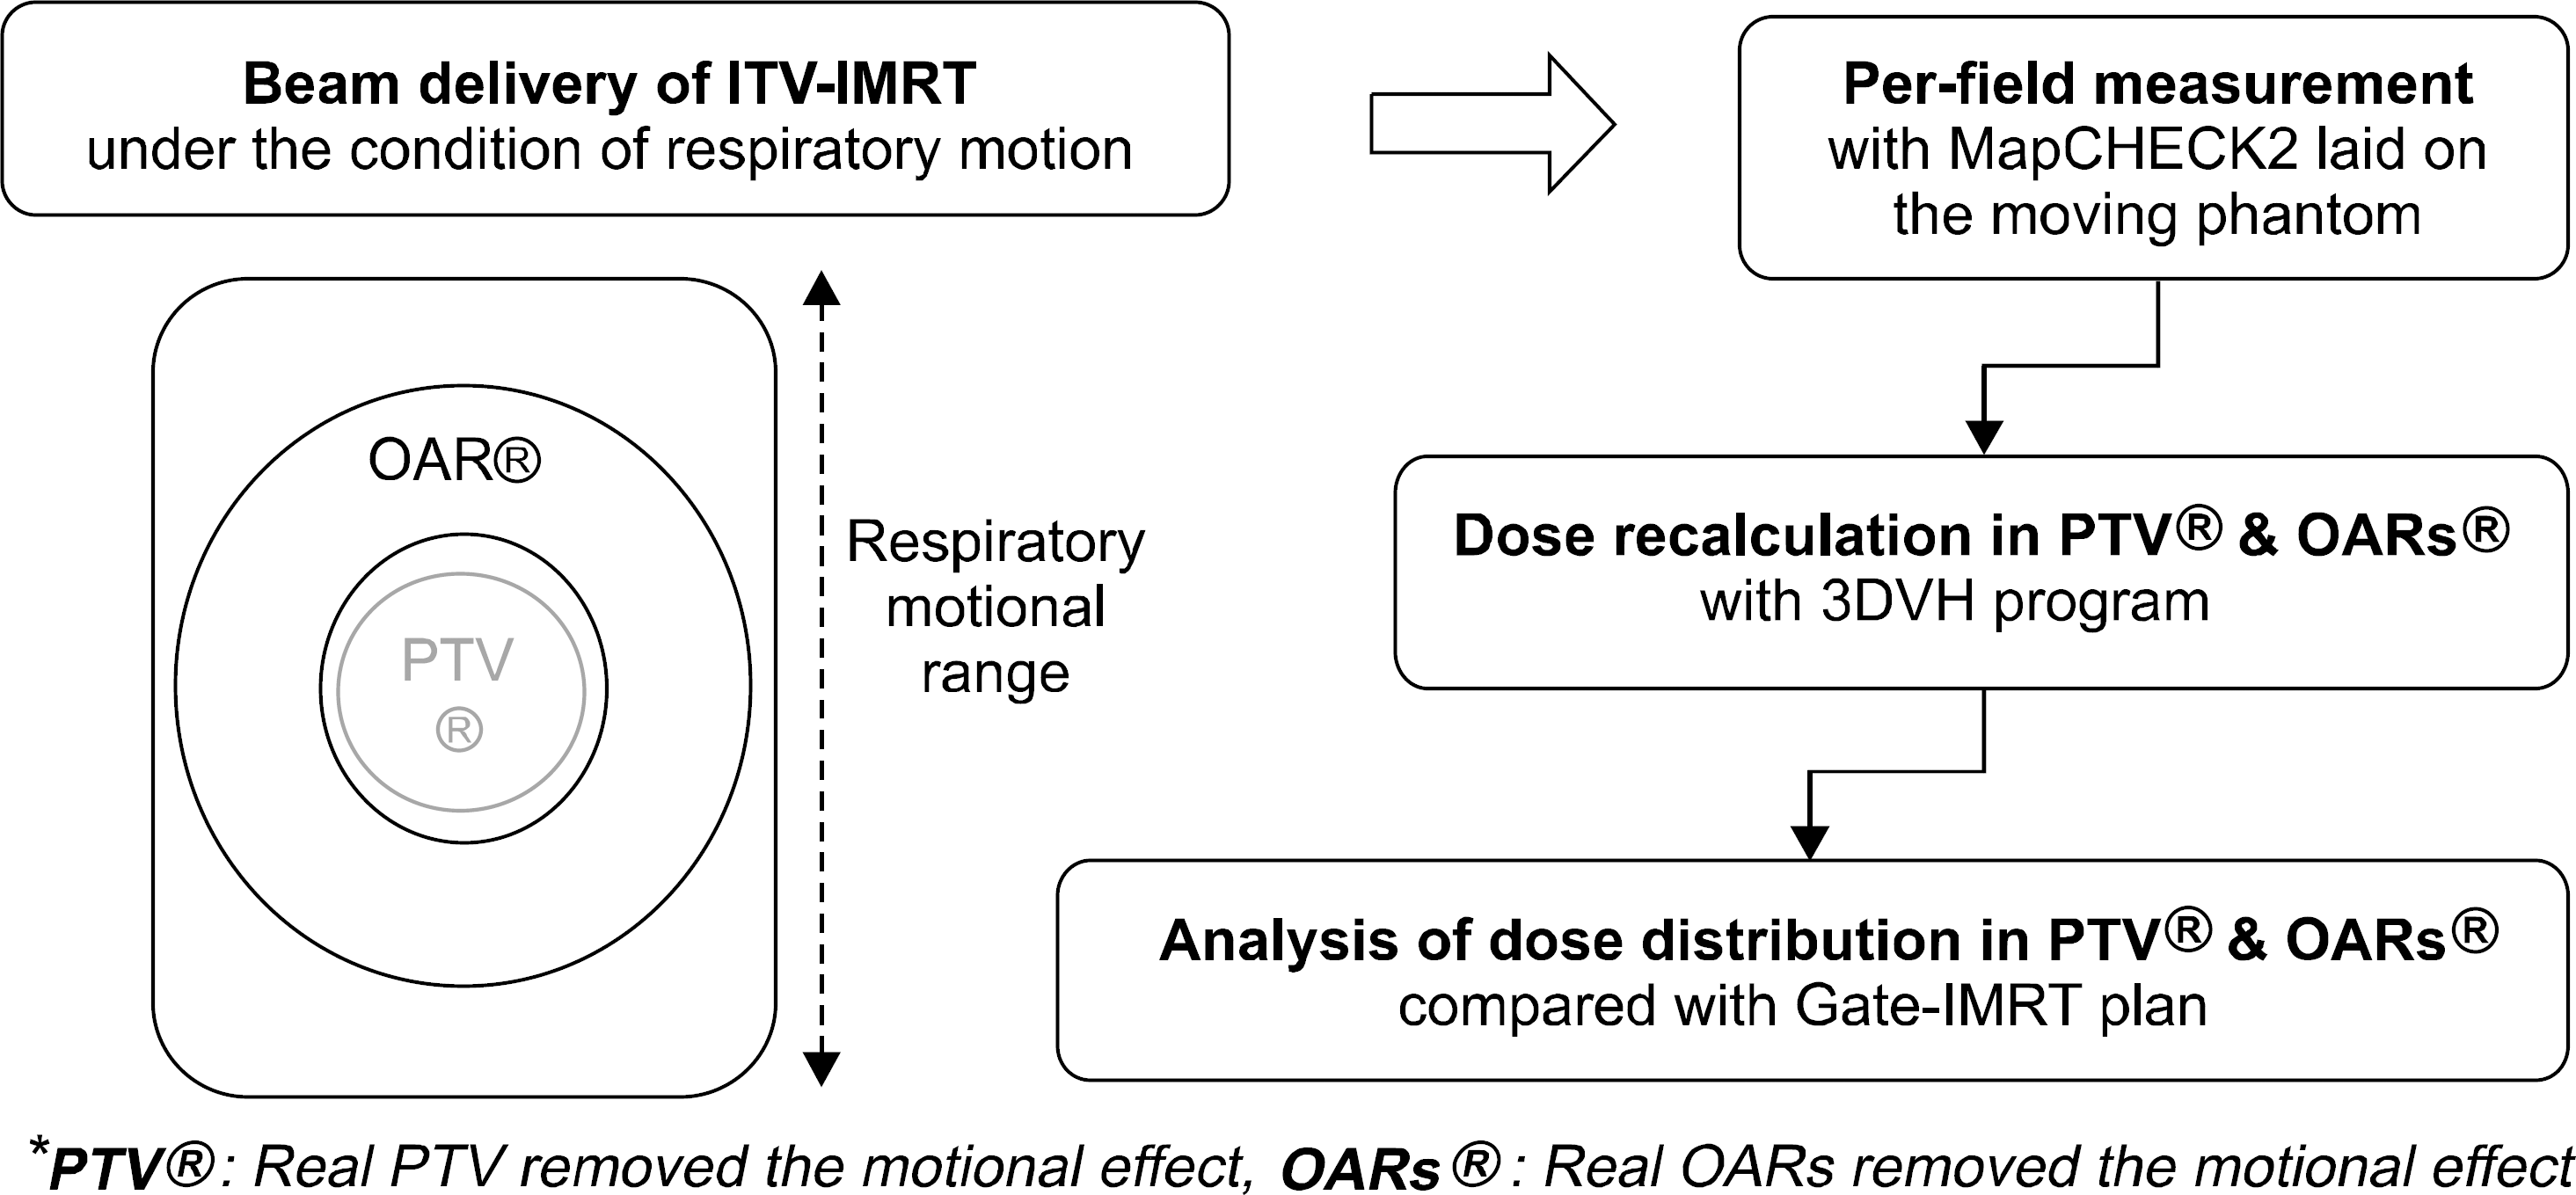
The dose distributions within the real volumes of tumor targets and critical organs during internal target volume-based intensity-modulated radiation therapy (ITV-IMRT) for liver cancer were recalculated by applying the effects of actual respiratory organ motion, and the dosimetric features were analyzed through comparison with gating IMRT (Gate-IMRT) plan results. The ITV was created using MIM software, and a moving phantom was used to simulate respiratory motion. The doses were recalculated with a 3 dose-volume histogram (3DVH) program based on the per-field data measured with a MapCHECK2 2-dimensional diode detector array. Although a sufficient prescription dose covered the PTV during ITV-IMRT delivery, the dose homogeneity in the PTV was inferior to that with the Gate-IMRT plan. We confirmed that there were higher doses to the organs-at-risk (OARs) with ITV-IMRT, as expected when using an enlarged field, but the increased dose to the spinal cord was not significant and the increased doses to the liver and kidney could be considered as minor when the reinforced constraints were applied during IMRT plan optimization. Because the Gate-IMRT method also has disadvantages such as unsuspected dosimetric variations when applying the gating system and an increased treatment time, it is better to perform a prior analysis of the patient's respiratory condition and the importance and fulfillment of the IMRT plan dose constraints in order to select an optimal IMRT method with which to correct the respiratory organ motional effect.
References
1. Duan J, Shen S, Fiveash JB, et al. Dosimetric e ffect of respiration-gated beam on IMRT delivery. Med Phys. 30(8):2241–2252. 2003.
2. Ahmed RS, Shen S, Ove R, et al. Intensity modulated with respiratory ga ting for radiothera py of the ple ural space. Med Dosim. 32(1):16–22. 2007.
3. van der Geld YG, van Triest B, Verbakel WF, et al. Evaluation of four-dimensional comp ute d tomography-based intensitymodulated and re spira tory-gate d radiothe rap y t e ch n i – ques for pa nc re atic ca rc inoma. Int J Radiat Onc ol Biol Phys. 72(4):1215–1220. 2008.
4. Seco J, Sharp GC, Wu Z, et al. Dosimetric impact of motion in fre e-bre athing and gated lung ra diotherapy: a 4D M onte Carlo study of intrafraction and interfraction effects. Med Phys. 35(1):356–366. 2008.
5. Chen H, Wu A, Brandner ED, et al. Dosimetric evaluations of the interplay effe ct in respiratory-ga ted intensitymodulated radiation the rapy. Med P hys. 36(3):893–903. 2009.
6. Kang H, Yorke ED, Yang J, et al. Evaluation of tumor motion e ffects on dose distribution for hypofractionate d intensitymodulated ra diotherapy of non-small-cell lung cancer. J A ppl Clin Med Phys. 11(3):78–89. 2010.
7. Cheong KH, Kang SK, Lee M, et al. Evaluation of delivered monitor unit a cc u rac y of gated step-and-shoot IM RT using a two-dimensional detector array. Med Phys. 37(3):1146–1151. 2010.
8. Yoganathan SA, Maria Das KJ, Agarwal A, et al. Performance evaluation of resp iratory motion-sync hronized dynamic I MR T de livery. J Ap pl Clin Me d P hys. 14(3):39–51. 2013.
9. Hugo GD, Agazaryan N, Solberg TD. An eva luation of gating window size, delivery method, and composite field dosimetry of respiratory-ga ted IMRT. Med Phys. 29(11):2517–2525. 2002.
10. Xi M, Liu MZ, Deng XW, et al. Defining internal target volume (ITV) for hepatoce llular ca rc inoma using four-dimensional CT. Radiother Oncol. 84(3):272–278. 2007.
11. Xi M, Liu MZ, Zhang L, et al. How many sets of 4DCT images a re sufficie nt to de termine internal targe t volume for liver radiotherapy? Radiothe r Onc ol. 92(2):255–259. 2009.
12. Reitz B, Parda DS, Colonias A, et al. Investigation of simple IMRT delivery techniques for non-small cell lung cancer patients with re spira tory motion using 4DCT. Med Dosim. 34(2):158–169. 2009.
13. Speight R, Sykes J, Lindsay R, et al. The eva luation of a deformable image registration segmentation technique for semi-automating internal target volume (I TV) production from 4DCT images of lung ste reota ctic b ody radiothe rap y (S BRT) patients. Radiothe r Onc ol. 98(2):277–283. 2011.
14. Wu Q, Mohan R, Morris M, et al. Simultaneous integrate d boost inte nsity modula ted radiothe rap y for locally advanc ed head-and-neck squamous cell carcinomas. I: dosimetric results. Int J Radiat Onc ol Biol Phys. 56(2):573–585. 2003.
15. Olch AJ. Evaluation of the ac c urac y of 3DV H software estimates of dose to virtual ion c ha mbe r and film in composite IMRT QA. Med Phys. 39(1):81–86. 2012.
16. Carrasco P, Jornet N, Latorre A, et al. 3D DVH-ba sed metric analysis ve rsus pe r-b ea m planar analysis in I MR T pretreatment verification. Me d Phys. 39(8):5040–5049. 2012.
Fig. 1.
MapCHECK2 laid on the dynamic moving phantom for the per-field measurement of ITV-IMRT under the condition of respiratory motion.
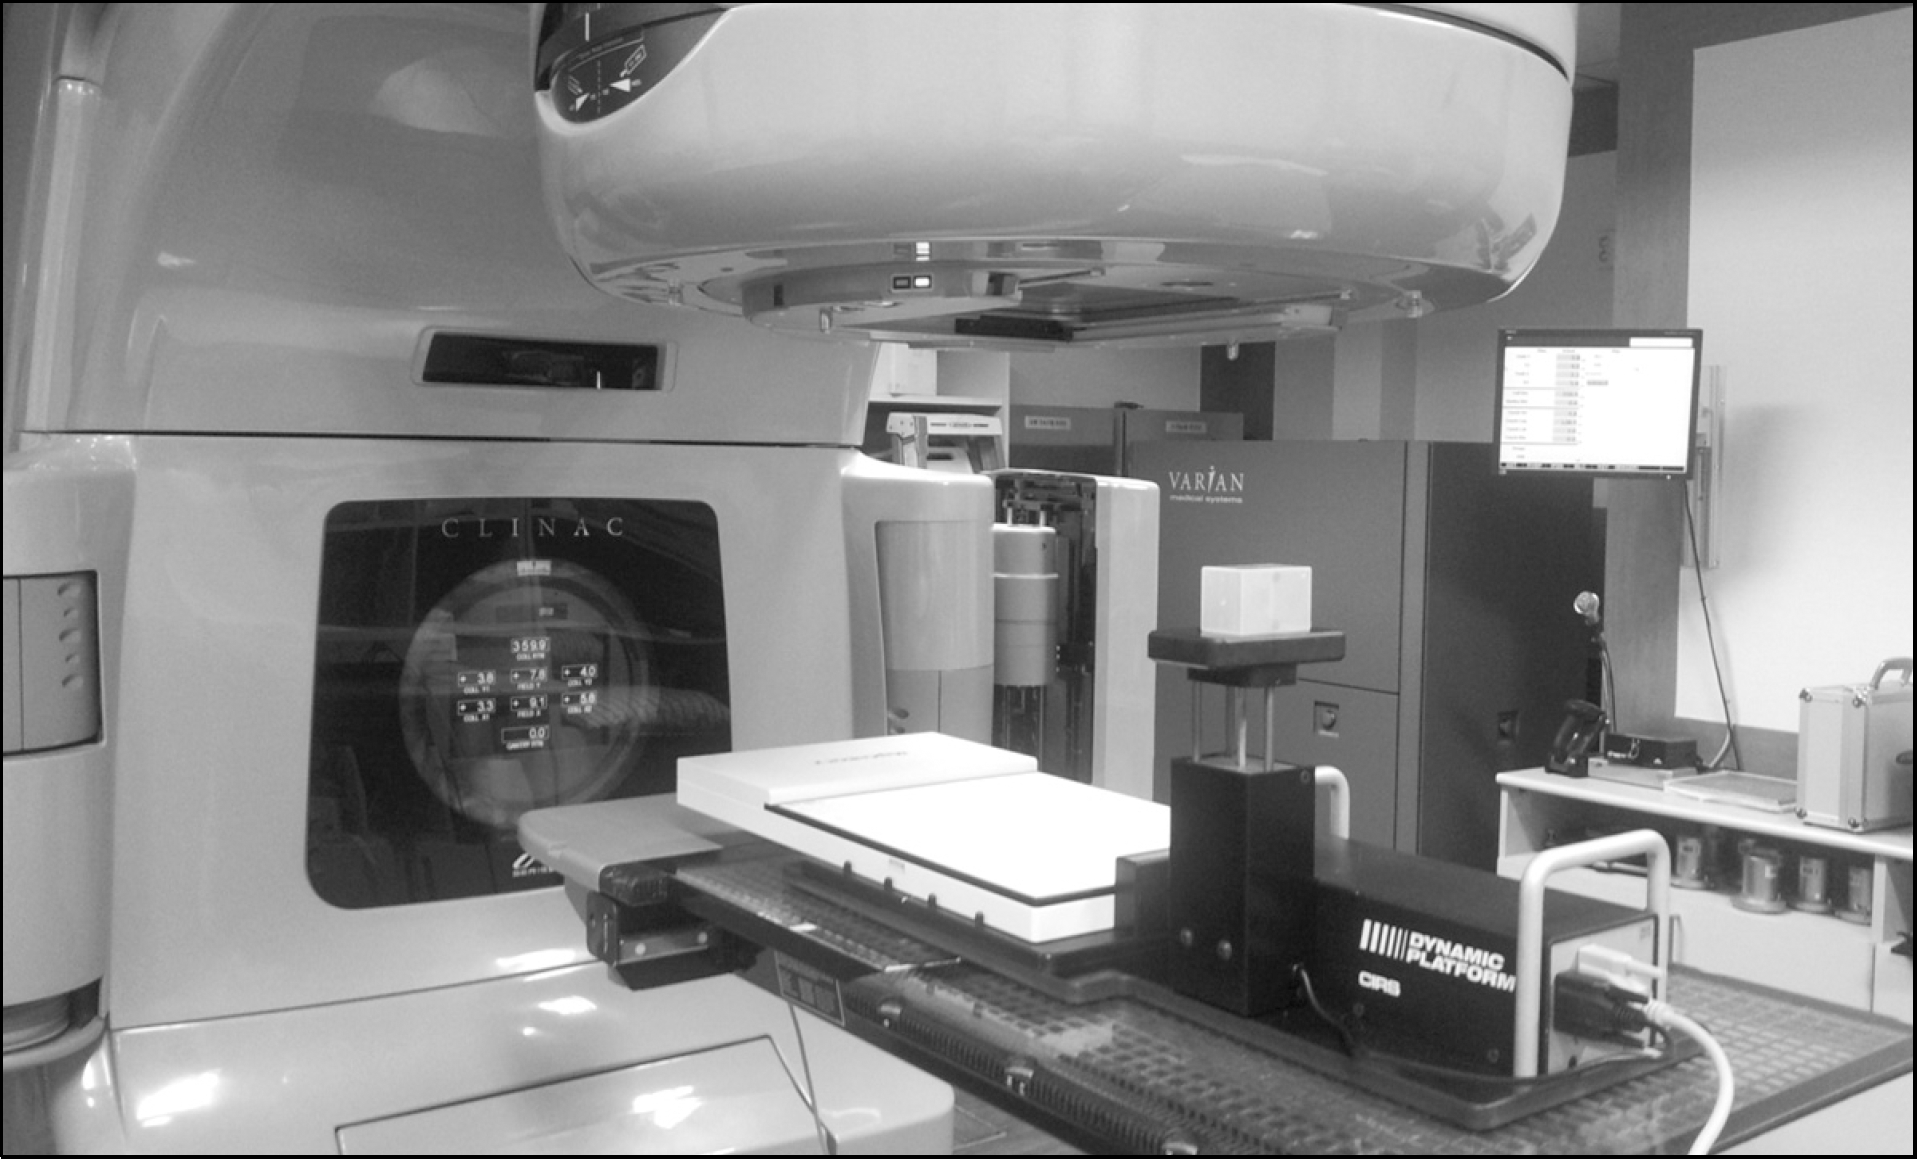
Fig. 3.
Example of PTV and OARs in ITV-IMRT plan delineated in MIM program reflecting the respiratory motional effect.

Fig. 4.
Volume increase rate of PTV and OARs in ITV-IMRT plan compared with the volume in Gate-IMRT plan.
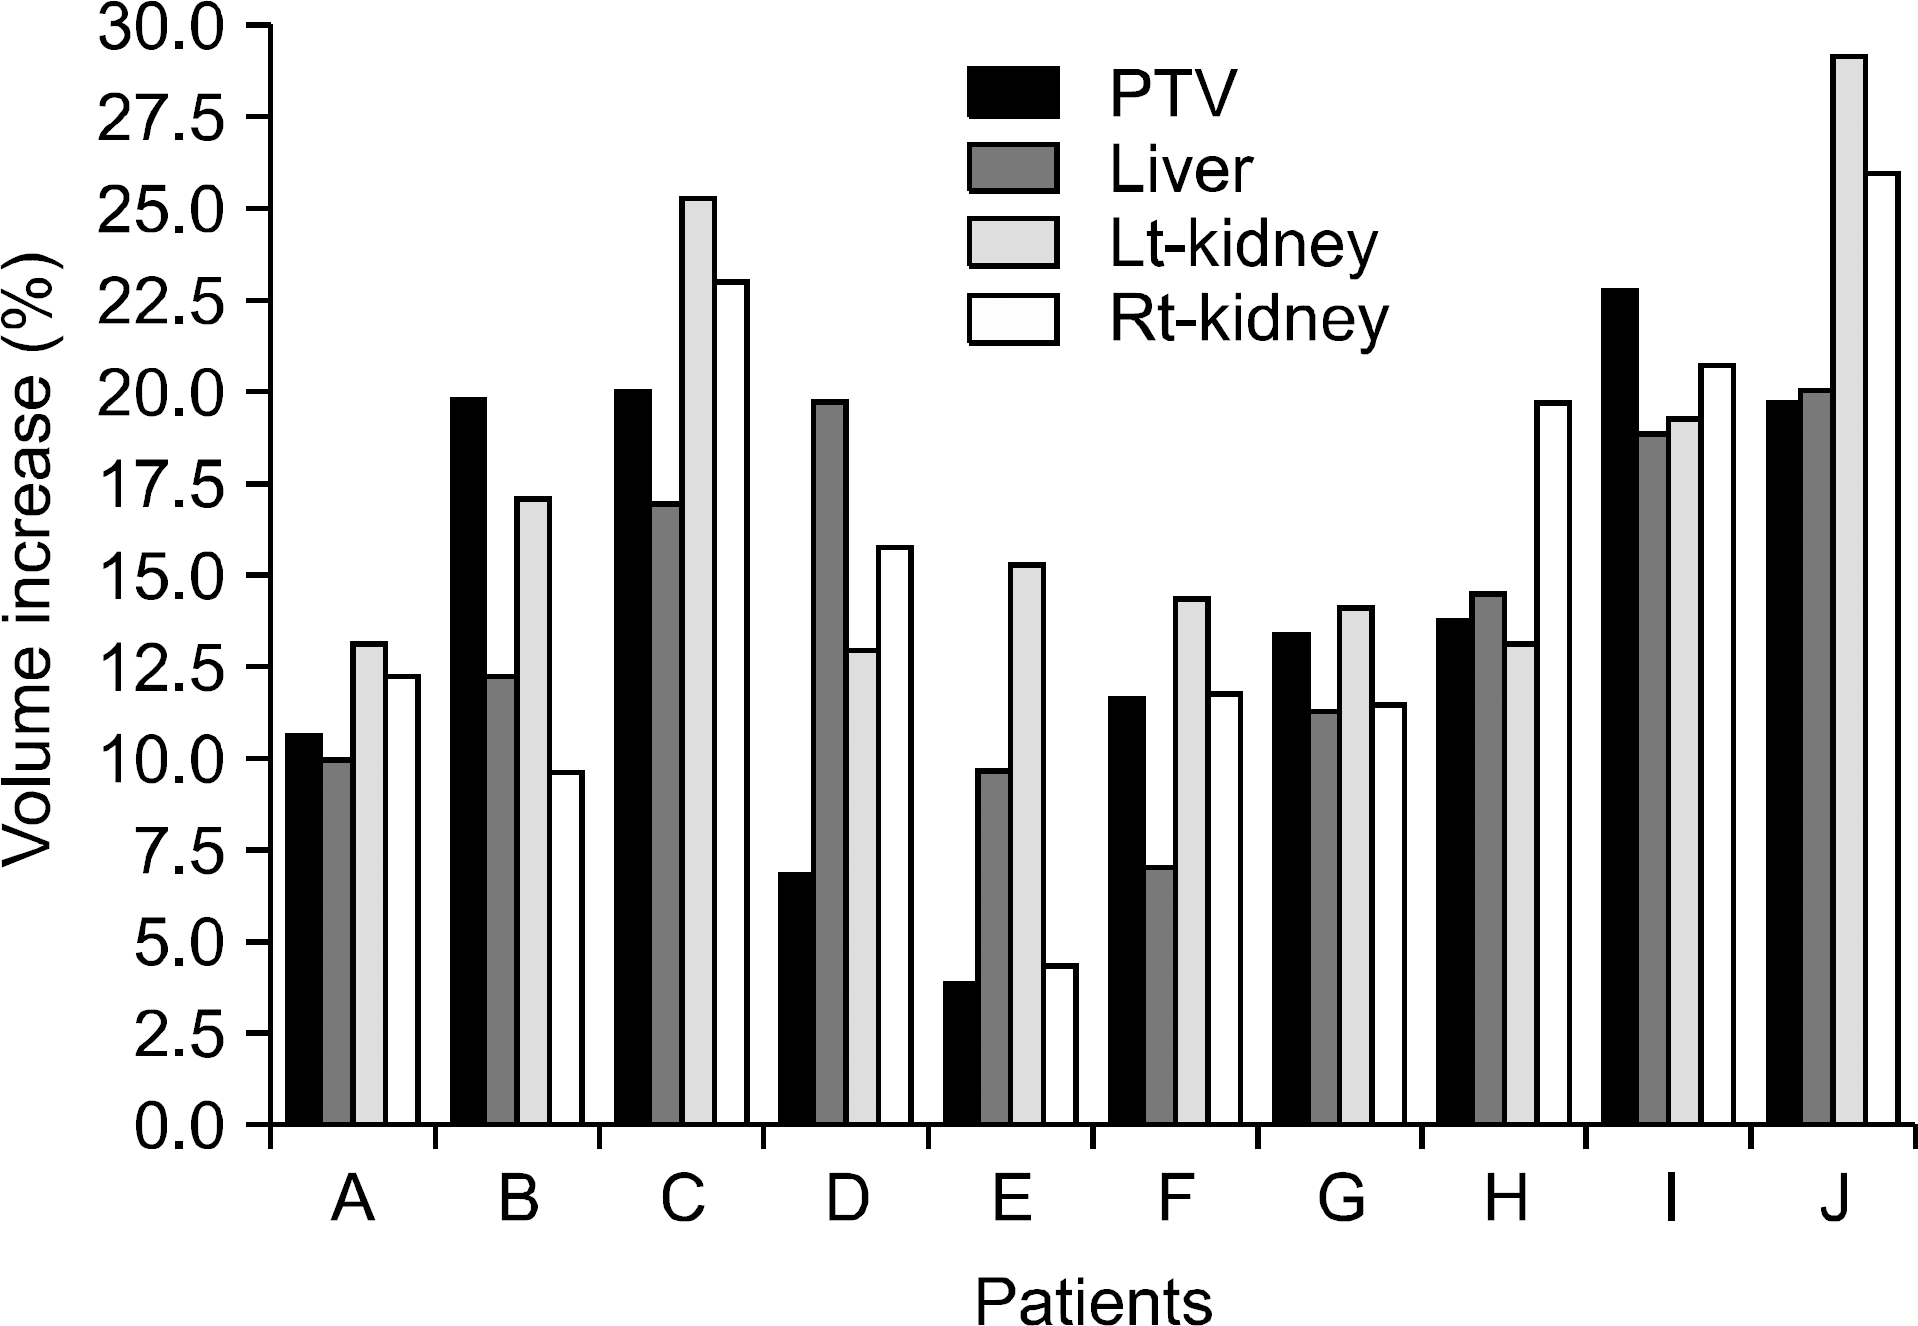
Fig. 5.
Example of the DVH comparison between the recalculated dose in the ITV-IMRT beam delivery and the DVH of Gate-IMRT plan.
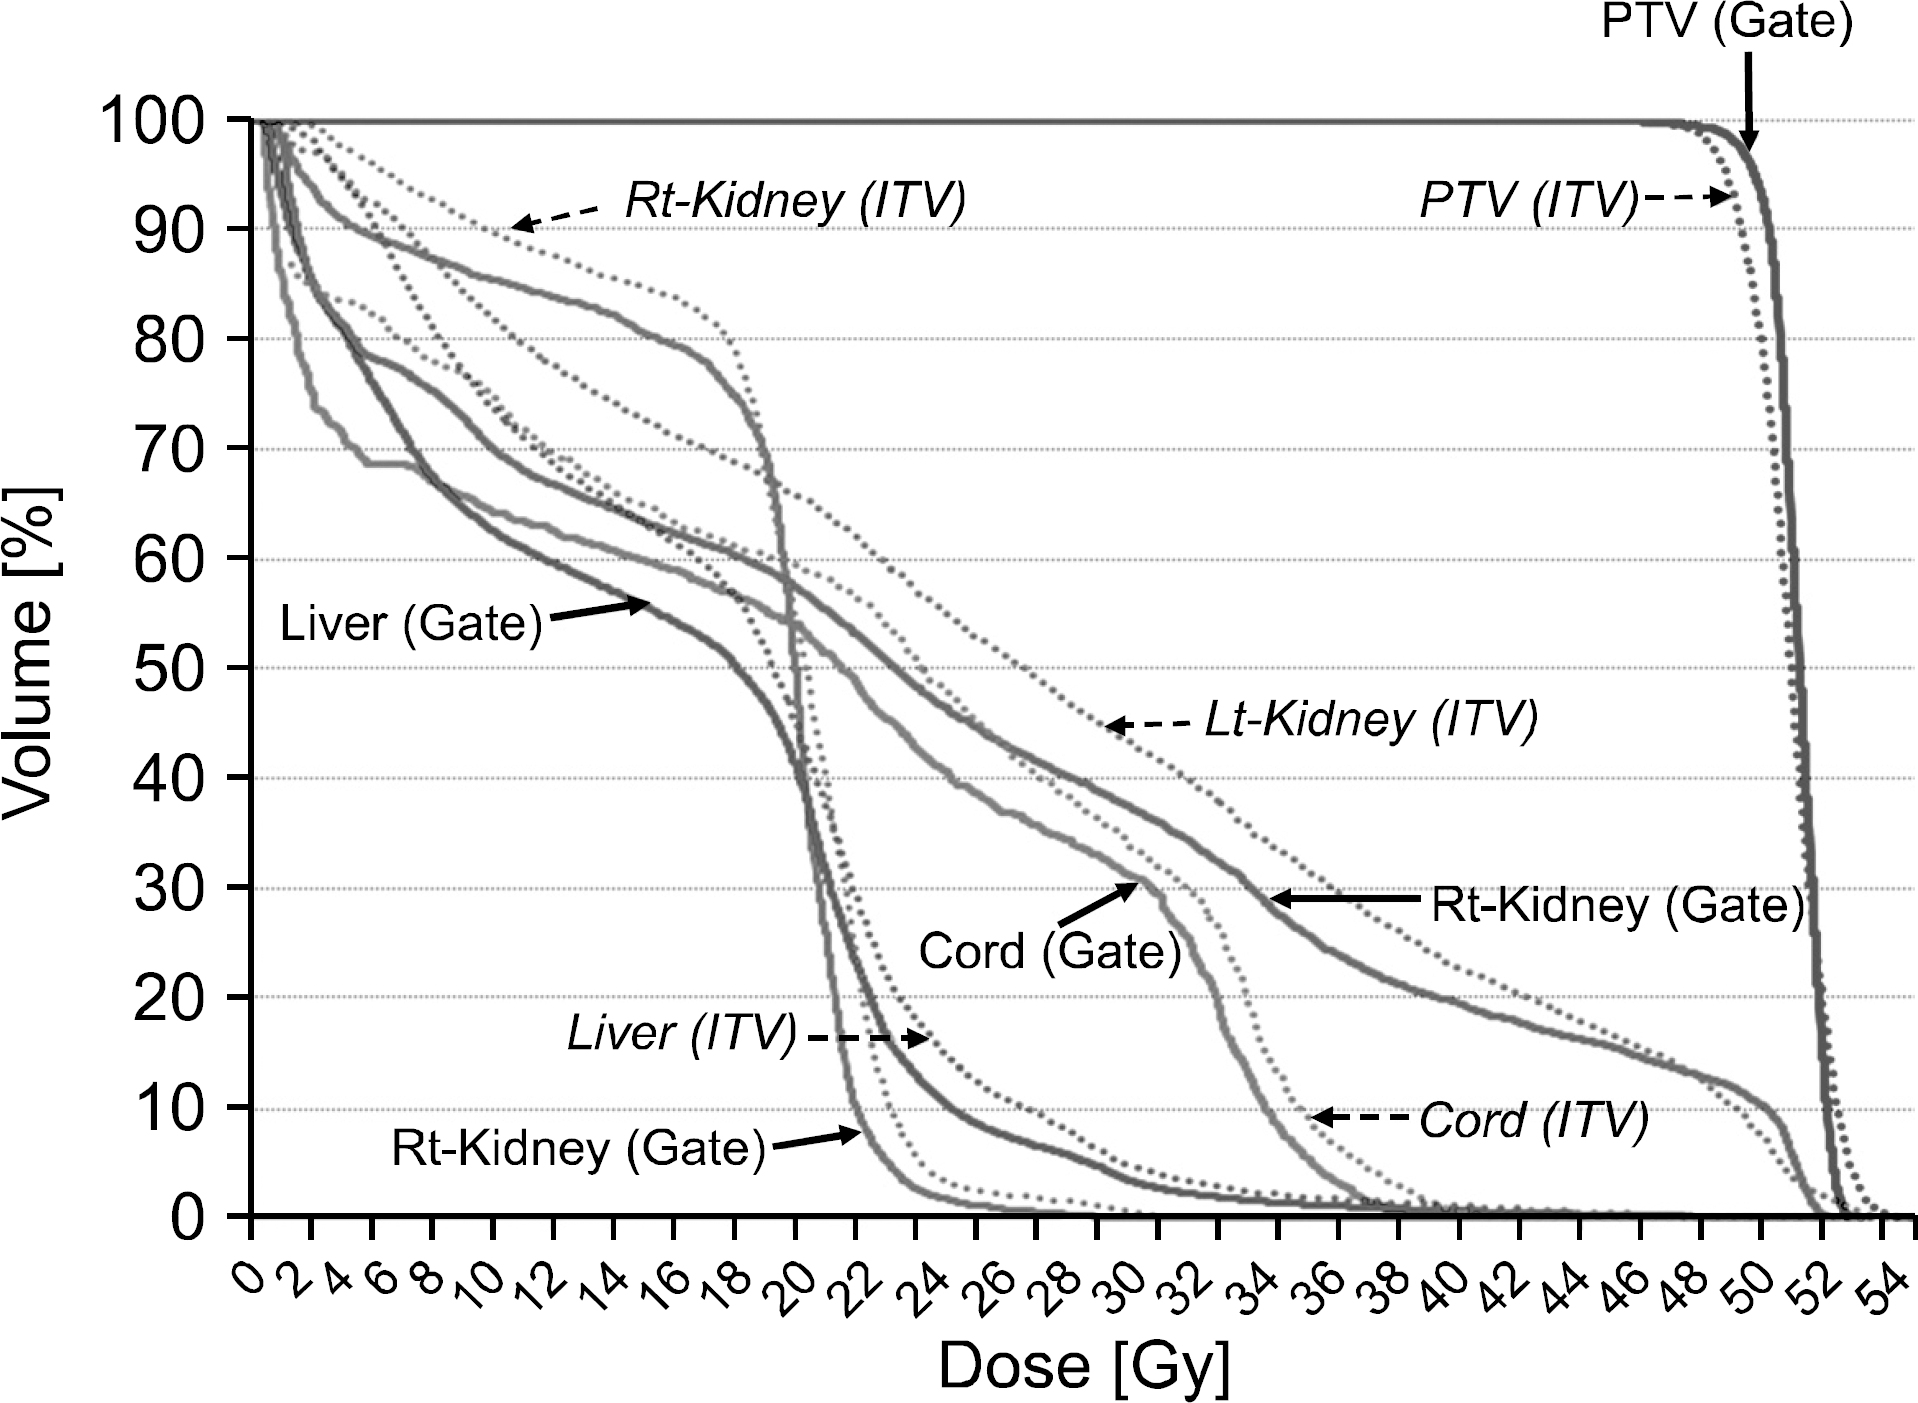
Fig. 6.
Differences of PTV's DVH values between the ITV-IMRT beam delivery and Gate-IMRT plan at the major points.
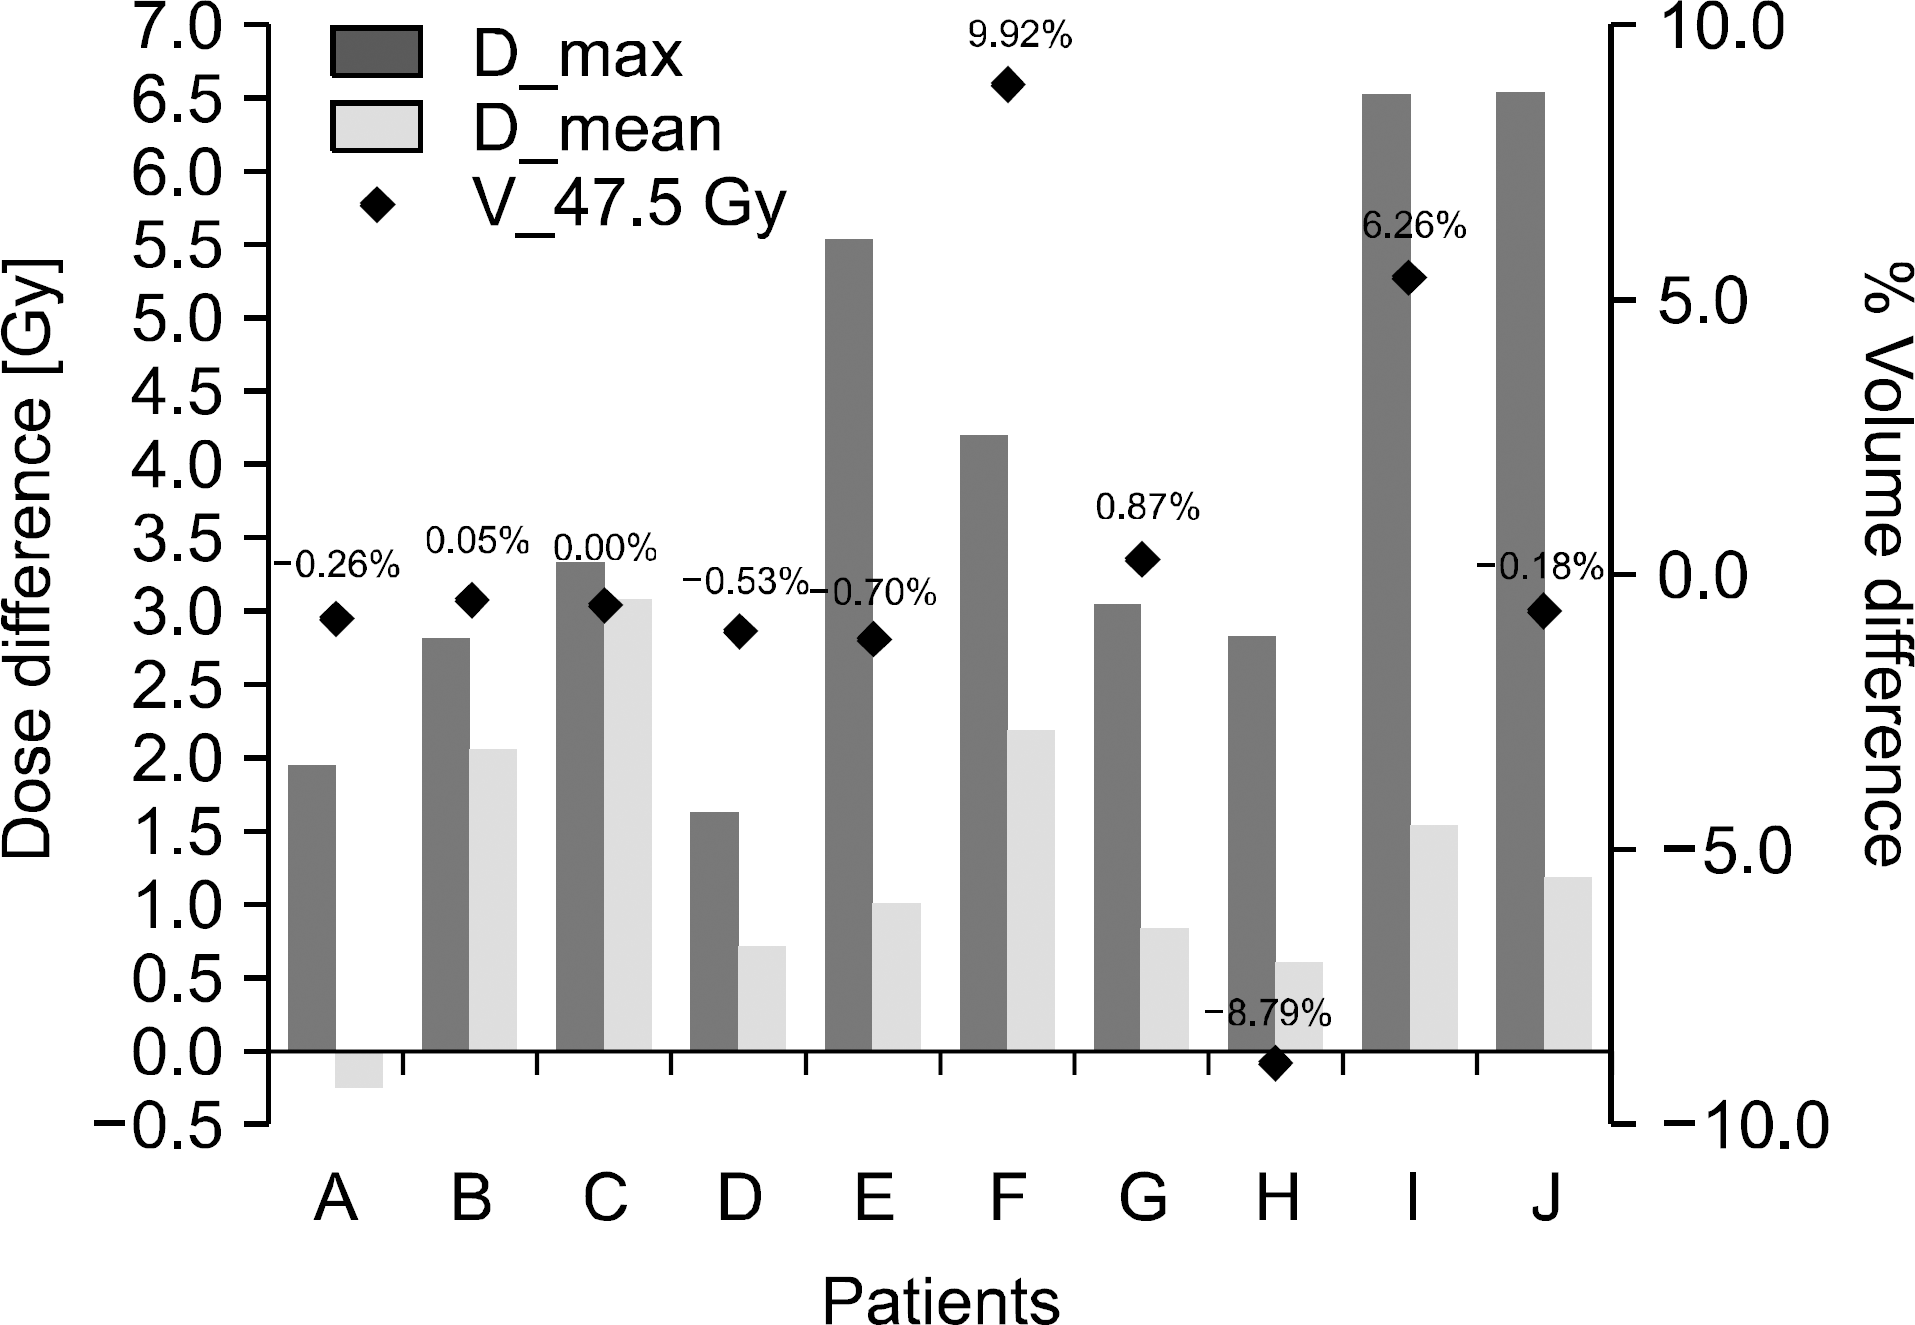
Fig. 7.
Comparison of homogeneity index (HI) between the beam delivery of ITV-IMRT and Gate-IMRT plan.
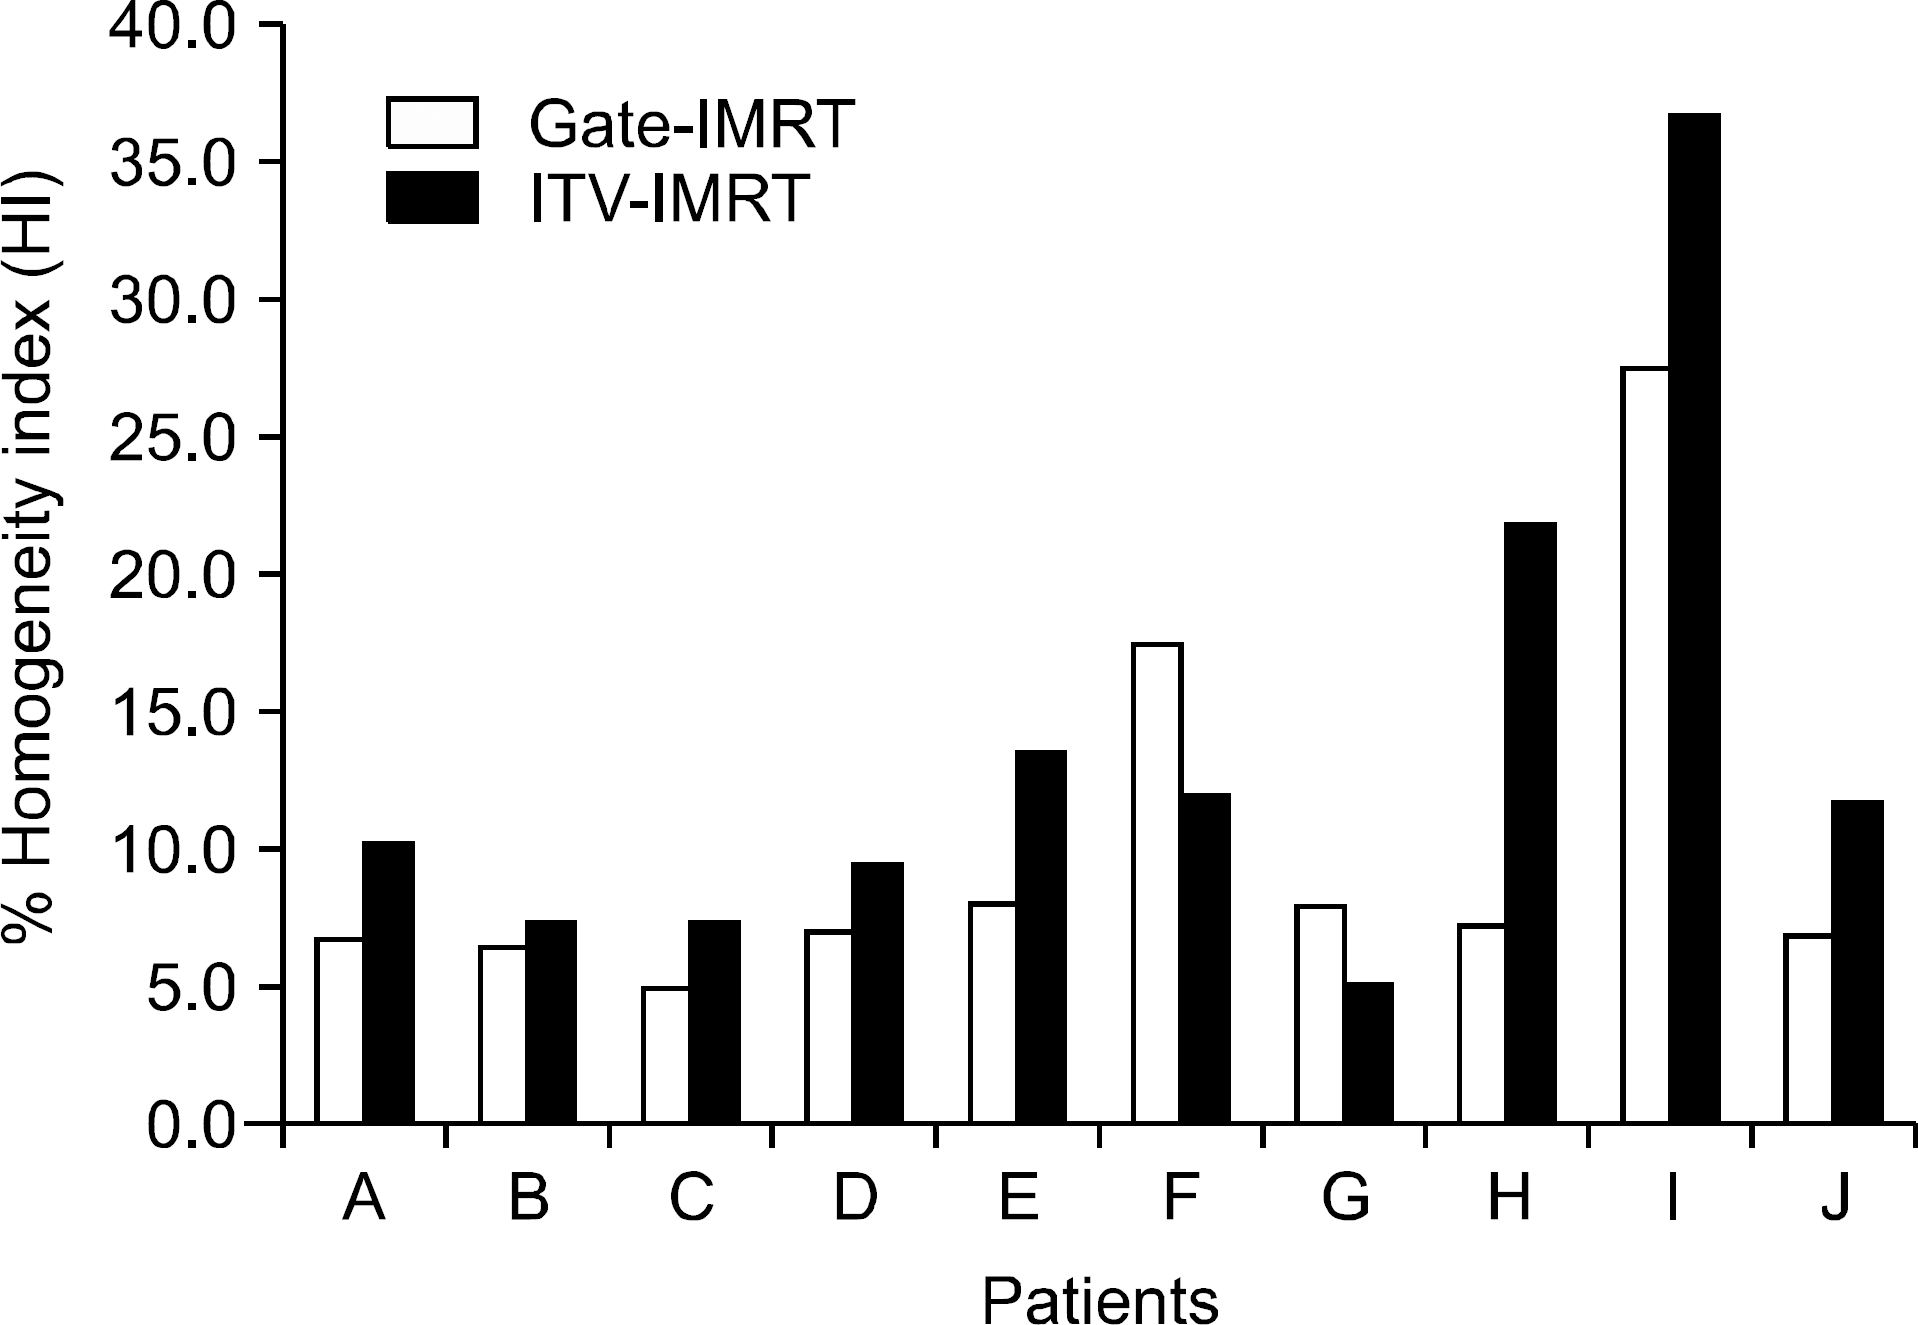
Fig. 8.
Differences of liver's DVH values between the ITV-IMRT beam delivery and Gate-IMRT plan at the major points.
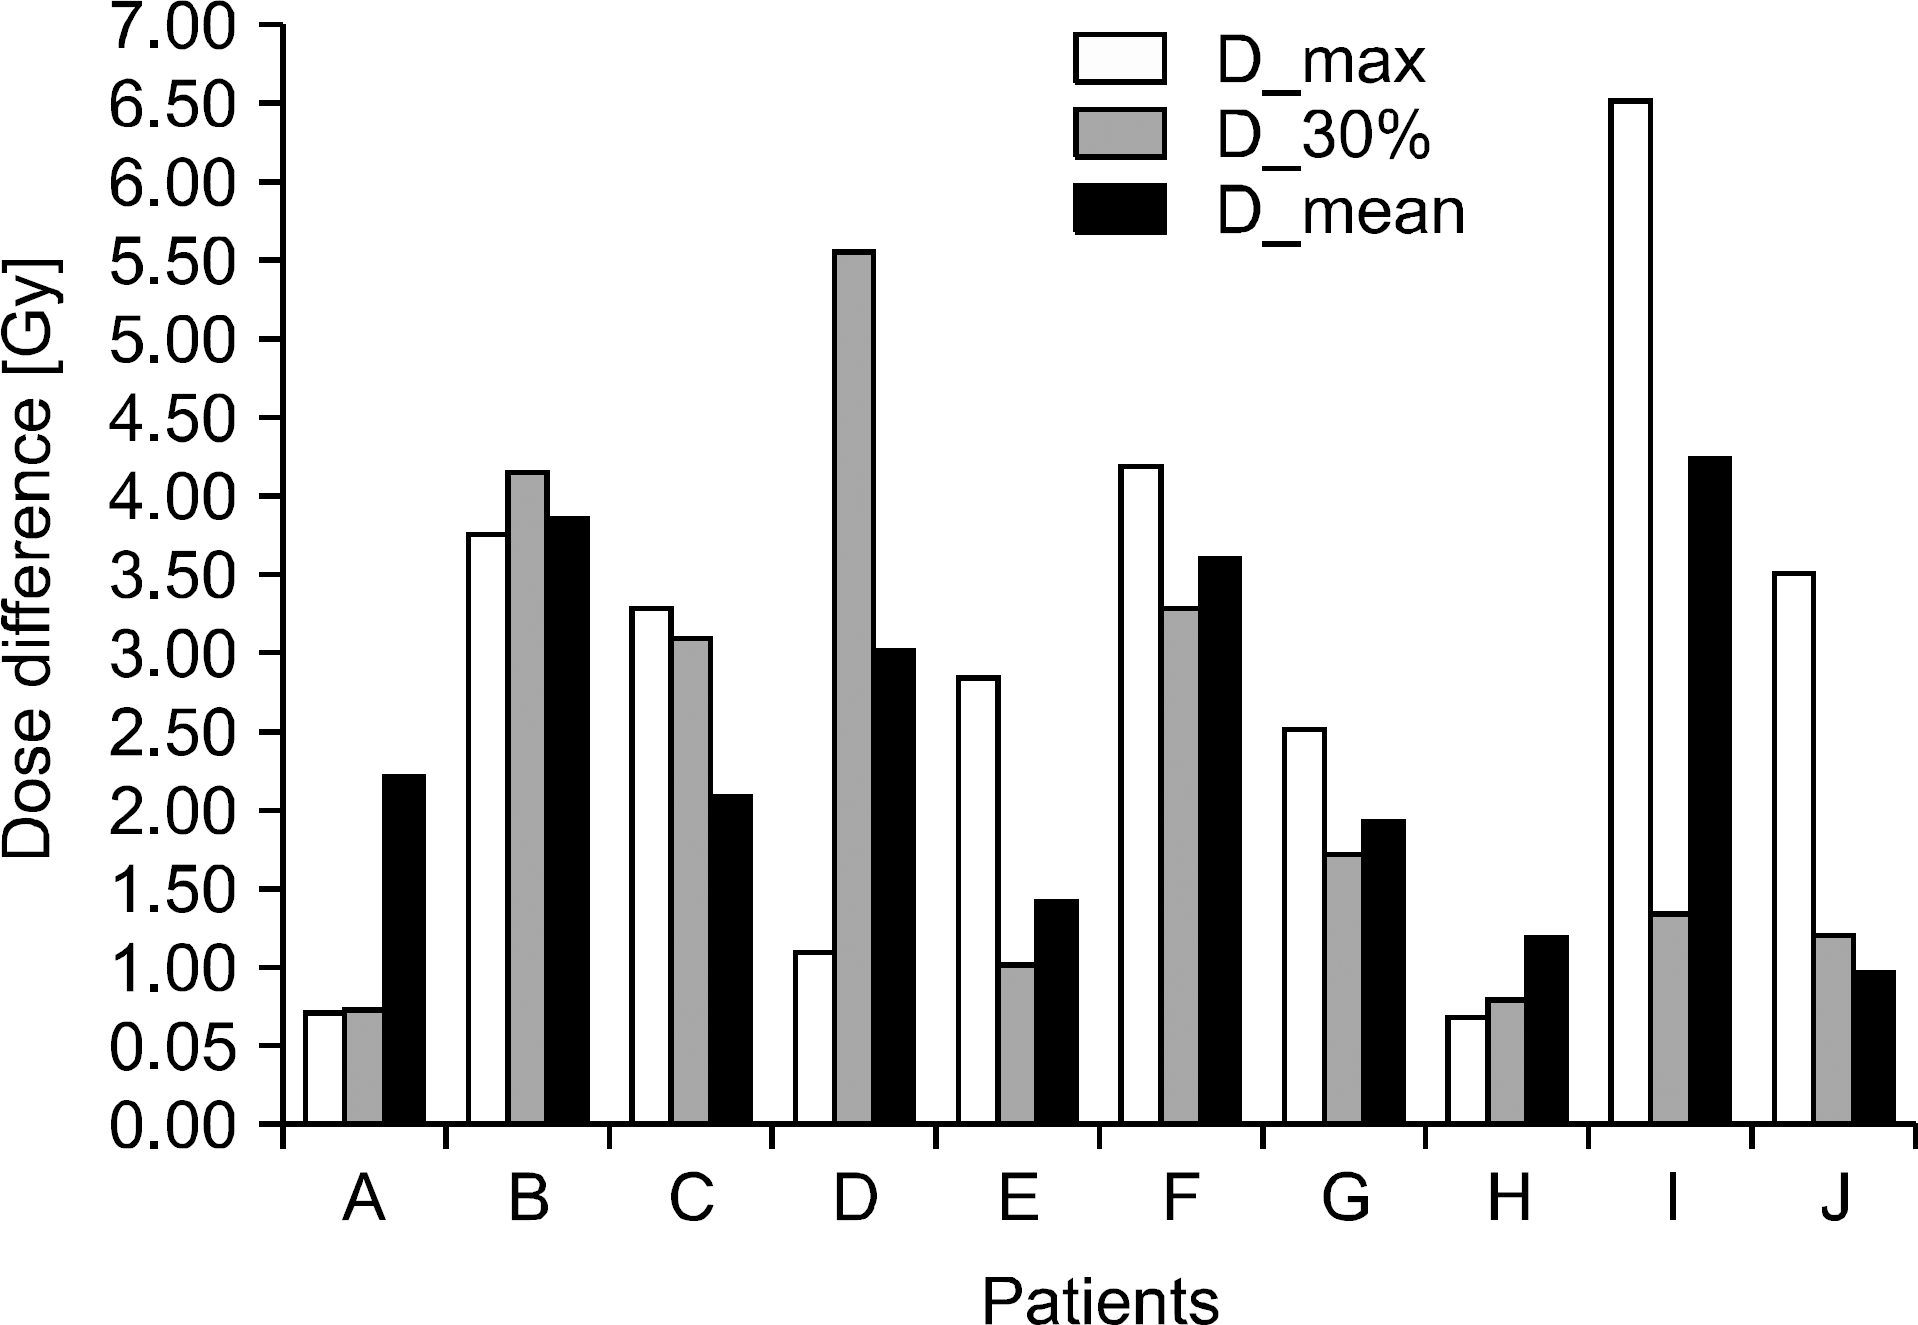
Fig. 9.
Differences of kidney's DVH values between the ITV-IMRT beam delivery and Gate-IMRT plan at the major points. (a) Left kidney. (b) Right kidney.
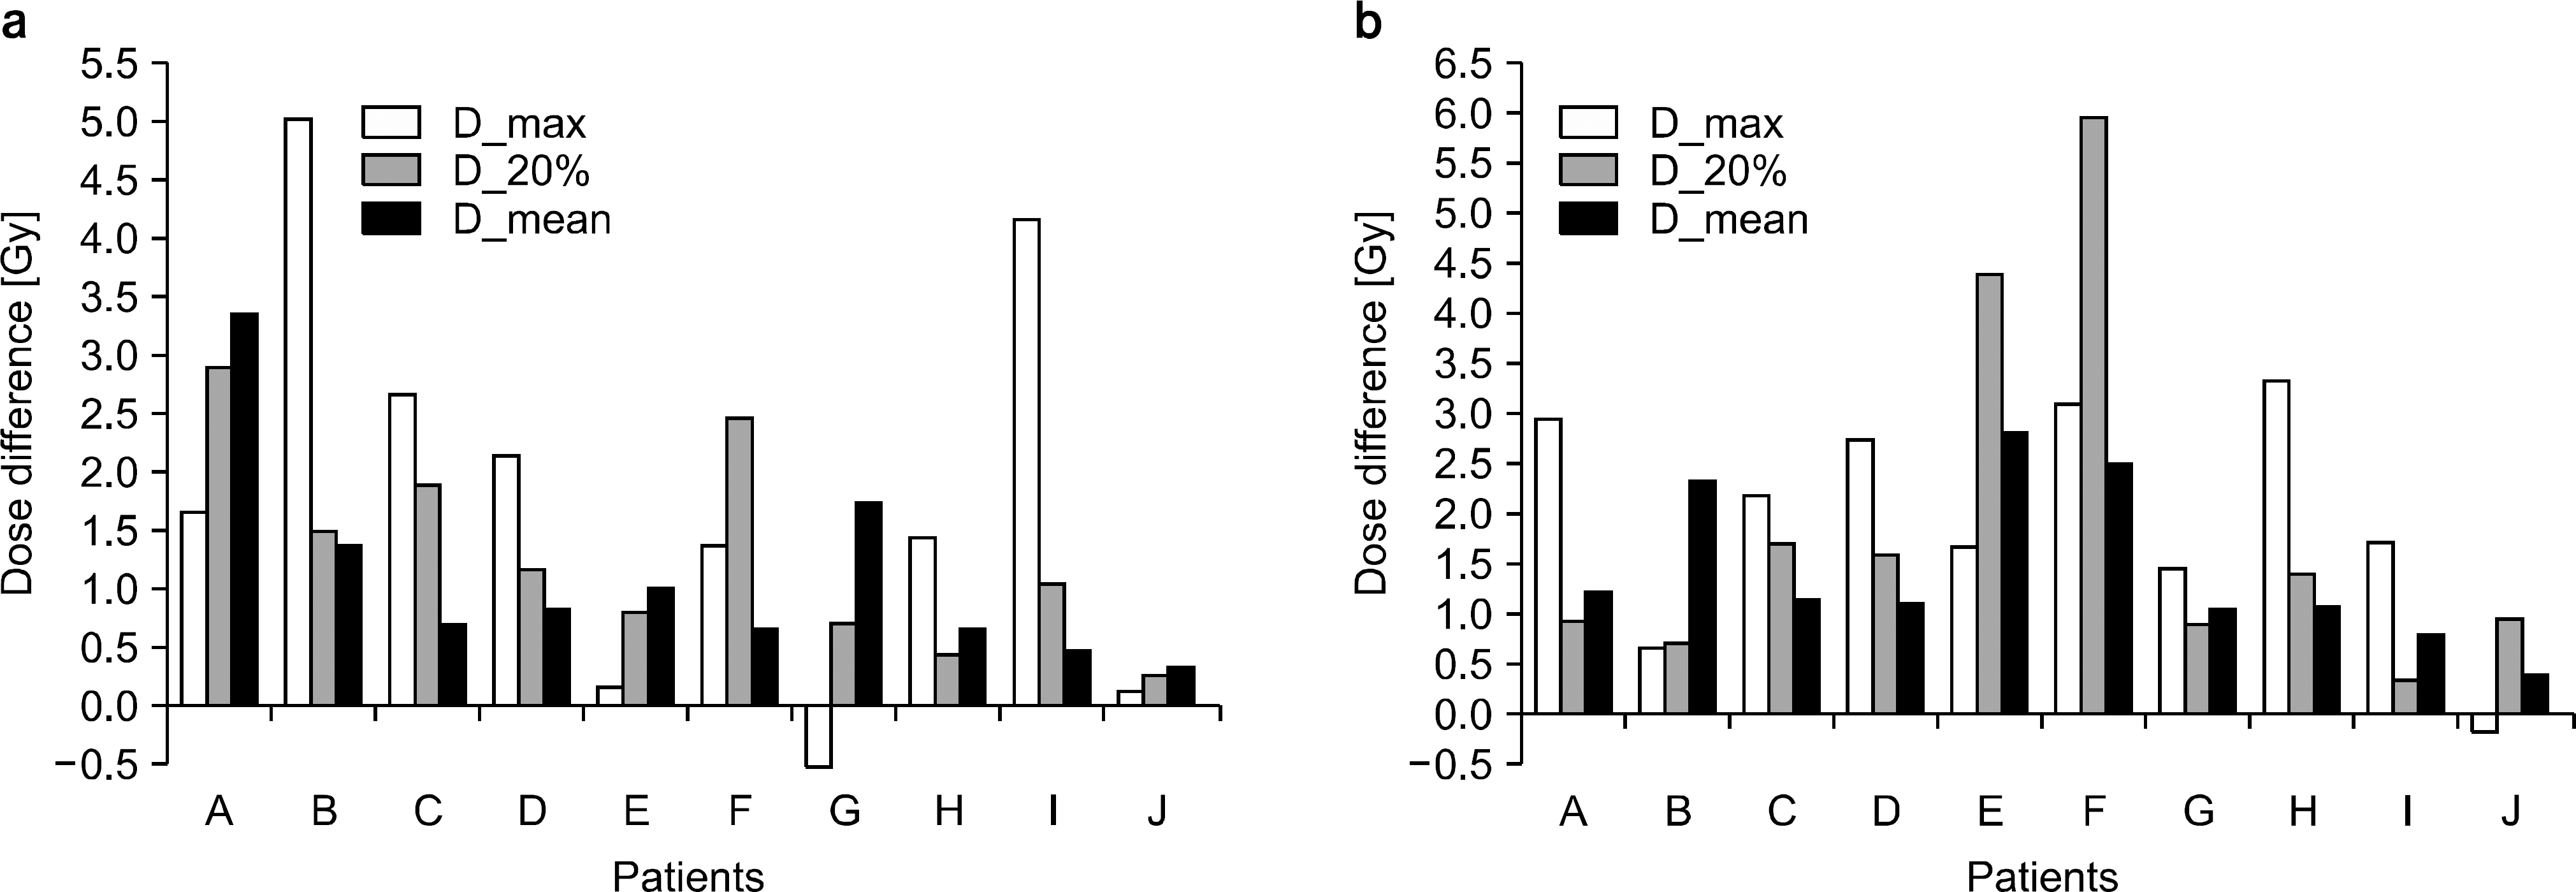
Fig. 10.
Differences of maximum dose and mean dose of spinal cord between the ITV-IMRT beam delivery and Gate-IMRT plan.
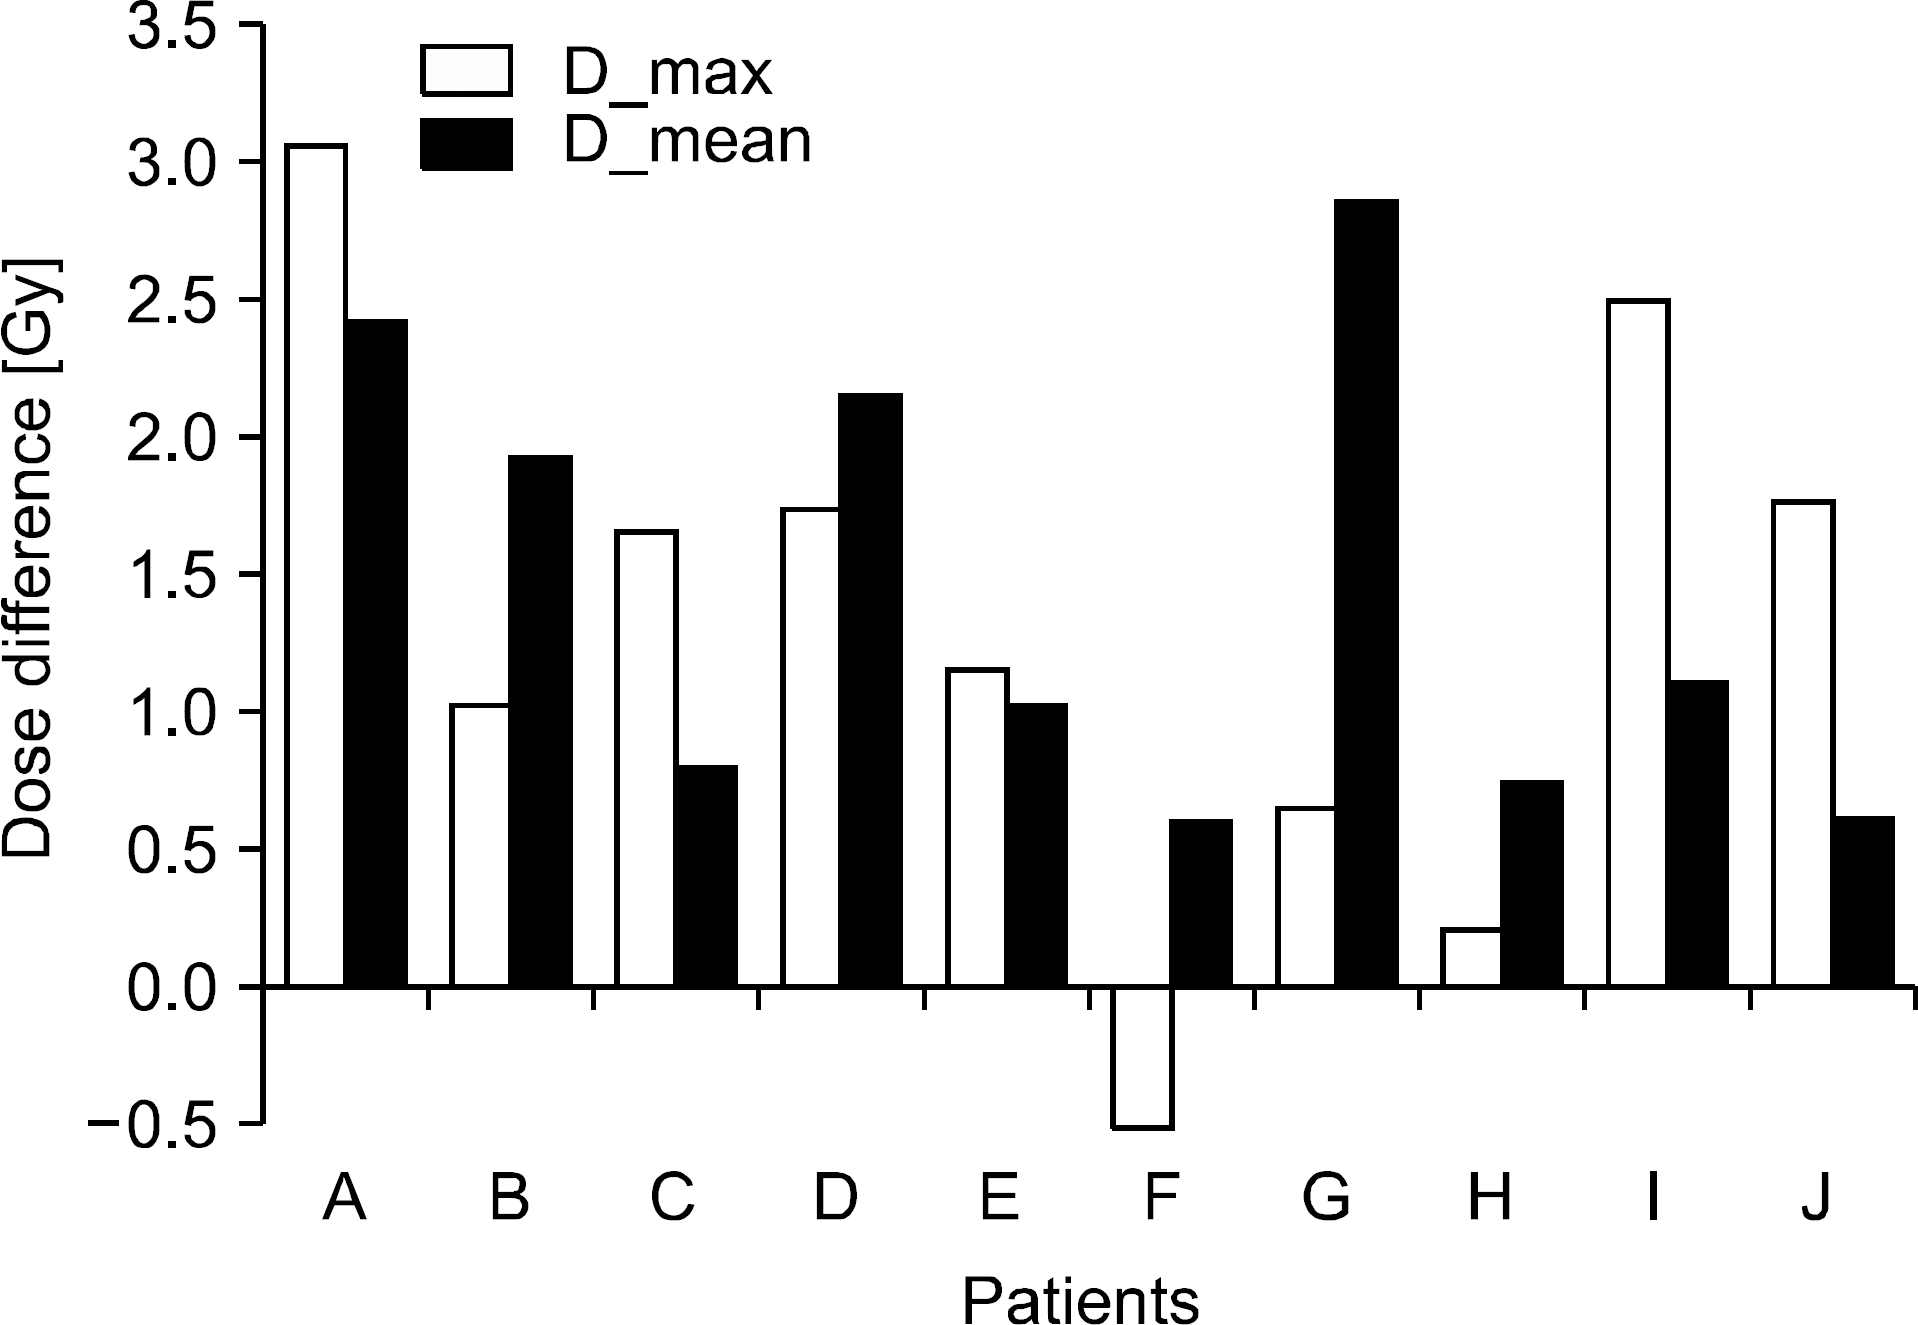
Table 1.
Volume comparison of PTV and OARs between ITV-IMRT plan and Gate-IMRT plan with information on the period and range of respiratory motion in each patient.
Table 2.
Comparison of PTV's DVH on the specific points between the beam delivery of ITV-IMRT and Gate-IMRT plan.
Table 3.
Comparison of liver's DVH on the specific points between the beam delivery of ITV-IMRT and Gate-IMRT plan.
Table 4.
Comparison of kidney's DVH on the specific points between the beam delivery of ITV-IMRT and Gate-IMRT plan.
Table 5.
Comparison of cord's maximum dose and mean dose between the beam delivery of ITV-IMRT and Gate IMRT plan.


 PDF
PDF ePub
ePub Citation
 Print
Print


 XML Download