Abstract
The accuracy and uniformity of CT numbers are the main causes of radiation dose calculation error. Especially, for the dose calculation based on kV-Cone Beam Computed Tomography (CBCT) image, the scatter affecting the CT number is known to be quite different by the object sizes, densities, exposure conditions, and so on. In this study, the scatter impact on the CBCT based dose calculation was evaluated to provide the optimal condition minimizing the error. The CBCT images was acquired under three scatter conditions ("Under-scatter", "Over-scatter", and "Full-scatter") by adjusting amount of scatter materials around a electron density phantom (CIRS062, Tissue Simulation Technology, Norfolk, VA, USA). The CT number uniformities of CBCT images for water-equivalent materials of the phantom were assessed, and the location dependency, either “inner” or “outer” parts of the phantom, was also evaluated. The electron density correction curves were derived from CBCT images of the electron density phantom in each scatter condition. The electron density correction curves were applied to calculate the CBCT based doses, which were compared with the dose based on Fan Beam Computed Tomography (FBCT). Also, 5 prostate IMRT cases were enrolled to assess the accuracy of dose based on CBCT images using gamma index analysis and relative dose differences. As the CT number histogram of phantom CBCT images for water equivalent materials was fitted with a gaussian function, the FHWM (146 HU) for "Full-scatter" condition was the smallest among the FHWM for the three conditions (685 HU for "under scatter" and 264 HU for "over scatter"). Also, the variance of CT numbers was the smallest for the same ingredients located in the center and periphery of the phantom in the "Full-scatter" condition. The dose distributions calculated with FBCT and CBCT images compared in a gamma index evaluation of 1%/3 mm criteria and in the dose difference. With the electron density correction acquired in the same scatter condition, the CBCT based dose calculations tended to be the most accurate. In 5 prostate cases in which the mean equivalent diameter was 27.2 cm, the averaged gamma pass rate was 98% and the dose difference confirmed to be less than 2% (average 0.2%, ranged from -1.3% to 1.6%) with the electron density correction of the "Full-scatter" condition. The accuracy of CBCT based dose calculation could be confirmed that closely related to the CT number uniformity and to the similarity of the scatter conditions for the electron density correction curve and CBCT image. In pelvic cases, the most accurate dose calculation was achievable in the application of the electron density curves of the "Full-scatter" condition
REFERENCES
2. Hector CL, Webb S, Evans PM, et al. The dosimetric consequences of inter-fractional patient movement on conventional and intensity-modulated breast radiotherapy treatments. Radiother Oncol. 54(1):57–64. 2000.

3. Coolens C, et al. The susceptibility of IMRT dose distributions to intrafraction organ motion: an investigation into smoothing filters derived from four dimensional computed tomography data. Med Phys. 33(8):2809–2818. 2006.

4. Hugo GD, Agazaryan N, Solberg TD, et al. The effects of tumor motion on planning and delivery of respiratory-gated IMRT. Med Phys. 30(6):1052–1066. 2003.

5. Yoo S, Yin FF, et al. Dosimetric feasibility of cone-beam CT-based treatment planning compared to CT-based treatment planning. Int J Radiat Oncol Biol Phys. 66(5):1553–61. 2006.

6. Ding GX, et al. A study on adaptive IMRT treatment planning using kV cone-beam CT. Radiother Oncol. 85(1):116–25. 2007.

7. Siewerdsen JH, Jaffray DA, et al. Cone-beam computed tomography with a flat-panel imager: magnitude and effects of x-ray scatter. Medical physics. 28(2):220–231. 2001.

8. Lee L, Le QT, Xing L, et al. Retrospective IMRT dose reconstruction based on cone-beam CT and MLC log-file. Int J Radiat Oncol Biol Phys. 70(2):634–344. 2008.

9. Guan H, Dong H, et al. Dose calculation accuracy using cone-beam CT (CBCT) for pelvic adaptive radiotherapy. Phys Med Biol. 54(20):6239–6250. 2009.

10. Yang Y, et al. Evaluation of on-board kV cone beam CT (CBCT)-based dose calculation. Phys Med Biol. 52(3):685–705. 2007.

11. Rong Y, et al. Dose calculation on kV cone beam CT images: an investigation of the Hu-density conversion stability and dose accuracy using the site-specific calibration. Med Dosim. 35(3):195–207. 2010.

12. Endoa Masahiro, et al. Effect of scattered radiation on image noise in cone beam CT. Med Phys. 28:469. 2001.
13. Calvo Ortega JF, et al. A dosimetric evaluation of the Eclipse AAA algorithm and Millennium 120 MLC for cranial intensity-modulated radiosurgery. Med Dosim. 2013.

14. Lu W, et al. Deformable registration of the planning image (kVCT) and the daily images (MVCT) for adaptive radiation therapy. Phys Med Biol. 51(17):4357–4374. 2006.

15. Matsinos E, et al. Current status of the CBCT project at Varian Medical Systems Proc. SPIE. 5745. 340–351. (2005).
Fig. 1.
CIRS062 phantom and Inserts position; CIRS062 phantom consists of inner (head) and outer (lung) parts. Eight different tissue equivalent inserts pairs were arranged symmetrically around the phantom center at the inner and outer region of the phantom.
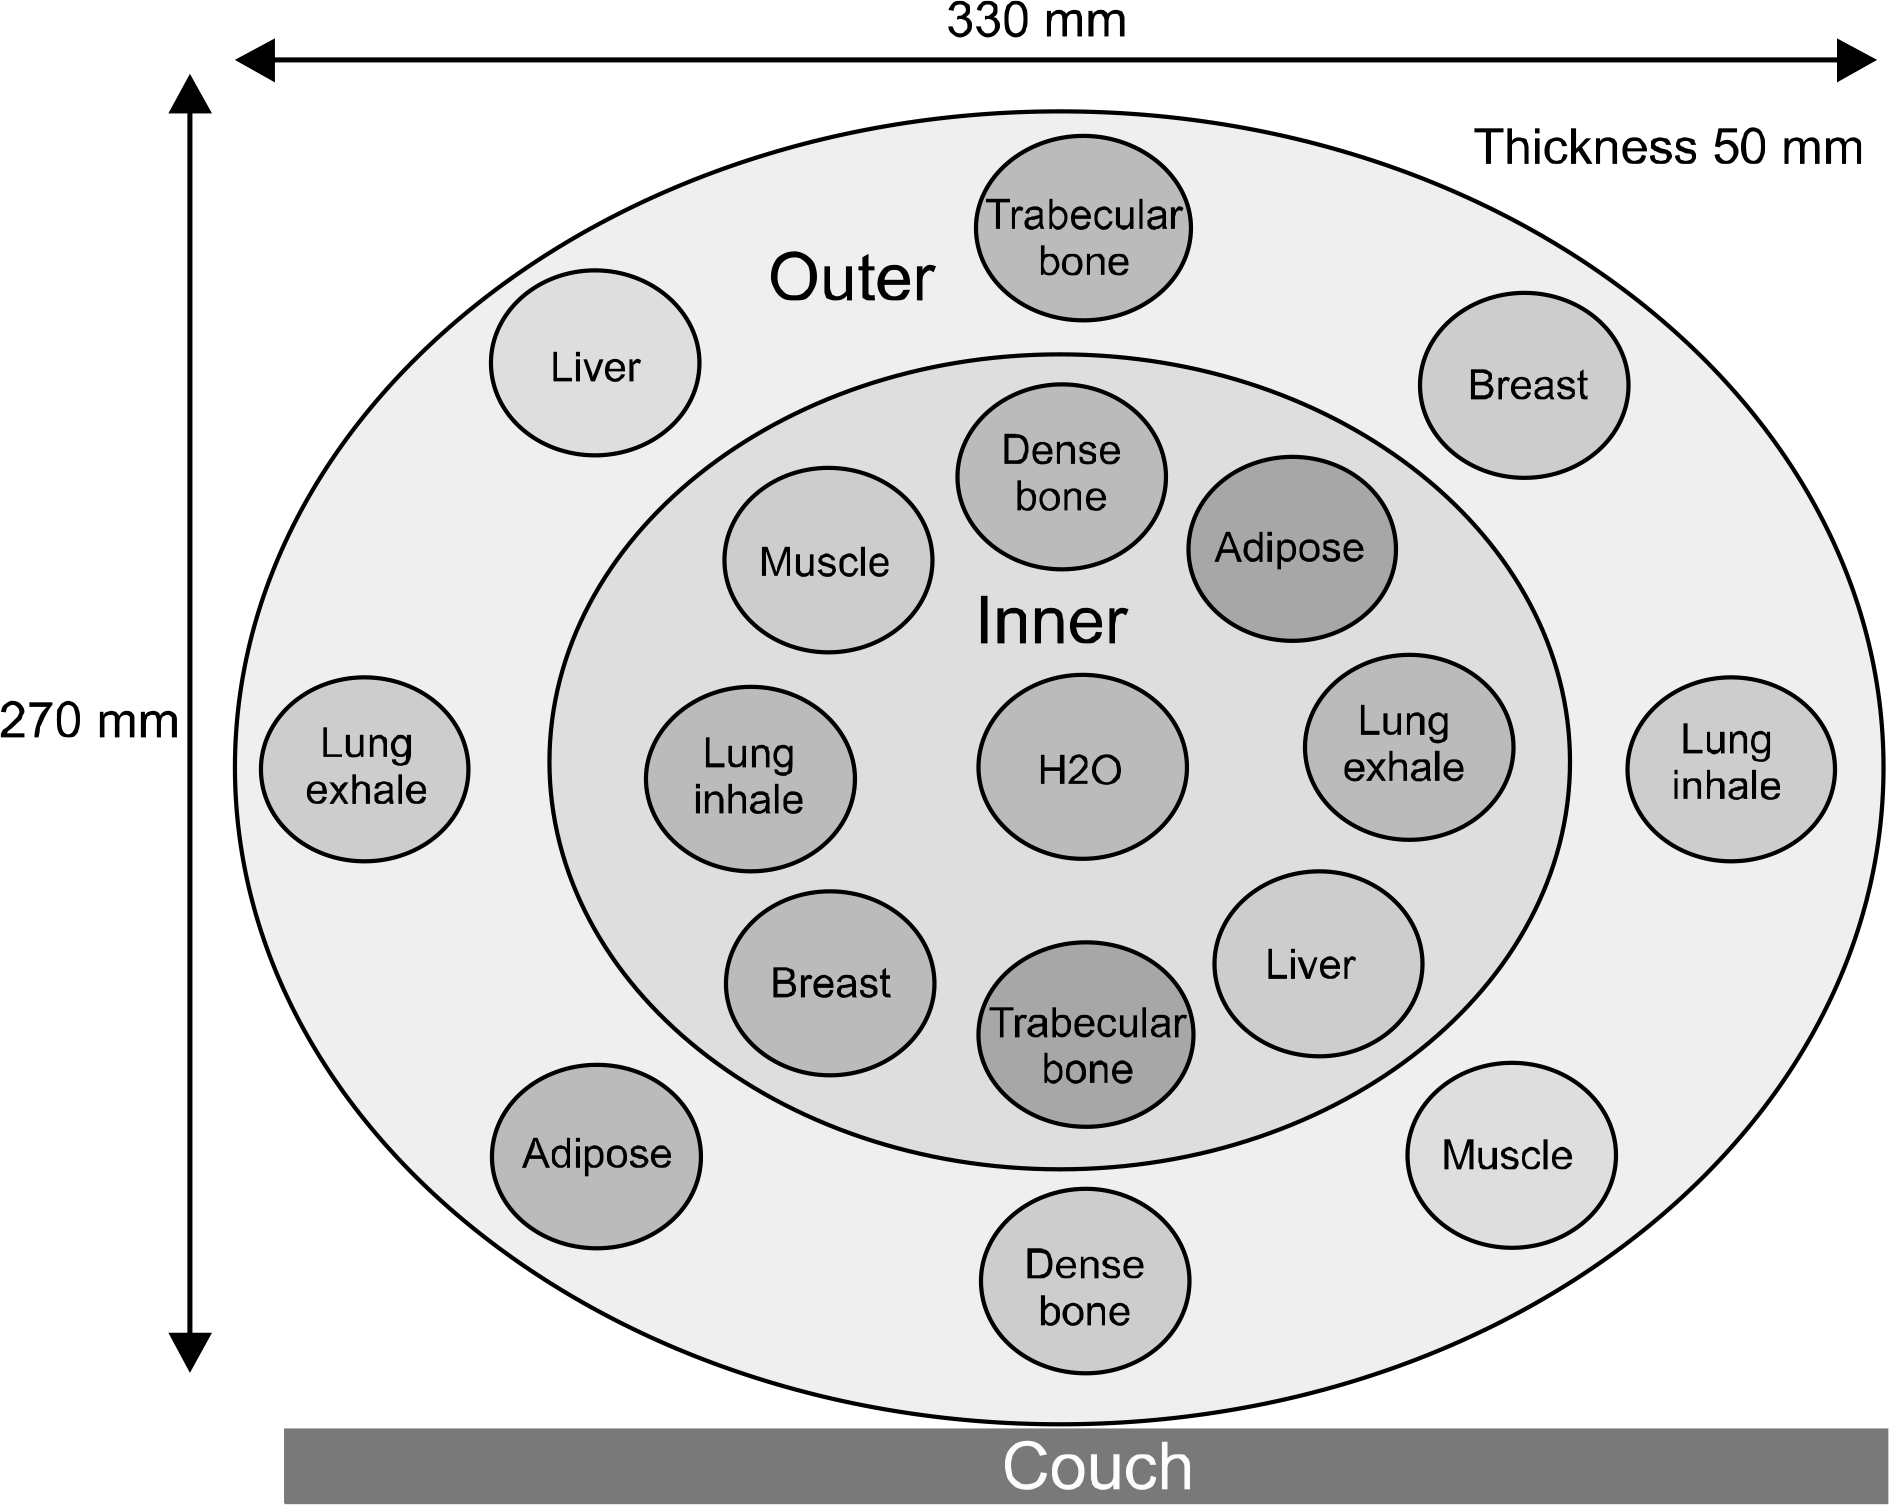
Fig. 2.
Phantom scatter conditions; three different scatter conditions were implemented by adding different amount of scatter material around the CIRS062 phantom. (a) “Under-scatter (U)” condition: the phantom was only placed inside the exposure volume of kV beam. (b) “Over-scatter (O)” condition: the phantom was immersed in a ∼30 cm3 cubic water tank. (c) “Full-scatter (F)” condition: the phantom was immersed in a cylinder-shaped water with the same diameter of 33 cm and 25 cm length, which is of similar scatter condition for the CBCT acquisition of pelvic regions.
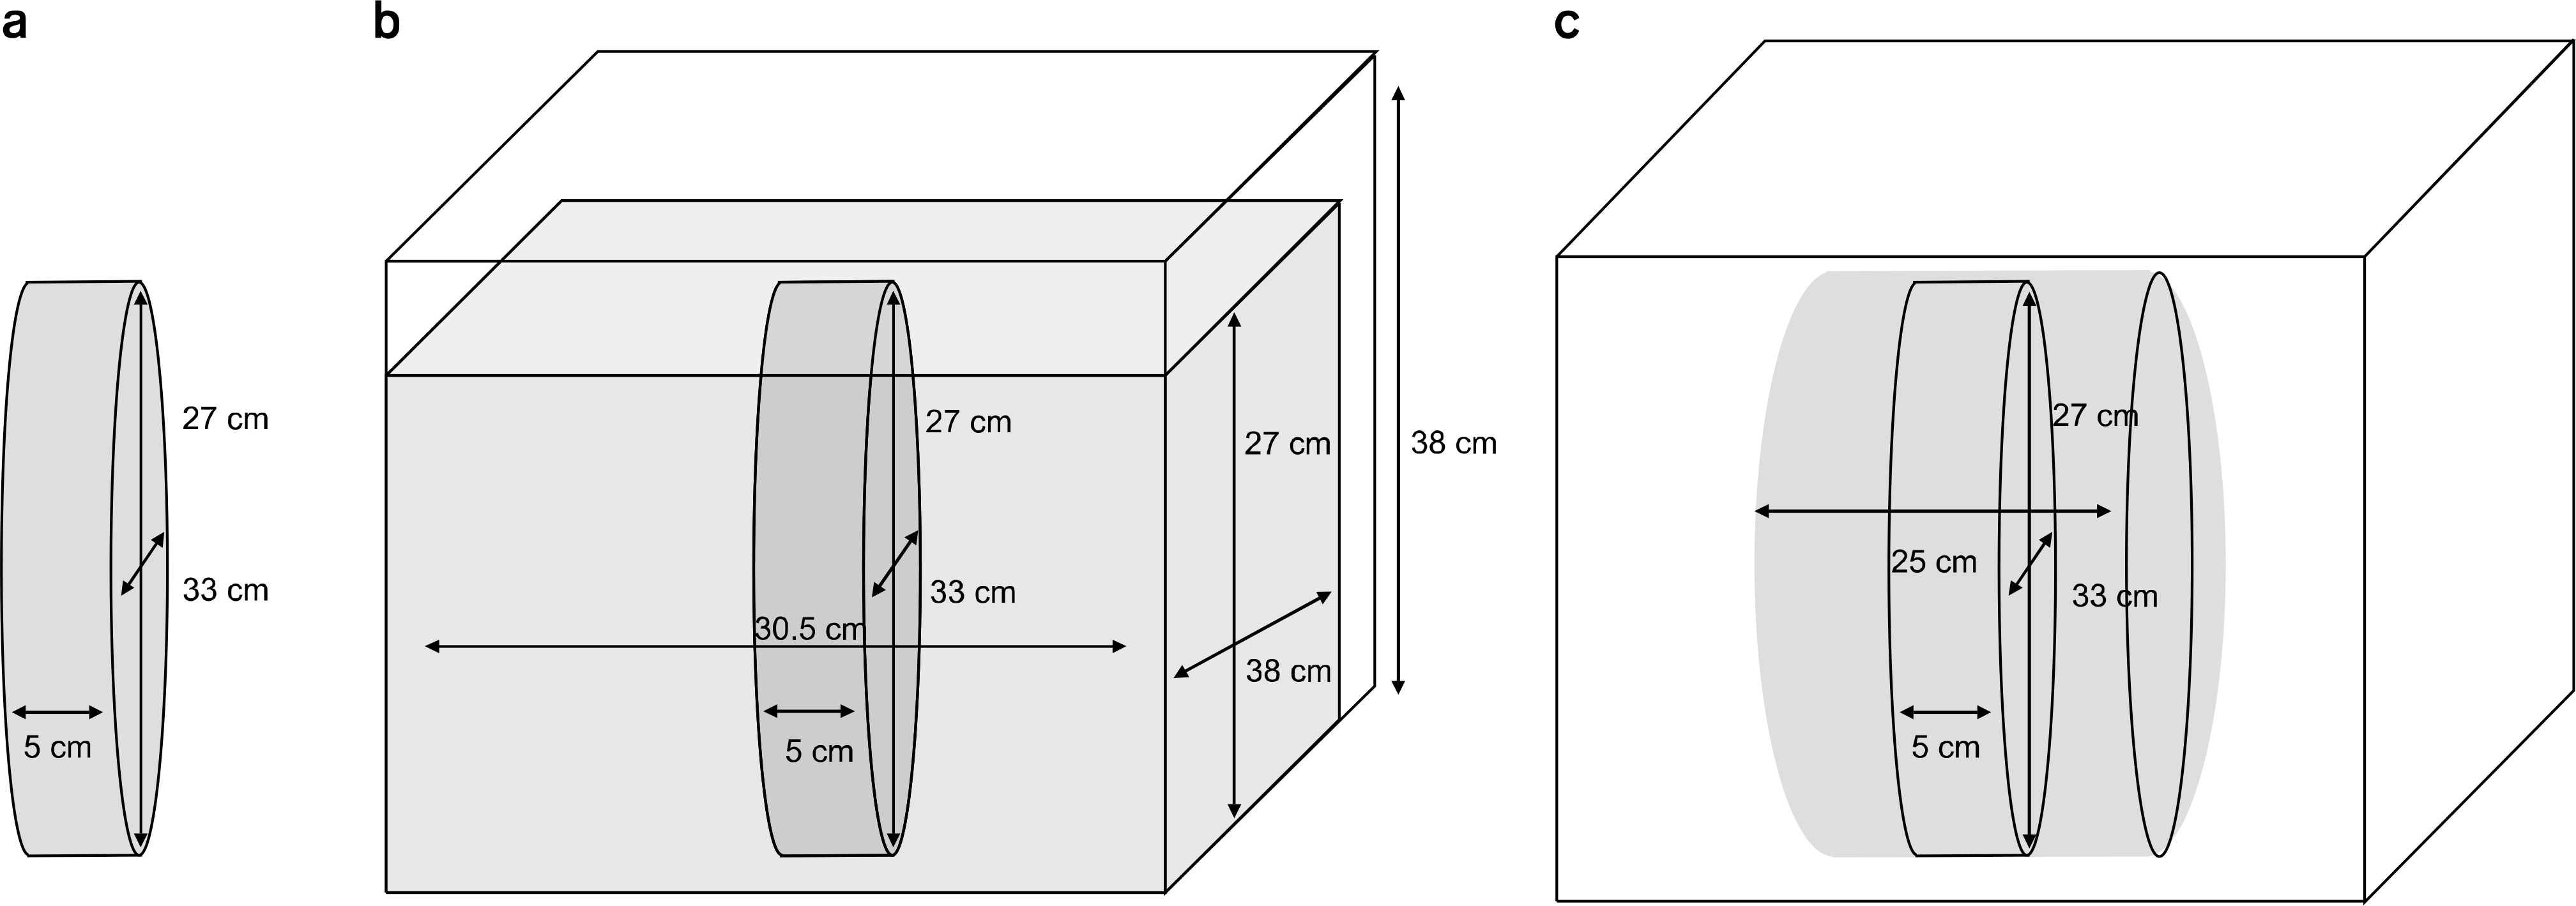
Fig. 3.
HU histograms of the FBCT and CBCT images with various scatter conditions. (a) FBCT image and HU histogram, (b) CBCT image and histogram with “Under-scatter” condition. (c) CBCT image and histogram with “Over-scatter” condition. (d) CBCT image and histogram with “Full-scatter” condition. The main peak on each histogram represents the histogram of the water equivalent material that composes the main body of the phantom.
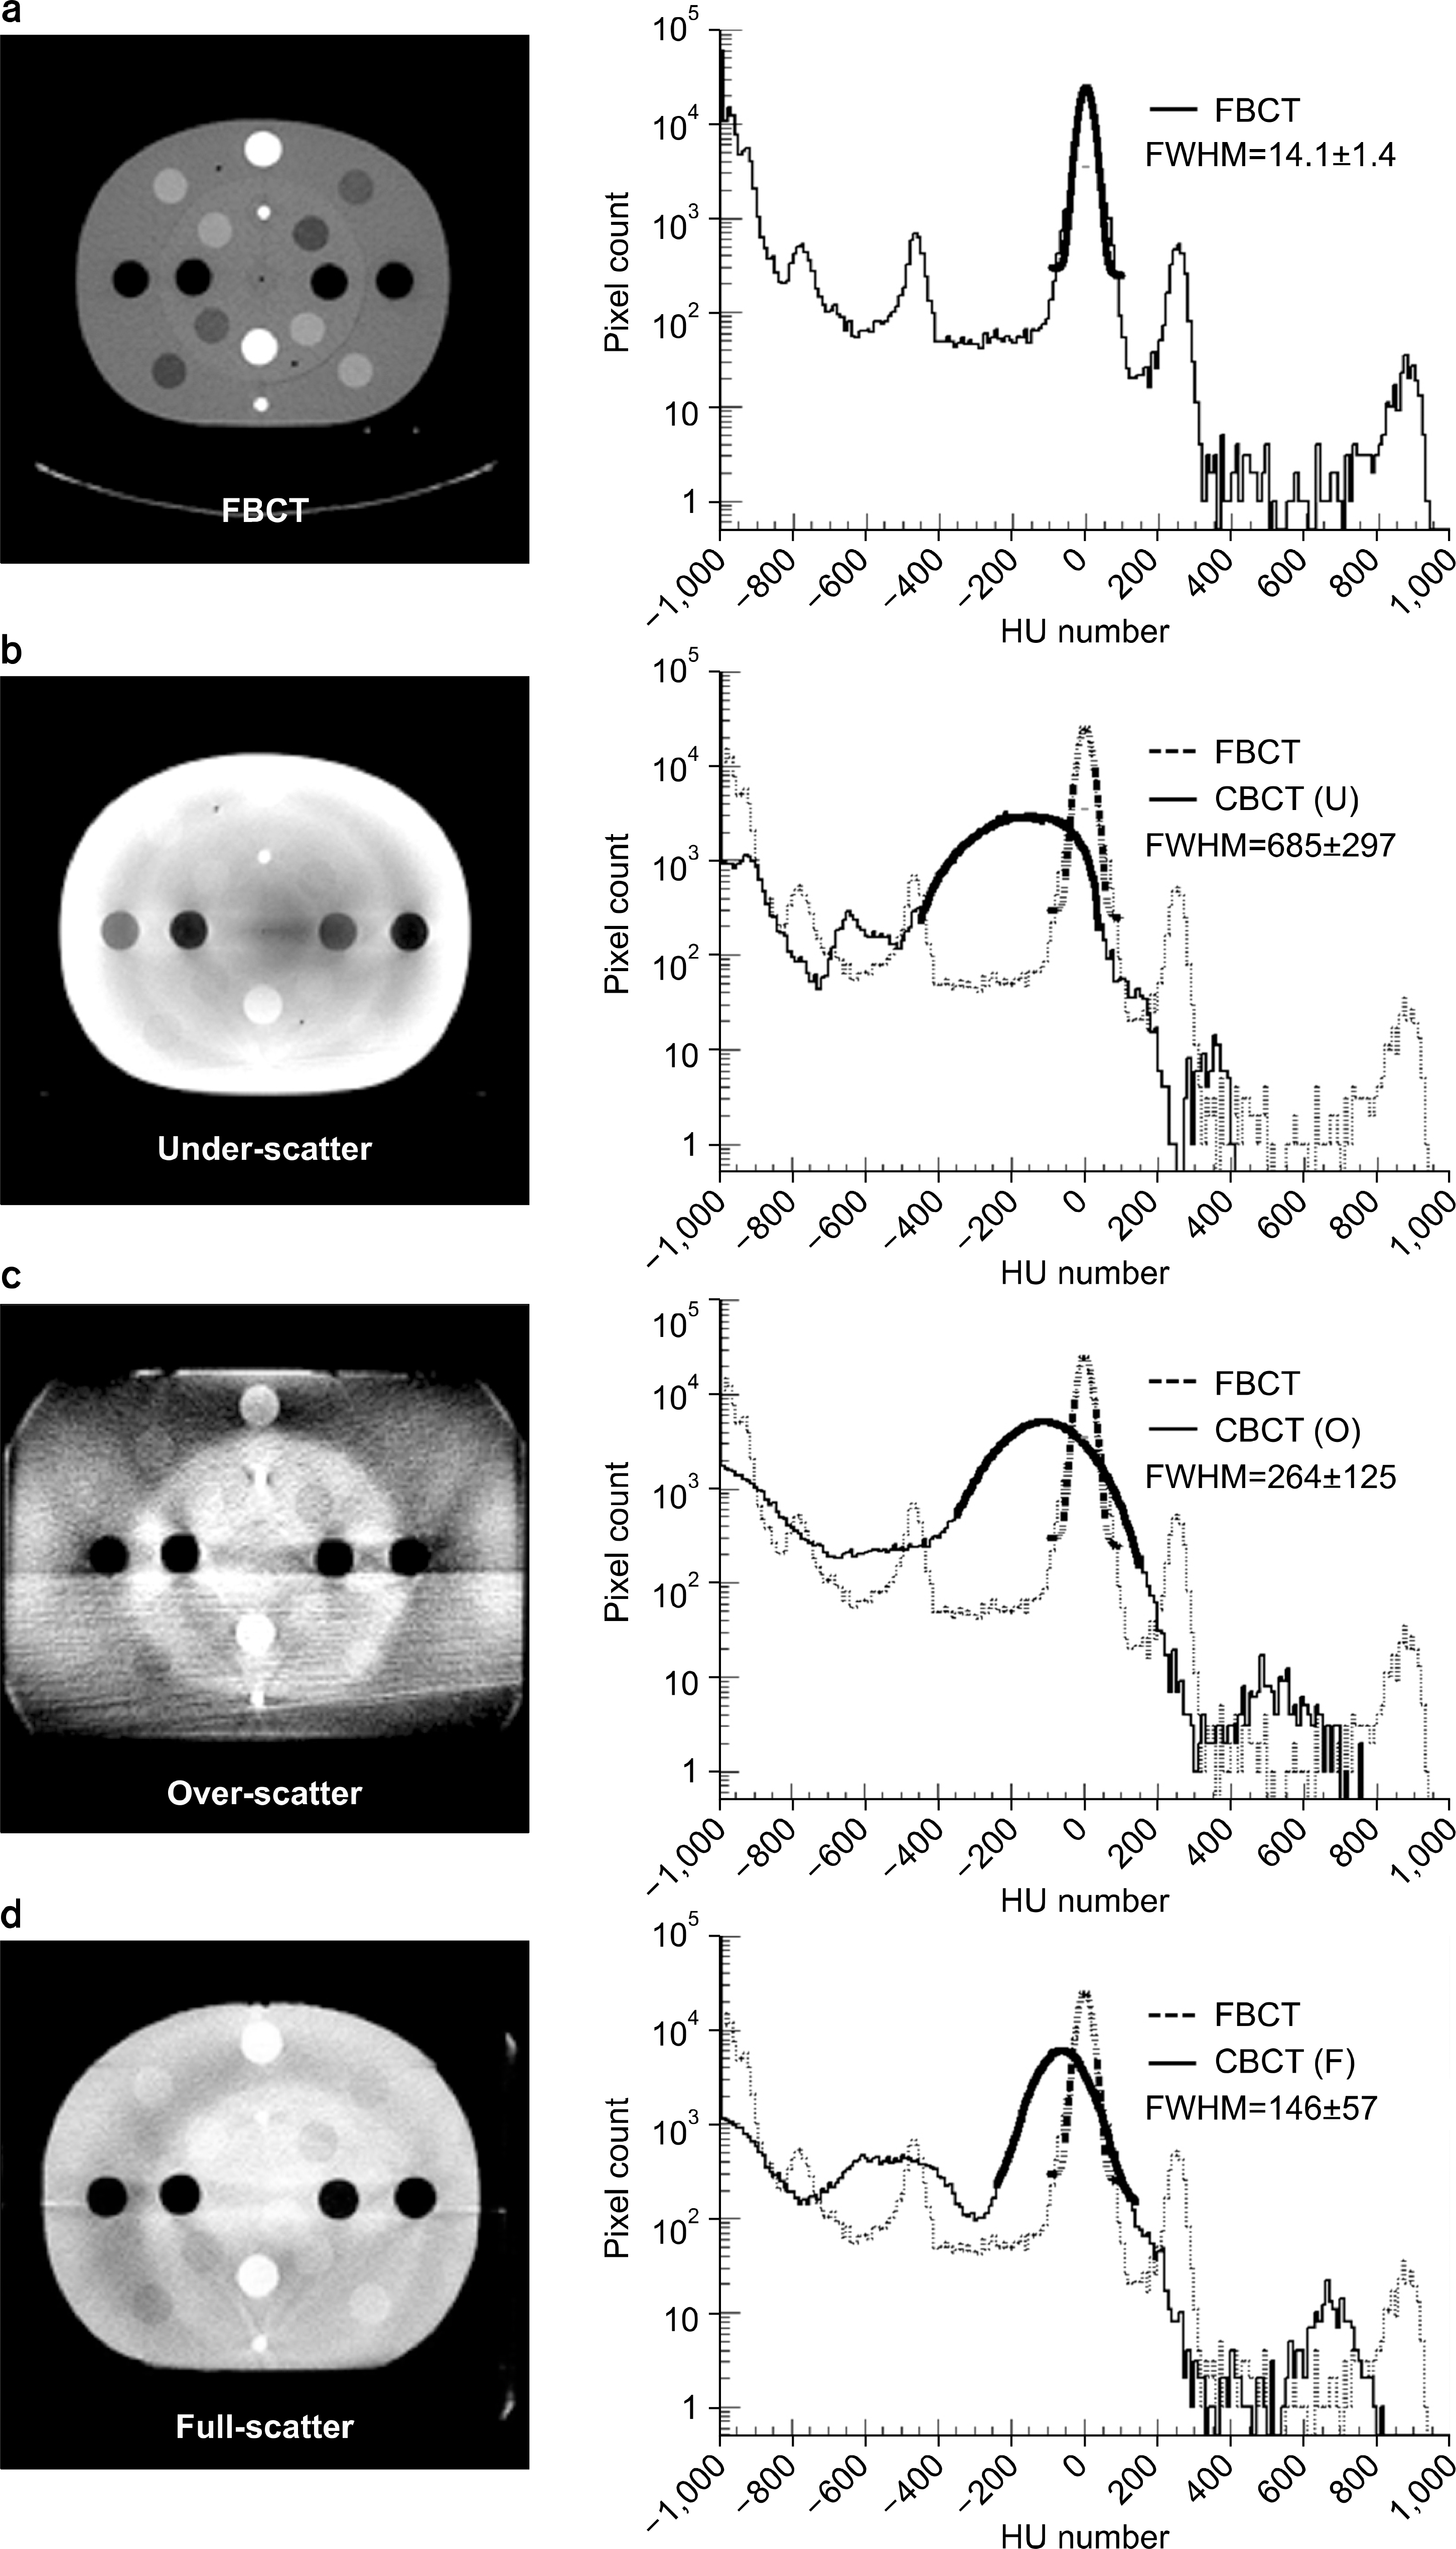
Fig. 4.
Comparison of FBCT and CBCT HU-ED calibration curves and HU differences of the same ED insert-pairs between their locations (inner and outer parts of phantom). (a) FBCT HU-ED calibration curve with three scatter condition. (b) CBCT HU-ED calibration curve with “Under-scatter” condition. (c) CBCT HU-ED calibration curve with “Over-scatter” condition. (d) CBCT HU-ED calibration curve with “Full-scatter” condition.
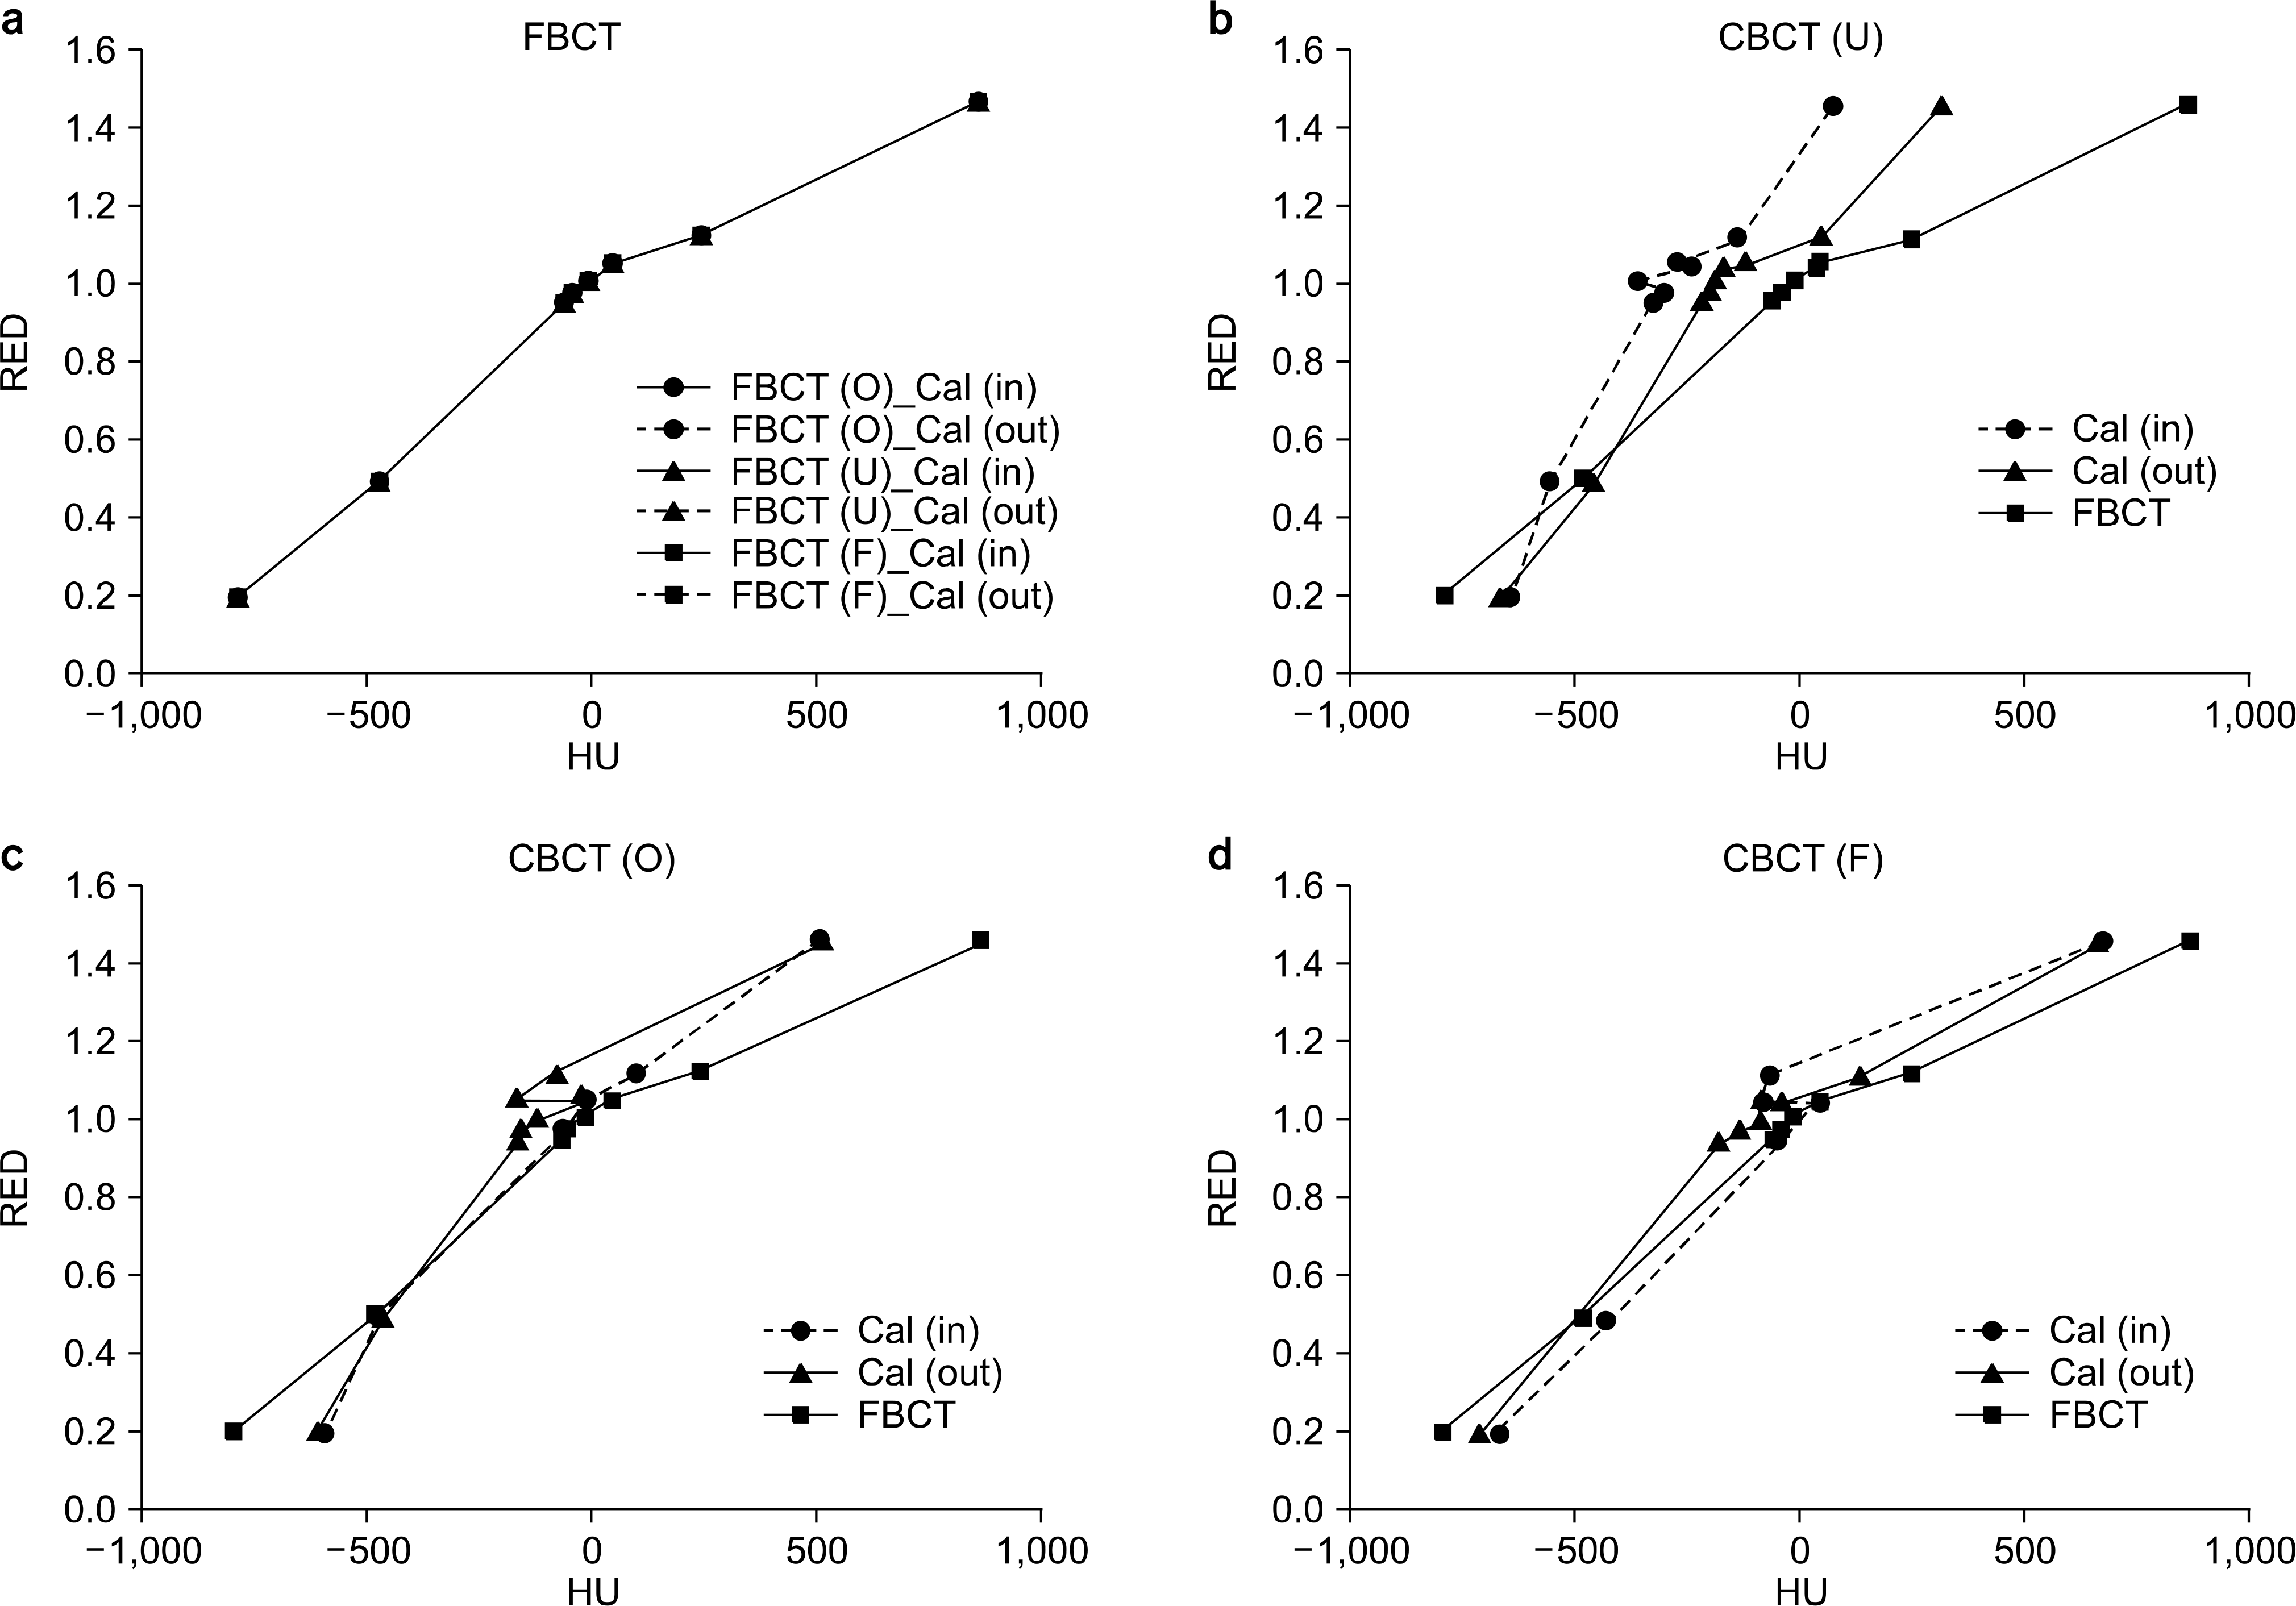
Fig. 5.
Percentage dose difference map of different HU-ED calibration based CBCT dose distributions for prostate patient 1. (a) “Under-scatter” calibration curve. (b) “Over-scatter” calibration curve. (c) “Full-scatter” calibration curve.

Fig. 6.
Histograms of percentage dose differences between the FBCT and CBCT dose distributions for a prostate case. (a) “Under-scatter” calibration curve. (b) “Over-scatter” calibration curve. (c) “Full-scatter” calibration curve.
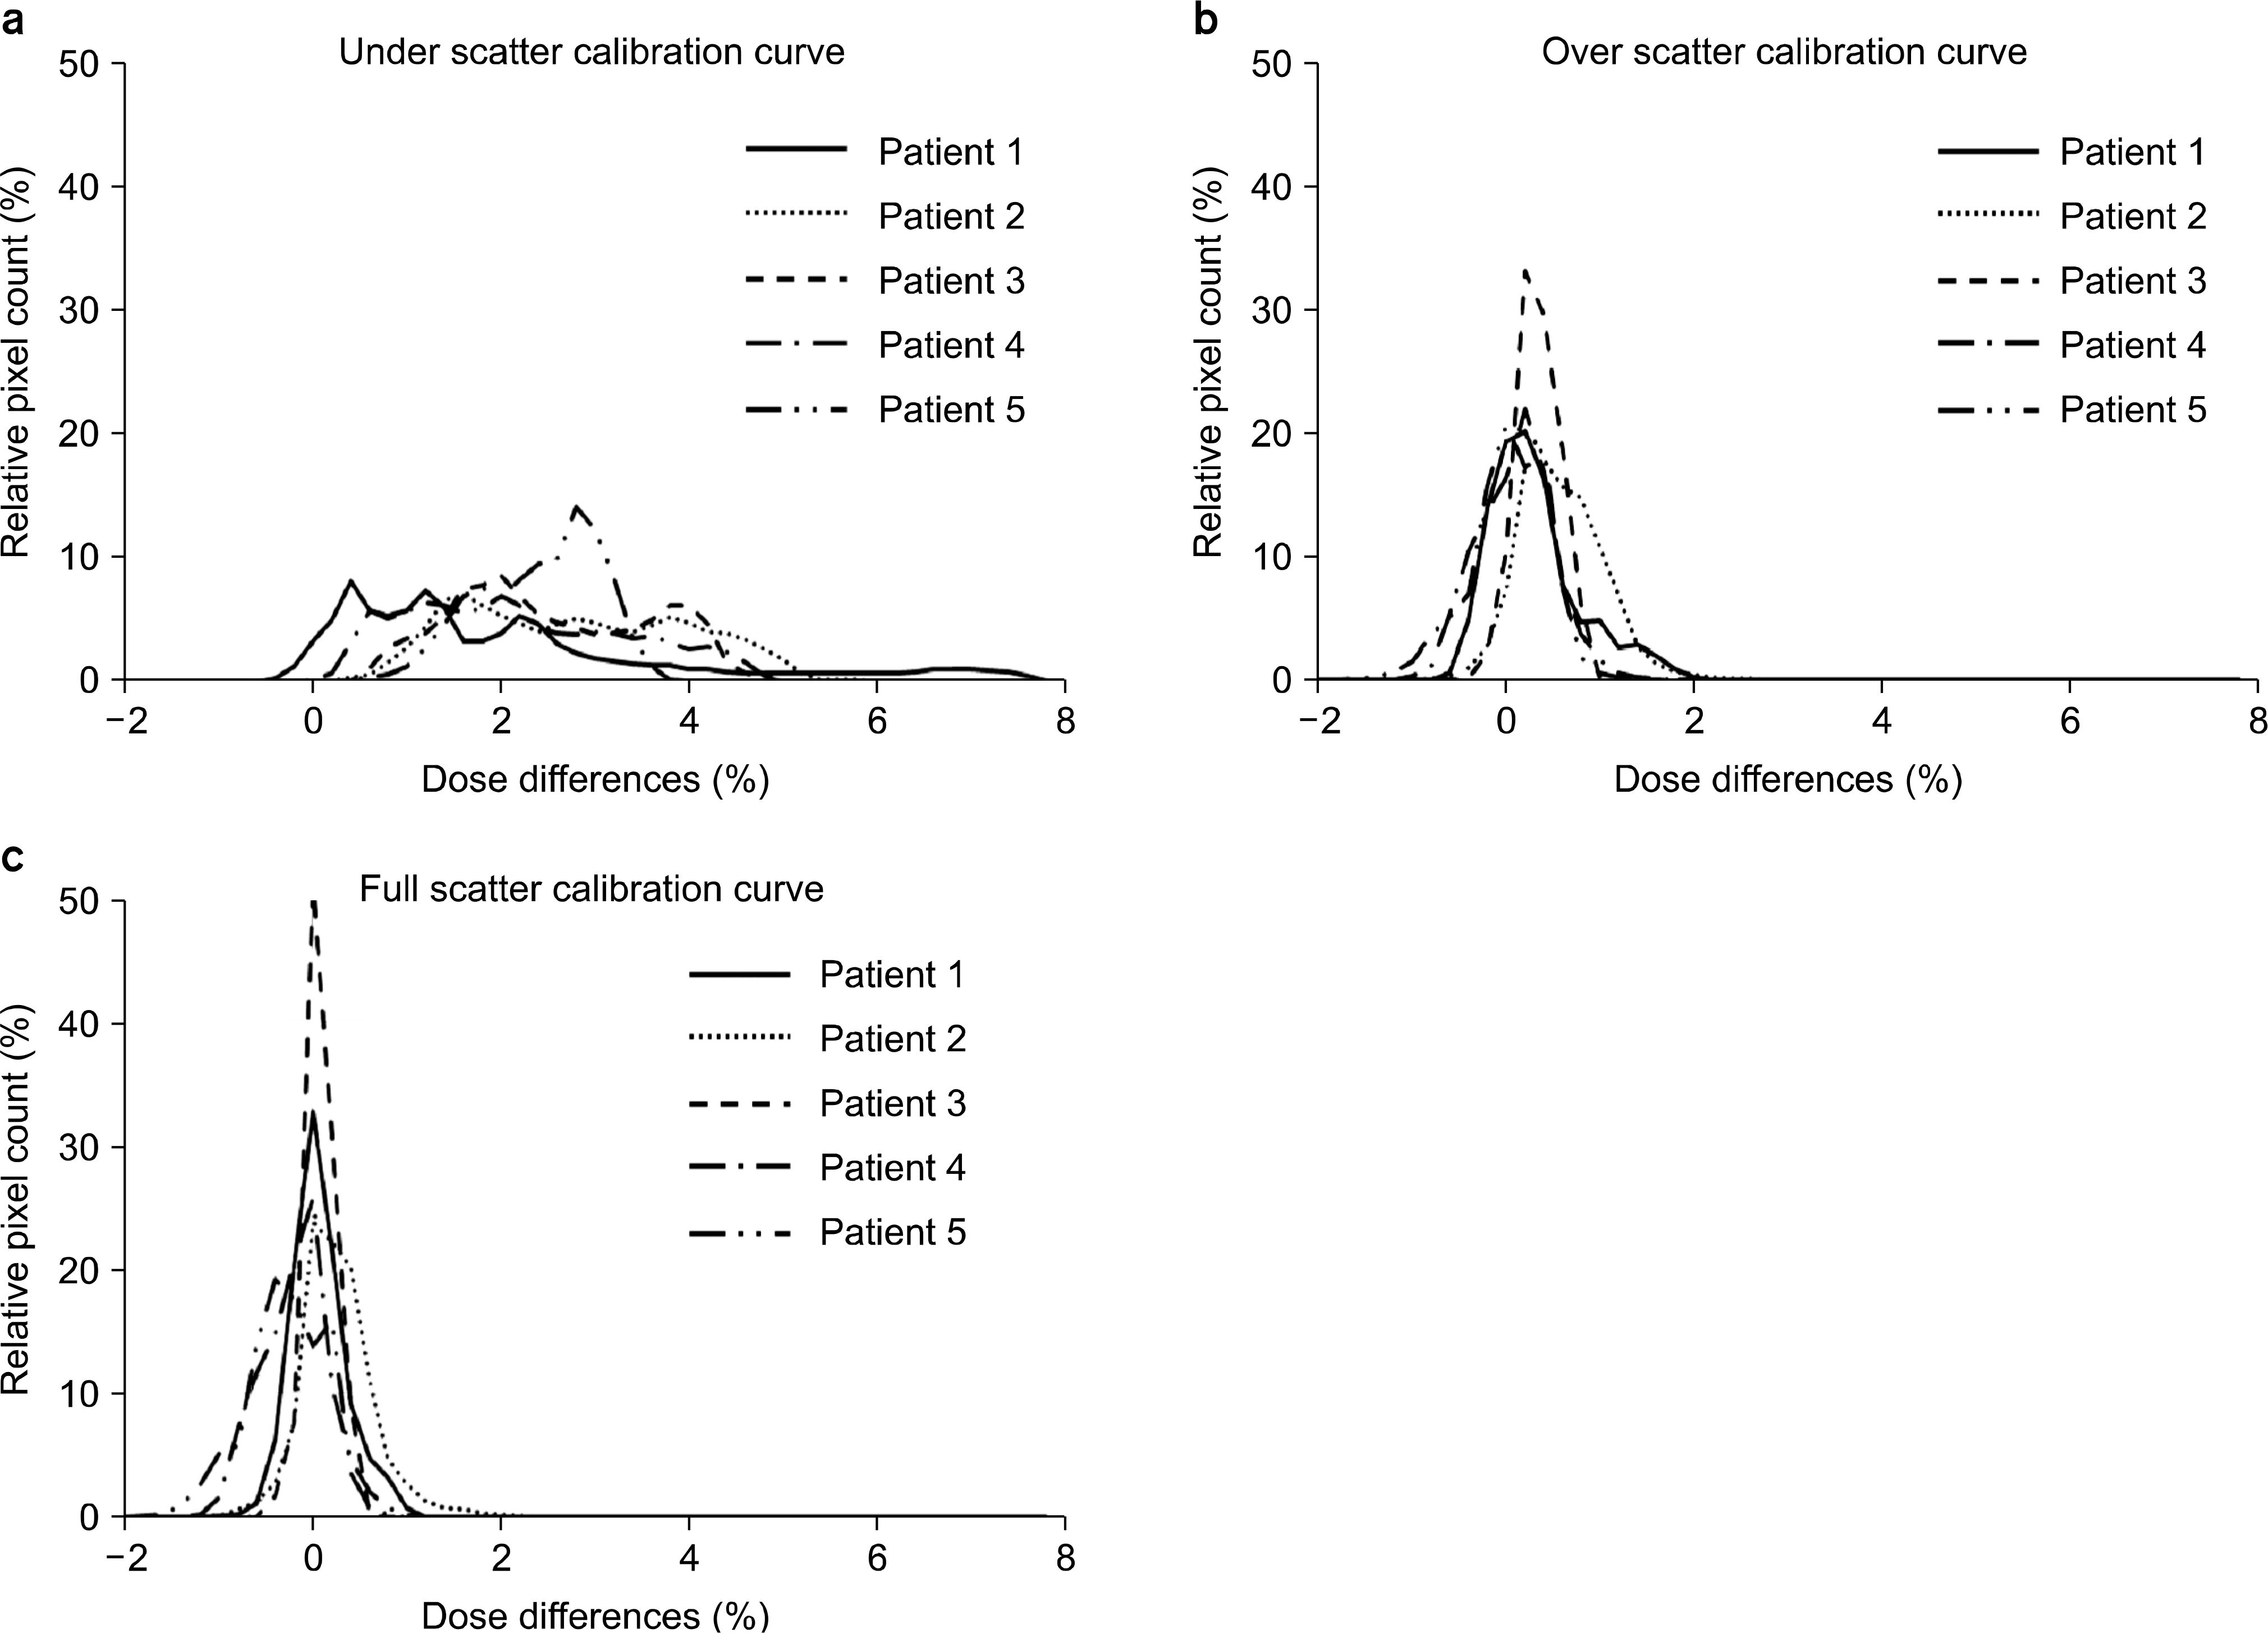
Table 1.
Average gamma indices of the dose distributions o the phantom CBCTs with a combination of three differen HU-ED calibrations.
Table 2.
Average gamma indices and percentage dose differences between the FBCT and CBCT dose distributions based on different HU-ED calibrations for all the 5 patients.


 PDF
PDF ePub
ePub Citation
 Print
Print


 XML Download