Abstract
We aimed to evaluate the dosimetric characteristics of reproducibility, linearity and dose dependence of optical stimulated luminance dosimeter (OSLD) in the Co-60 Gamma-rays and to analyze with a precedent study in field of the diagnostic radiography and radiotherapy. The reproducibility was 0.76% of the coefficient of variation, the homogeneity was within 1.5% of the coefficient of variation and OSLD had supra-linear response more than 3 Gy. So the correlation between dose and count was fitted by quadratic function. The count depletion by repeated reading was 0.04% per reading regardless of the irradiated dose. And the half time of decay curve according to the irradiated dose was 0.68 min. with 1 Gy, 1.04 min. with 5 Gy, and 1.10 min. with 10 Gy, respectively. In case of annealing for 30 min, the removal rate was 88% with 1 Gy, 90% with 5 Gy, and 92% with 10 Gy, respectively and 99% in case of annealing time for 4 hour. It is feasible to use OSLDs for dose evaluation in Co-60 Gamma-rays when considering the uncertainty on the procedure according to the irradiated dose.
REFERENCES
1. Aguirre J, Alvarez P, Amador C, Tailor A, Followill D. WE-D-BRB-08: Validation of the commissioning of the optically stimulated luminescence (OSL) system for remote dosimetry audits. Med Phys. 37(6):3428. 2010.
2. Yu C, Luxton G. TLD dose measurement: a simplified accurate technique for the dose range from 0.5 cGy to 1000 cGy. Med Phys. 26(6):1010–1016. 1999.

3. Jursinic PA. Characterization of optically stimulated luminescent dosimeters, OSLDs for clinical dosimetric measurements. Med Phys. 34(12):4594–4604. 2007.

4. Viamonte A, da Rosa LA, Buckley LA, A Cherpak A, Cygler JE. Radiotherapy dosimetry using a commercial OSL system. Med Phys. 35(4):1261–1266. 2008.

5. Al-Senan RM, Hatab MR. Characteristics of an OSLD in the diagnostics energy range. Med Phys. 38(7):4396–4405. 2011.
6. Han S, Kim K, Park S, Lee S, Yi C, Kim H, Jung H, Kim M, Ji Y. SU-E-T-31: The evaluation of Dosimetric characteristics of OSLDs based on output correction factor in low energy. Med Phys. 40(6):210. 2013.

7. Kerns JR, Kry SF, Sahoo N. Characteristics of optically stimulated luminescence dosimeters in the spread-out Bragg peak region of clinical proton beam. Med Phys. 39(4):1854–1863. 2012.
8. Jursinic PA. changes in optically stimulated luminescent dosimeter (OSLD) dosimetric characteristics with accumulated dose. Med Phys. 37(1):132–140. 2010.

9. Omotayo AA, Cygler JE, Sawakuchi GO. The effect for different bleaching wavelengths on the sensitivity of Al2O3: C optically stimulated luminescence detectors (OSLDs) exposed to 6MV photon beams. Med Phys. 39(9):5457–5468. 2012.
10. Yahnke CJ. Calibrating the microStar. 2009.
11. Reft CS. The energy dependence and dose response of a commercial optically stimulated luminescent detector for kilovoltage photon, megavoltage photon, and electron, proton, and carbon beams. Med Phys. 36(5):1690–169. 2009.

12. Kim DW, Chung WK, Shin DO, Yoon M. Dose response of commercially available optically stimulated luminescent detector, A2O3: C for megavoltage photons and electrons. Radiat Prot Dosim. 149(2):101–108. 2012.
13. Landauer Corporation. http://www.landauer.com/Industry/Products/Dosimeters/nanoDot_OSLD.aspx.
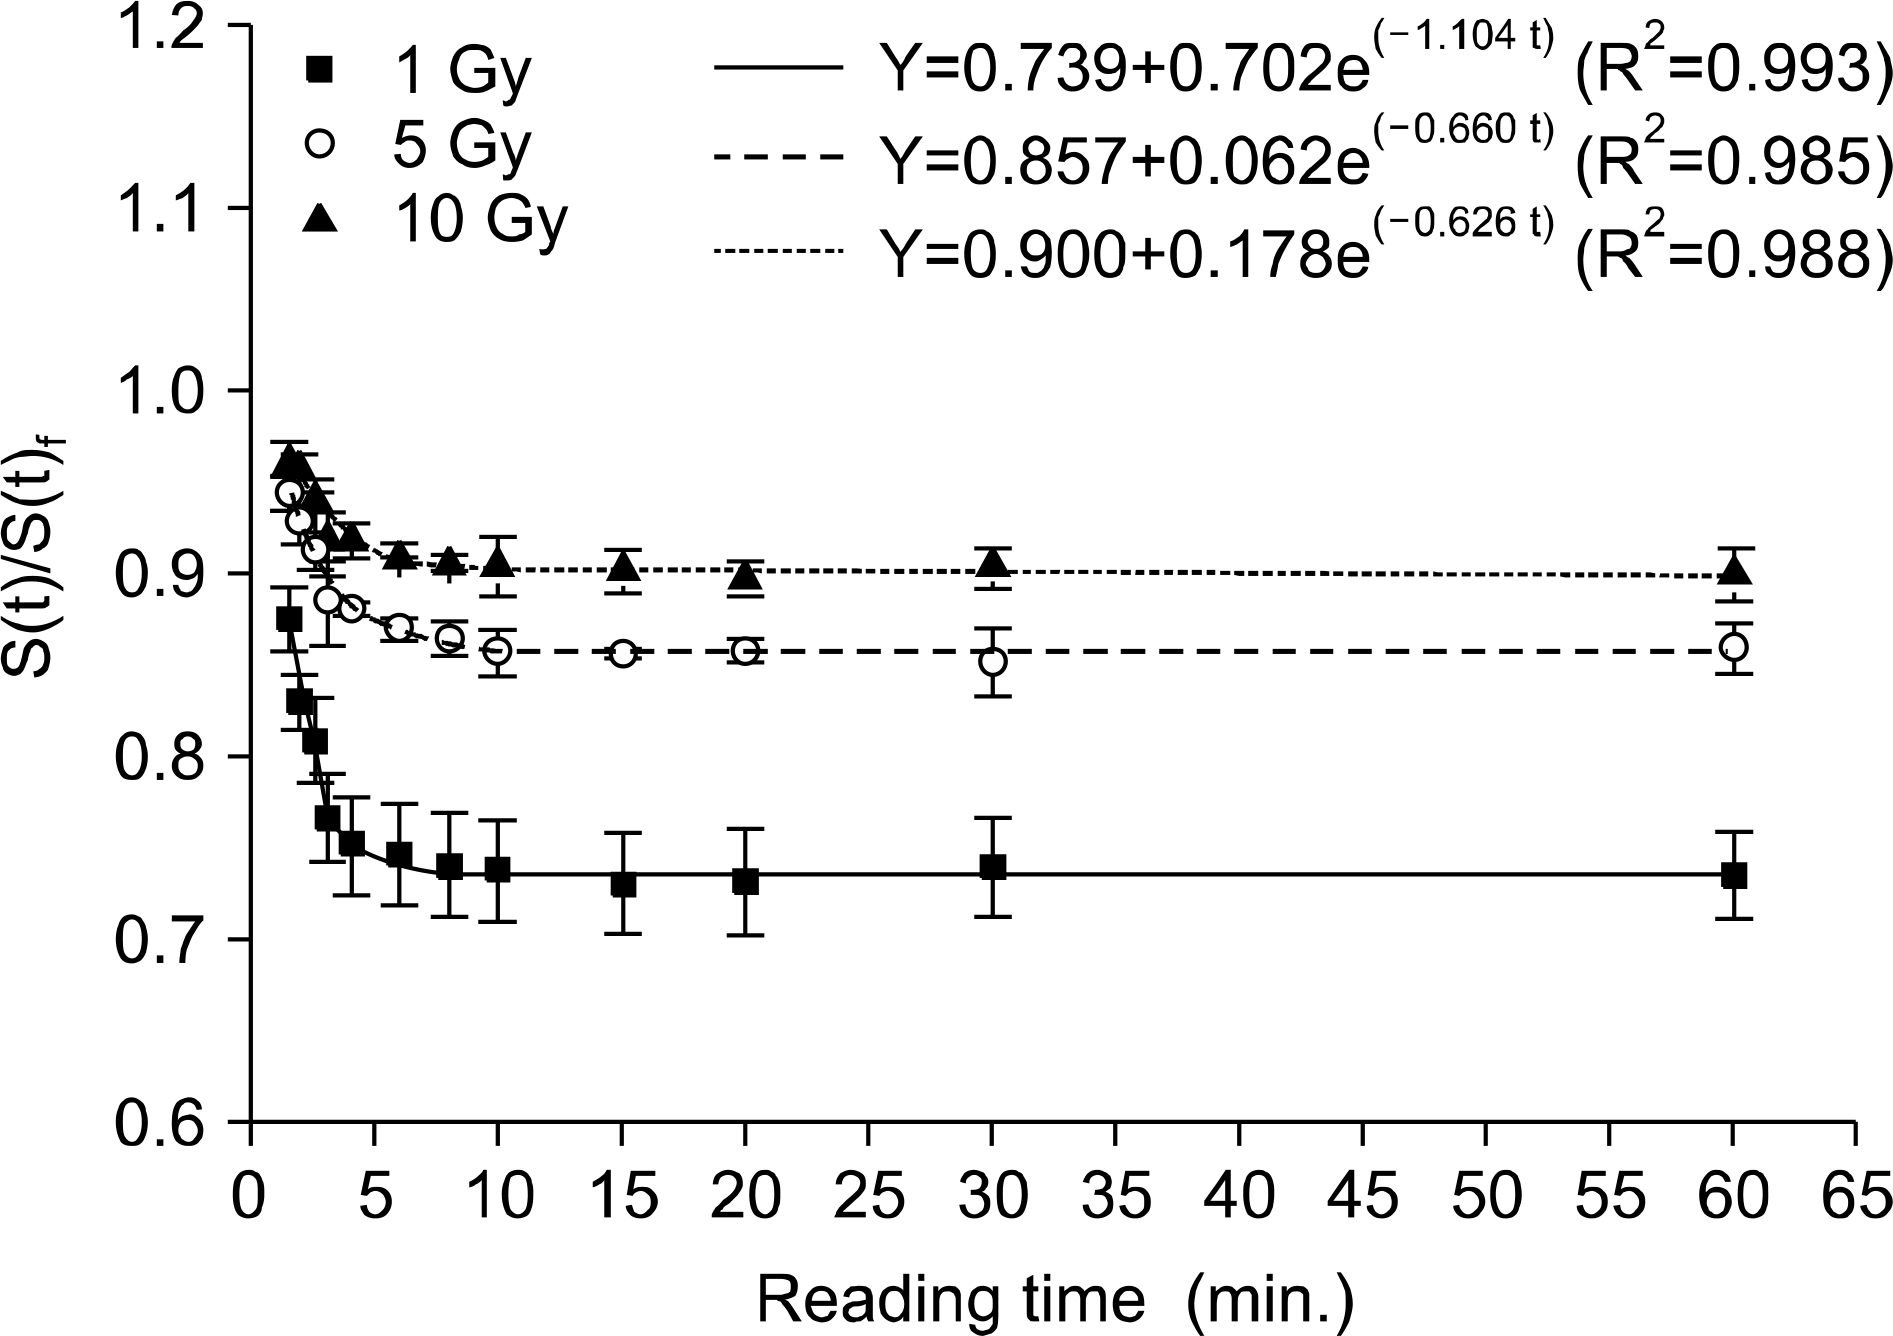
Fig. 1.
Decay time of the OSLD count rate (S(t)/S(t)f) as a function of reading time after irradiating dose (1, 5, and 10 Gy). S(t) is the OSLD count at time t. S(t)f is the OSLDs count at 1 min., after the irradiation. Each data point is the average response of three individual dosimeters.

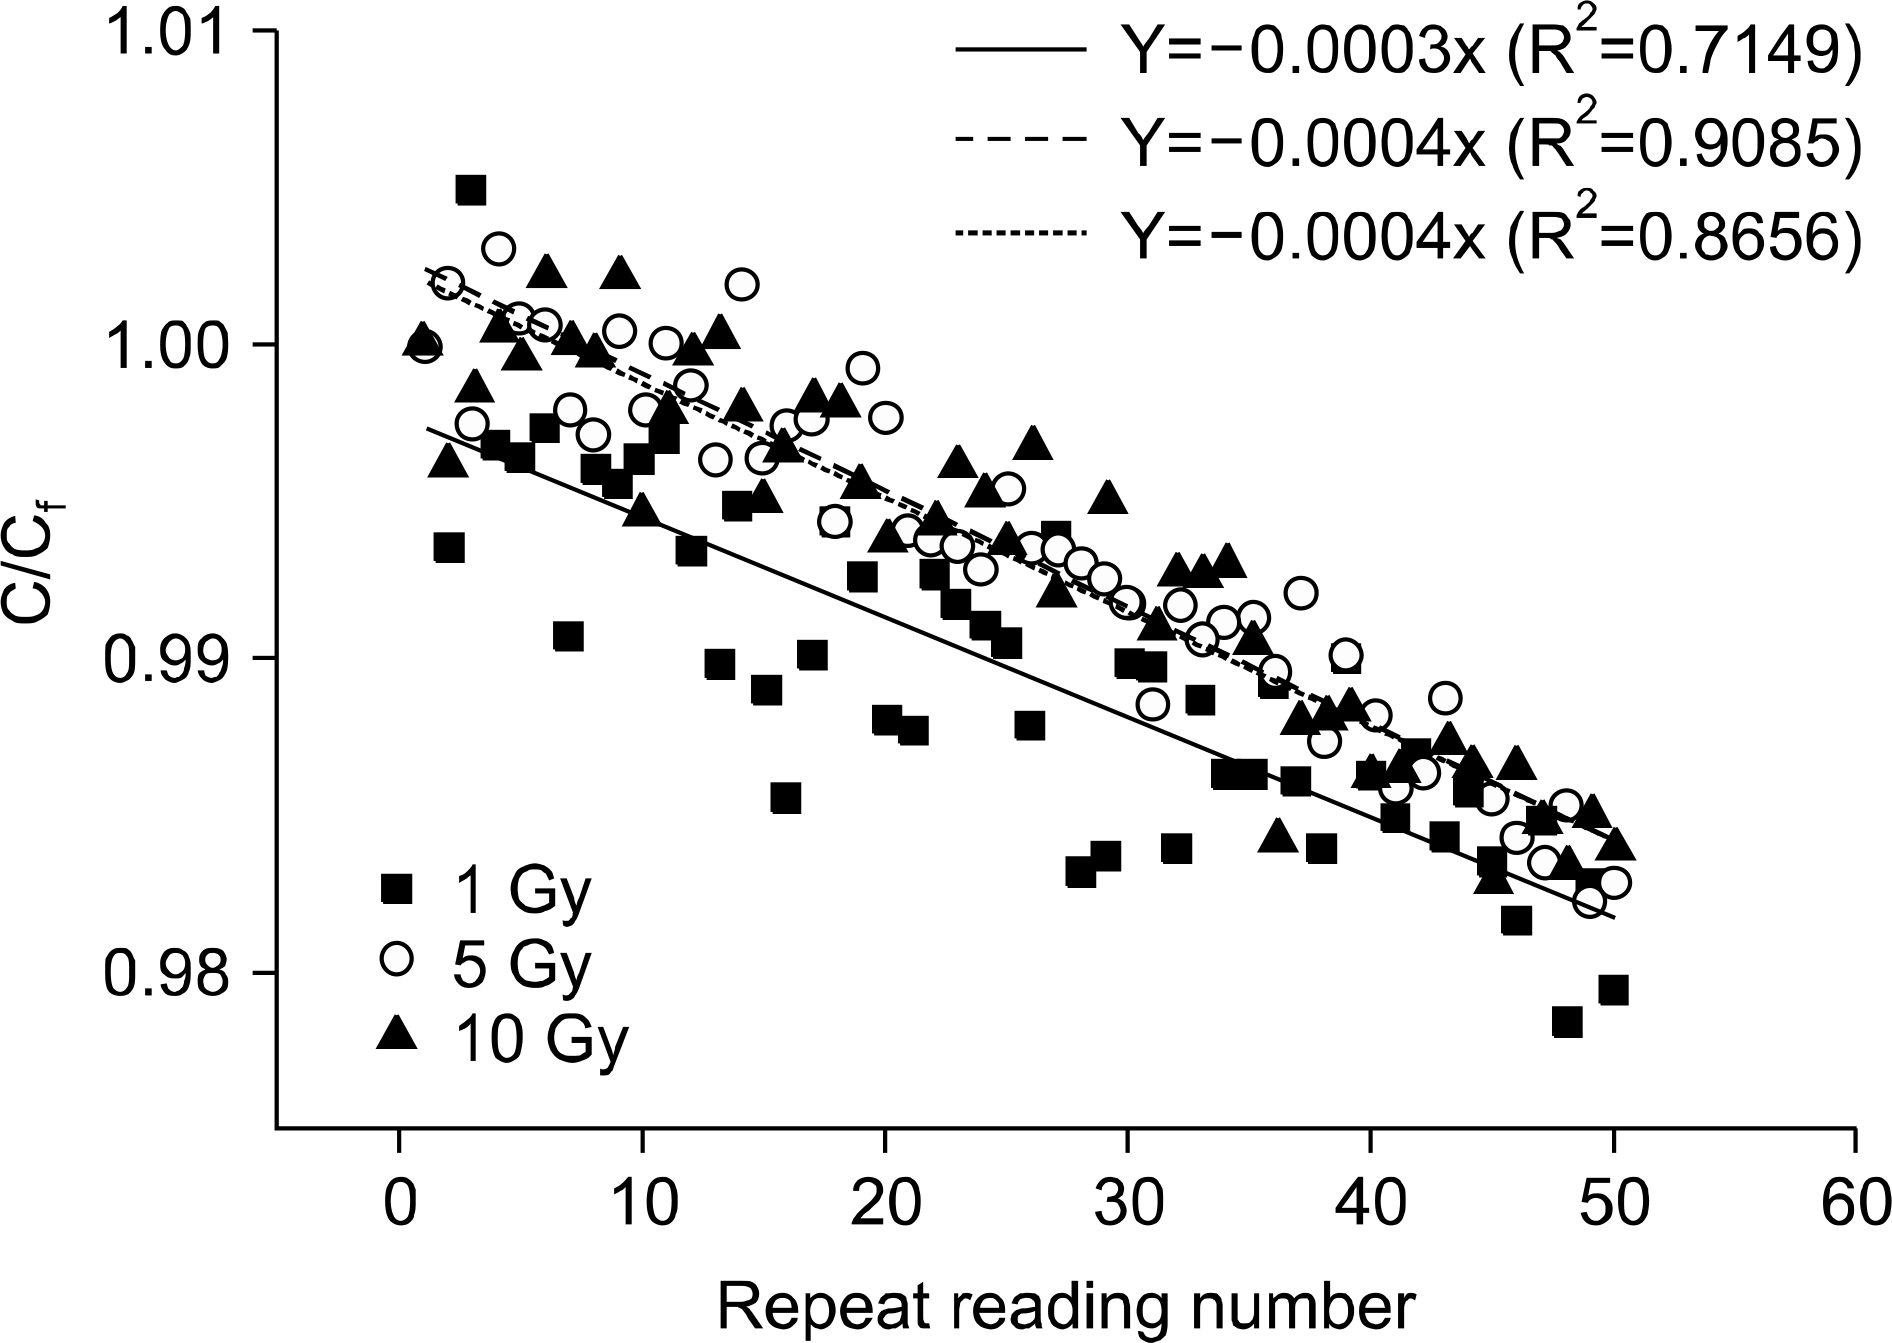
Fig. 2.
The depletion of OSLD count when given sequential readings after irradiating dose (1, 5, and 10 Gy) OSLDs were irradiated to 1, 5, and 10 Gy of 60-Co Gamma- ray and Kept in the dark for 11 min, After the dark period, the OSLDs was read 50 times. The OSLD counts were normalized to value of the first reading (Cf).

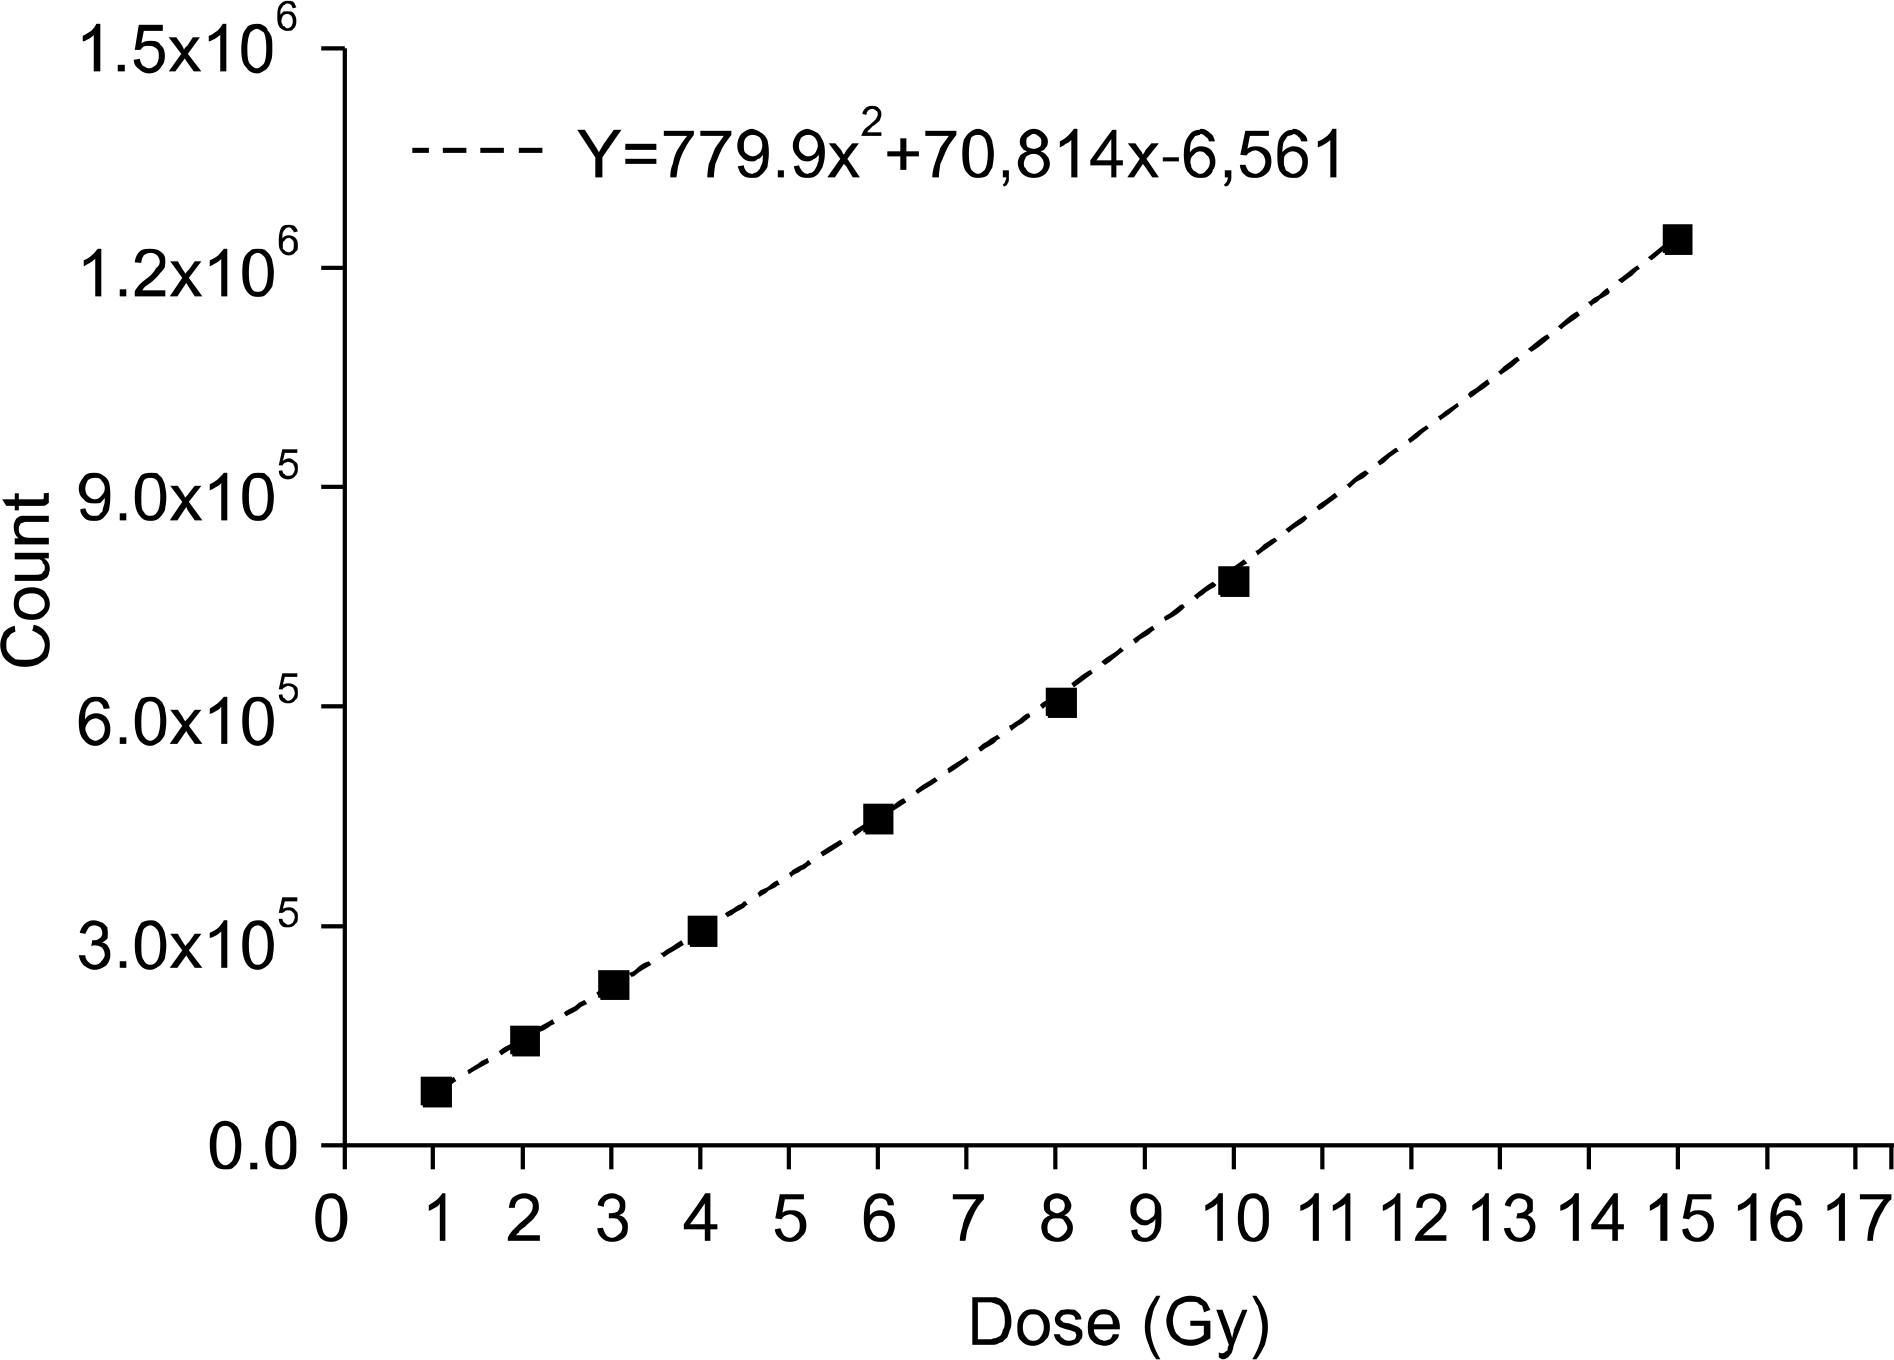
Fig. 3.
OSLD response (count) Vs dose. The dose response of the OSLD with the absorbed dose was measured using three dosimeters that was same group. The nanodot was not optically annealed between irradiation.

Table 1.
Comparison of batch homogeneity before and after sampling measurement.
| Before sampling | After sampling | |
|---|---|---|
| Average±S.D | 72648±3400 | 72648±841 |
| Range | From 63721 to 79336 | From 70889 to 74760 |
| Coefficient of variation (%) | 4.68 | 0.92 |
Table 2.
Analysis of the decay of the OSLD count after irradiating with dose (1, 5, and 10 Gy).
| Delivery dose | Factor about fitting equation (95% confidence bounds) | ||||
|---|---|---|---|---|---|
| A∗ | B∗ | K∗ | T1/2:0.693/k (min) | R2 | |
| 1 Gy | 0.739 (0.733∼0.745) | 0.702 (0.592∼0.825) | 1.014 (0.886∼1.140) | 0.683 (0.607∼0.781) | 0.993 |
| 5 Gy | 0.857 (0.851∼0.863) | 0.262 (0.207∼0.317) | 0.660 (0.507∼0.813) | 1.048 (0.851∼1.344) | 0.985 |
| 10 Gy | 0.900 (0.896∼0.903) | 0.178 (0.145∼0.210) | 0.626 (0.495∼0.757) | 1.105 (0.914∼1.390) | 0.988 |


 PDF
PDF ePub
ePub Citation
 Print
Print


 XML Download