Abstract
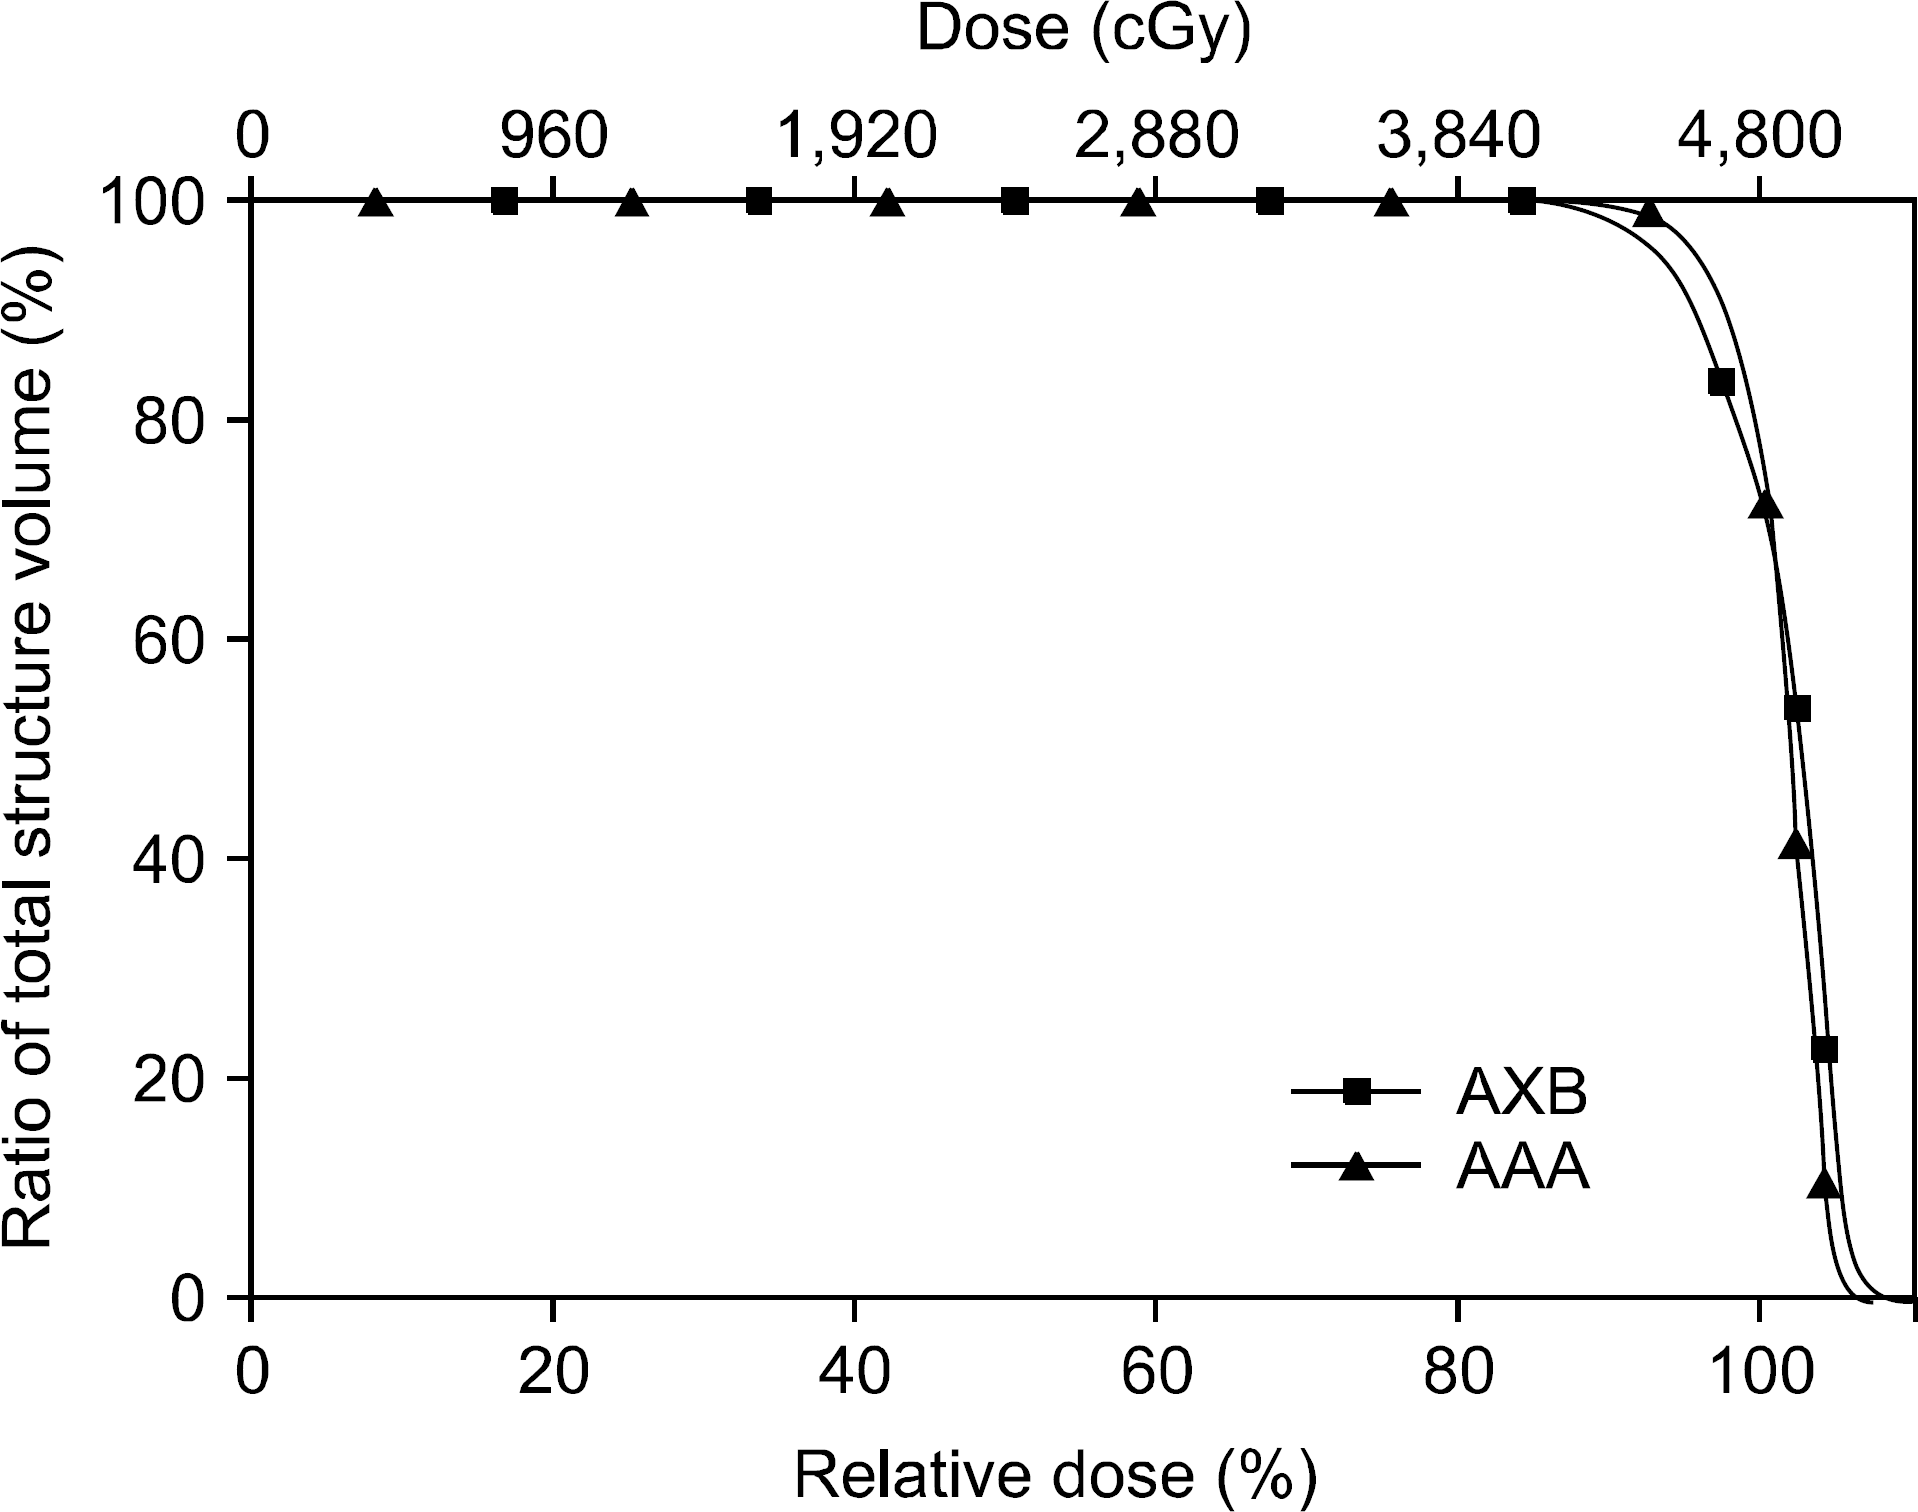
This study investigated the dosimetric effects of different dose calculation algorithm for lung stereotactic ablative radiotherapy (SABR) using flattening filter-free (FFF) beams. A total of 10 patients with lung cancer who were treated with SABR were evaluated. All treatment plans were created using an Acuros XB (AXB) of an Eclipse treatment planning system. An additional plans for comparison of different alagorithm recalcuated with anisotropic analytic algorithm (AAA) algorithm. To address both algorithms, the cumulative dose-volume histogram (DVH) was analyzed for the planning target volume (PTV) and organs at risk (OARs). Technical parameters, such as the computation times and total monitor units (MUs), were also evaluated. A comparison analysis of DVHs from these plans revealed the PTV for AXB estimated a higher maximum dose (5.2%) and lower minimum dose (4.2%) than that of the AAA. The highest dose difference observed 7.06% for the PTV V105%. The maximum dose to the lung was also slightly larger in the AXB plans. The percentate volumes of the ipsilateral lung (V5, V10, V20) receiving 5, 10, and 20 Gy were also larger in AXB plans than for AAA plans. However, these parameters were comparable between both AAA and AXB plans for the contralateral lung. The differences of the maximum dose for the spinal cord and heart were also small. The computation time of AXB plans was 13.7% shorter than that of AAA plans. The average MUs were 3.47% larger for AXB plans than for AAA plans. The results of this study suggest that AXB algorithm can provide advantages such as accurate dose calculations and reduced computation time in lung SABR plan using FFF beams, especially for volumetric modulated arc therapy technique.
References
1. Boyer AL and Schultheiss T. Effects of dosimetric and clinical uncertainty on complication-free local tumor control. Radiother Oncol. 11(1):65–71. 1988.
2. Park BD, Jung SH, Park S, et al. Comparison of dose distributions calculated by anisotropic analytical algorithm and pencil beam convolution algorithm at tumors located in liver dome site. Progress in Medical Physics. 23(2):106–113. 2012.
3. Robinson D. Inhomogeneity correction and the analytic anisotropic algorithm J Appl Clin Med Phys. 9(2):112–122. 2008.
4. Gagne IM and Zavgordoni S. Evaluation of the analytical anisotropic algorithm in an extreme water-lung interface phantom using Monte Carlo dose calculations. J Appl Clin Med Phys. 8(1):33–46. 2007.
5. Tillikainen L, Helminnen H, Torsti T, et al. A 3D pencil-beam-based superposition algorithm for photon dose calculation in heterogeneous media. Phys Med Biol. 53(14):3821–3839. 2008.

6. Vassiliev ON, Wareing TA, Davis IM, et al. Feasibility of a multigroup deterministic solution method for three-dimensional radiotherapy dose calculations.Int J Radiat Oncol Biol Phys. 72(1):220–227. 2008.
7. Vassiliev ON, Wareing TA, McGhee J, Failla G, Salehpour MR, Mourtada F. Validation of a new grid-based Boltzmann equation solver for dose calculation in radiotherapy with photon beams. Phys Med Biol. 55(3):581–598. 2010.

8. Gifford KA, Horton JL, Jr. , Wareing TA, Failla G, Mourtada F. Comparison of a finite-element multigroup discrete-ordinates code with Monte Carlo for radiotherapy calculations. Phys Med Biol. 51(9):2253–2265. 2006.

9. Han T, Mikell JK, Salehpour M, Mourtada F. Dosimetric comparison of Acuros XB deterministic radiation transport method with Monte Carlo and model-based convolution methods in heterogeneous media. Med Phys. 38(5):2651–2664. 2011.

10. Bush K, Gagne IM, Zavgorodni S, Ansbacher W, Beckham W. Dosimetric validation of Acuros XB with Monte Carlo methods for photon dose calculations Med Phys. 38(4):2208–2221. 2011.
11. Kan WK, Leung L, Yu P. Verification and dosimetric impact of Acuros XB algorithm on intensity modulated stereotactic radiotherapy for locally persistent nasopharyngeal carcinoma. Med Phys. 39(8):4705–4714. 2012.

12. Fogliata A, Nicolini G, Clivio A, Vanetti E, Cozzi L. Dosimetric evaluation of Acuros XB Advanced Dose Calculation algorithm in heterogeneous media. Radiation Oncology. 6:82. 2011.

13. Esch AV, Tillikainen L, Pyykkonen J, et al. Testing of the analytical anisotropic algorithm for photon dose calculation. Medical Physics Med Phys. 33(11):4130–4148. 2006.
14. Breitman K, Rathee S, Newcomb C, et al. Experimental Validation of the Eclipse AAA Algorithm. J Appl Clin Med Phys. 8(2):76–92. 2007.

15. Fogliata A, Vanetti E, Albers D, et al. On the dosimetric behaviour of photon dose calculation algorithms in the presence of simple geometric heterogeneities: comparison with Monte Carlo calculations. Phys Med Biol. 52(5):1363–1385. 2007.

16. Han T, Mourtada F, Kisling K, et al. Experimental validation of deterministic Acuros XB algorithm for IMRT and VMAT dose calculations with the Radiological Physics Center's head and neck phantom. Med Phys. 39(4):2193–2202. 2012.

17. Teh B, Mai WY, Uhl BM, et al. Intensity-modulated radiation therapy for prostate cancer with the use of a rectal balloon for prostate immobilization: acute toxicity and dose-volume analysis. Int J Radiat Oncol Biol Phys. 49(3):705–712. 2001.
18. Kim JS, Chung JB, Kim IA, Eom KY. Dosimetric effects of endorectal balloons on intensitymodulated radation therapy plans for prostate cancer. J Korean Phys Soc. 63(8):1637–1643. 2013.
19. Stanley J, Breitman K, Dunscombe P, Spencer D, Lau H. Evaluation of stereotactic radiosurgery conformity indices for 170 target volumes in patients with brain metastases. J Appl Clin Med Phys. 12(2):245–253. 2011.

20. Yoon M, Park SY, Shin D, et al. A new homogeneity index based on statistical analysis of the dose-volume histogram. J Appl Clin Med Phys. 8(2):9–17. 2007.

21. Hinnen KA, Monninkhof EM, Battermann JJ, et al. Prostate specific antigen bounce is related to overall survival in prostate brachytherapy. Int J Radiat Oncol Biol Phys. 82(2):883. 2012.

22. Leung L, Kan M, Cheng A, et al. A new dose-volume-based plan quality index for IMRT plan comparion. Radiother Oncol. 85(3):407–417. 2007.
23. Scorsetti M, Alongi F, Castiglioni S, et al. Feasibility and early clinical assessment of flattening filter free (FFF) based stereotactic body radiotherapy (SBRT) treatments. RadiationOncology. 6:113. 2011.

24. Purdie TG, Bissonnette JP. Franks K, et al: Cone-beam computed tomography for online image guidance of lung stereotactic radiotherapy: localization, verification, and intrafraction tumor position. Int J Radiat Oncol Biol Phys. 68(1):243–252. 2007.
25. Hoogeman MS, Nuyttens JJ, Levendag PC, Heijmen BJ. Time dependence of intrafraction patient motion assessed by repeat stereoscopic imaging. Int J Radiat Oncol Biol Phys. 70(2):609–0618. 2008.

26. Vassiliev ON, Kry SF, Chang JY, et al. Stereotactic radiotherapy for lung cancer using a flattening filter free Clinac. J Appl Clin Med Phys. 10(1):14–21. 2009.

27. Mancosu P, Castiglioni S, Reggiori G, et al. Stereotactic body radiation therapy for liver tumours using flattening filter free beam: dosimetric and technical considerations. Radiation Oncology. 7:16. 2012.

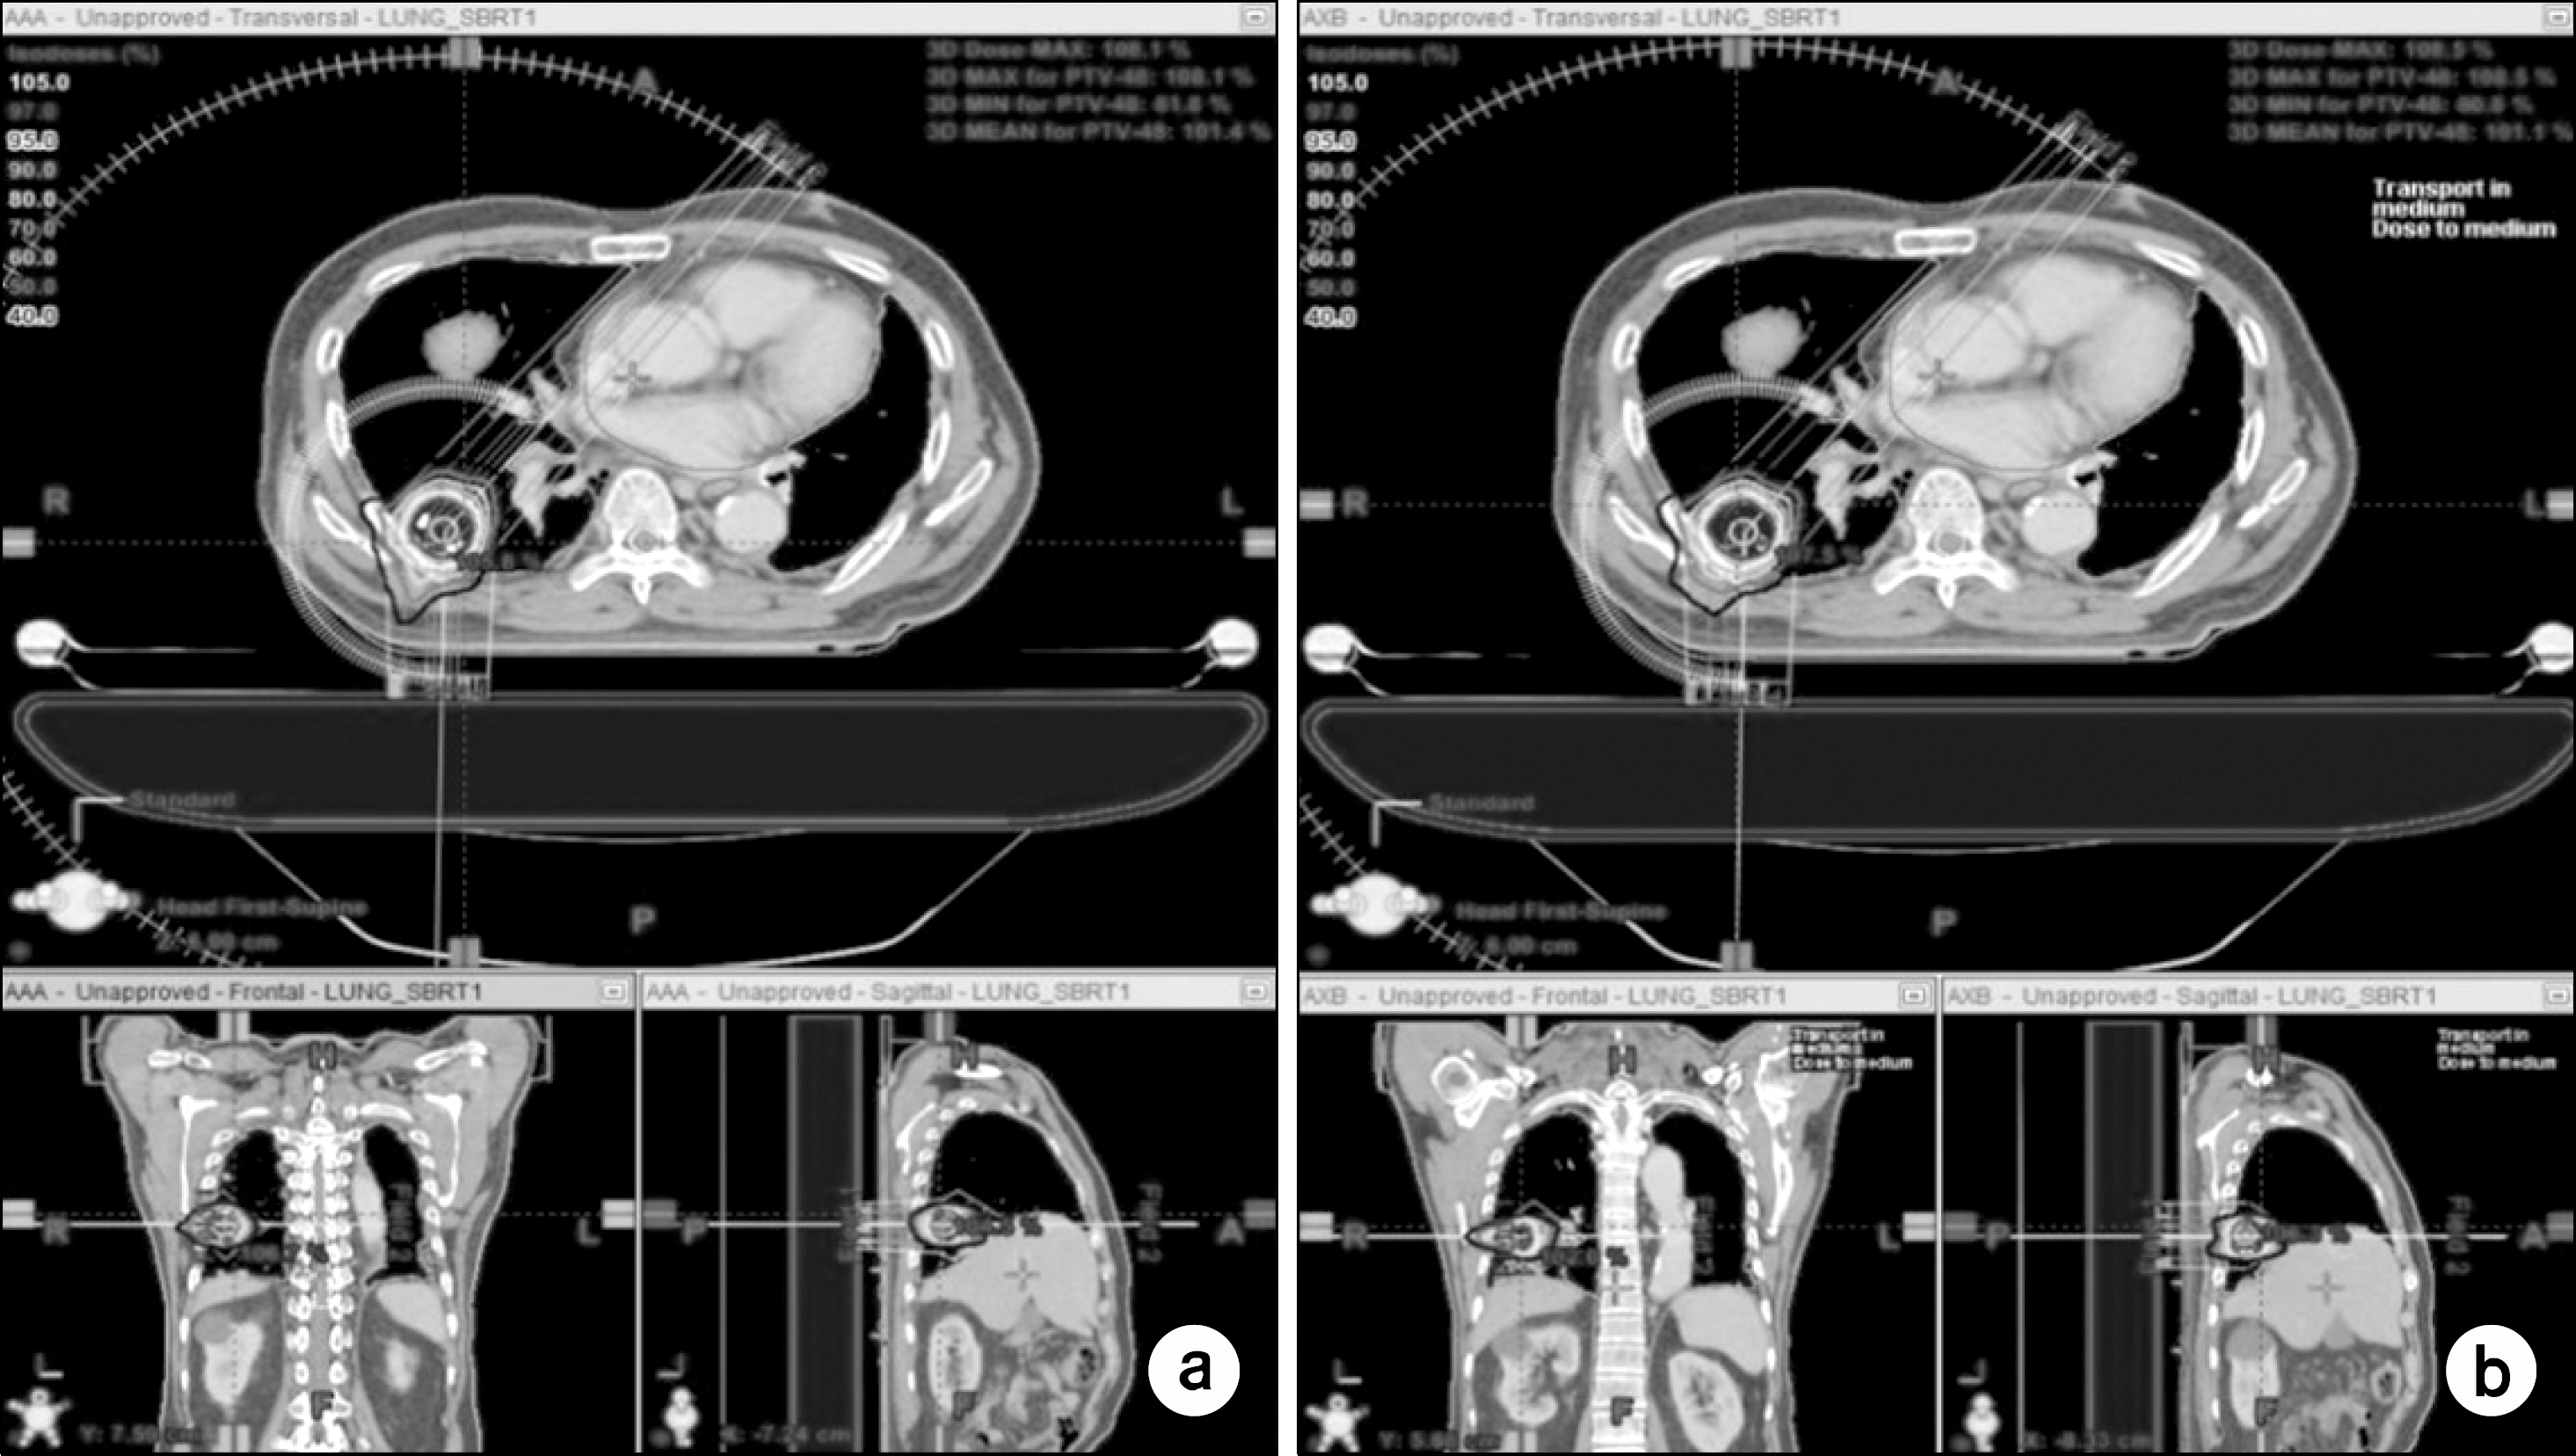
Fig. 1.
An example of dose distribution between AAA (a) and AXB (b) plan for PTV when 48 Gy was prescribed at the isoceneter.

Table 1.
Target coverage, homogeneity, and conformity in lung SABR plans between the AAA and AXB.
Table 2.
Comparison of OARs dosimetric data in lung SABR plans between the AAA and AXB.
Table 3.
The average computation time of AAA and AXB for 10 lung SABR plans using VMAT technique.
| AXB(Mean±SD) | AAA Rel(Mean±SD) | Rlative difference (%)(XB−AAA)/AAA×100 | |
|---|---|---|---|
| Time (Sec) | 529.5±49.4 | 4 613.9±76.5 | −13.7 |
Table 4.
The percentage difference of total MUs in the two different calculation algorithms.


 PDF
PDF ePub
ePub Citation
 Print
Print


 XML Download