

 PDF
PDF ePub
ePub Citation
 Print
Print


Abstract
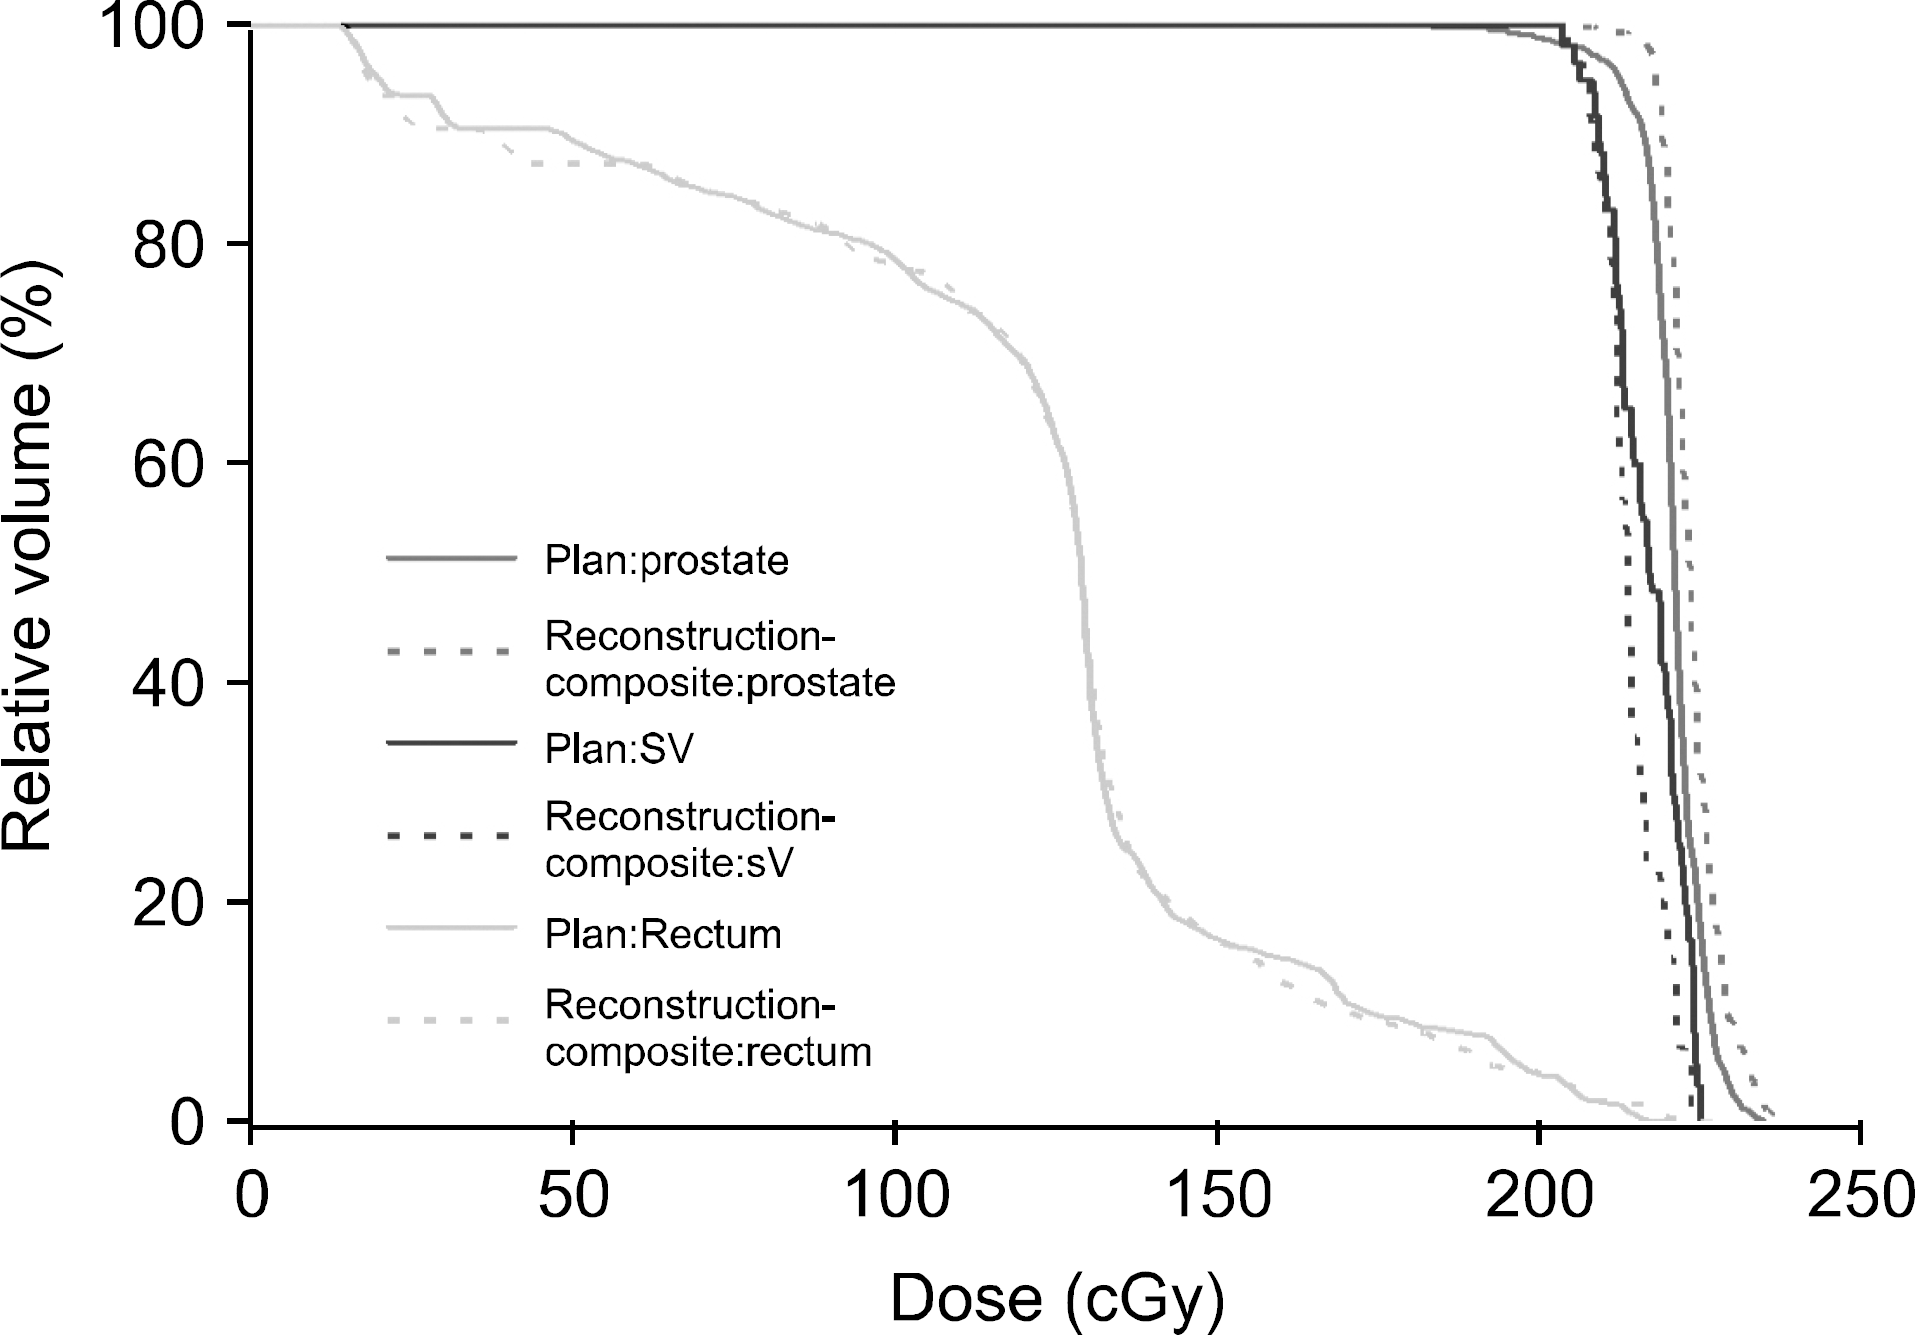
The purpose of this study was to develop a system of clinical application of reconstructed dose that includes dose reconstruction, reconstructed dose registration between fractions of treatment, and dose-volume-histogram generation and to demonstrate the system on a deformable prostate phantom. To achieve this purpose, a deformable prostate phantom was embedded into a 20 cm-deep and 40 cm-wide water phantom. The phantom was CT scanned and the anatomical models of prostate, seminal vesicles, and rectum were contoured. A coplanar 4-field intensity modulated radiation therapy (IMRT) plan was used for this study. Organ deformation was simulated by inserting a “transrectal” balloon containing 20 ml of water. A new CT scan was obtained and the deformed structures were contoured. Dose responses in phantoms and electronic portal imaging device (EPID) were calculated by using the XVMC Monte Carlo code. The IMRT plan was delivered to the two phantoms and integrated EPID images were respectively acquired. Dose reconstruction was performed on these images using the calculated responses. The deformed phantom was registered to the original phantom using an in-house developed software based on the Demons algorithm. The transfer matrix for each voxel was obtained and used to correlate the two sets of the reconstructed dose to generate a cumulative reconstructed dose on the original phantom. Forwardly calculated planning dose in the original phantom was compared to the cumulative reconstructed dose from EPID in the original phantom. The prescribed 200 cGy isodose lines showed little difference with respect to the “prostate” and “seminal vesicles”, but appreciable difference (3%) was observed at the dose level greater than 210 cGy. In the rectum, the reconstructed dose showed lower volume coverage by a few percent than the plan dose in the dose range of 150 to 200 cGy. Through this study, the system of clinical application of reconstructed dose was successfully developed and demonstrated. The organ deformation simulated in this study resulted in small but observable dose changes in the target and critical structure.
References
1. Mijnheer B, Beddar S, Izewska J, Reft C. In vivo dosimetry in external beam radiotherapy. Med Phy. 40(7):070903. 2013.

2. Yeo IJ, Jung JW, Yi BY, Kim JO. Feasibility study on inverse four-dimensional dose reconstruction using the continuous doseimage of EPID. Med Phys. 40(5):051702. 2013.
3. Yeo IJ, Jung JW, Chew M, et al. Dose reconstruction for intensitymodulated radiation therapy using a non-iterative method and portal dose image. Phys Med Biol. 54(17):5223–36. 2009.
4. Jung JW, Kim JO, Yeo IJ, et al. Fast transit portal dosimetry using density-scaled layer modeling of aSi-based electronic portal imaging device and Monte Carlo method. Med Phys. 39(12):7593–602. 2012.
5. Elmpt W van. Nijsten S, Petit S, et al. 3D in vivo dosimetry using megavoltage cone-beam CT and EPID dosimetry. Int J Radiat Oncol Biol Phys. 73(5):1580–7. 2009.
6. Spezi E, Lewis DG. Full forward Monte Carlo calculation of portal dose from MLC collimated treatment beams. Phys Med Biol. 47(3):377–90. 2002.
7. Partridge M, Ebert M, Hesse B-M: IMRT verification by three-dimensional dose reconstruction from portal beam measurements. Med Phy. 29(8):1847. 2002.
8. Fippel M. Fast Monte Carlo dose calculation for photon beams based on the VMC electron algorithm. Med Phys. 26(8):1466–75. 1999.
9. Thirion JP. Image matching as a diffusion process: an analogy with Maxwell's demons. 2(3):243–260. 2004.
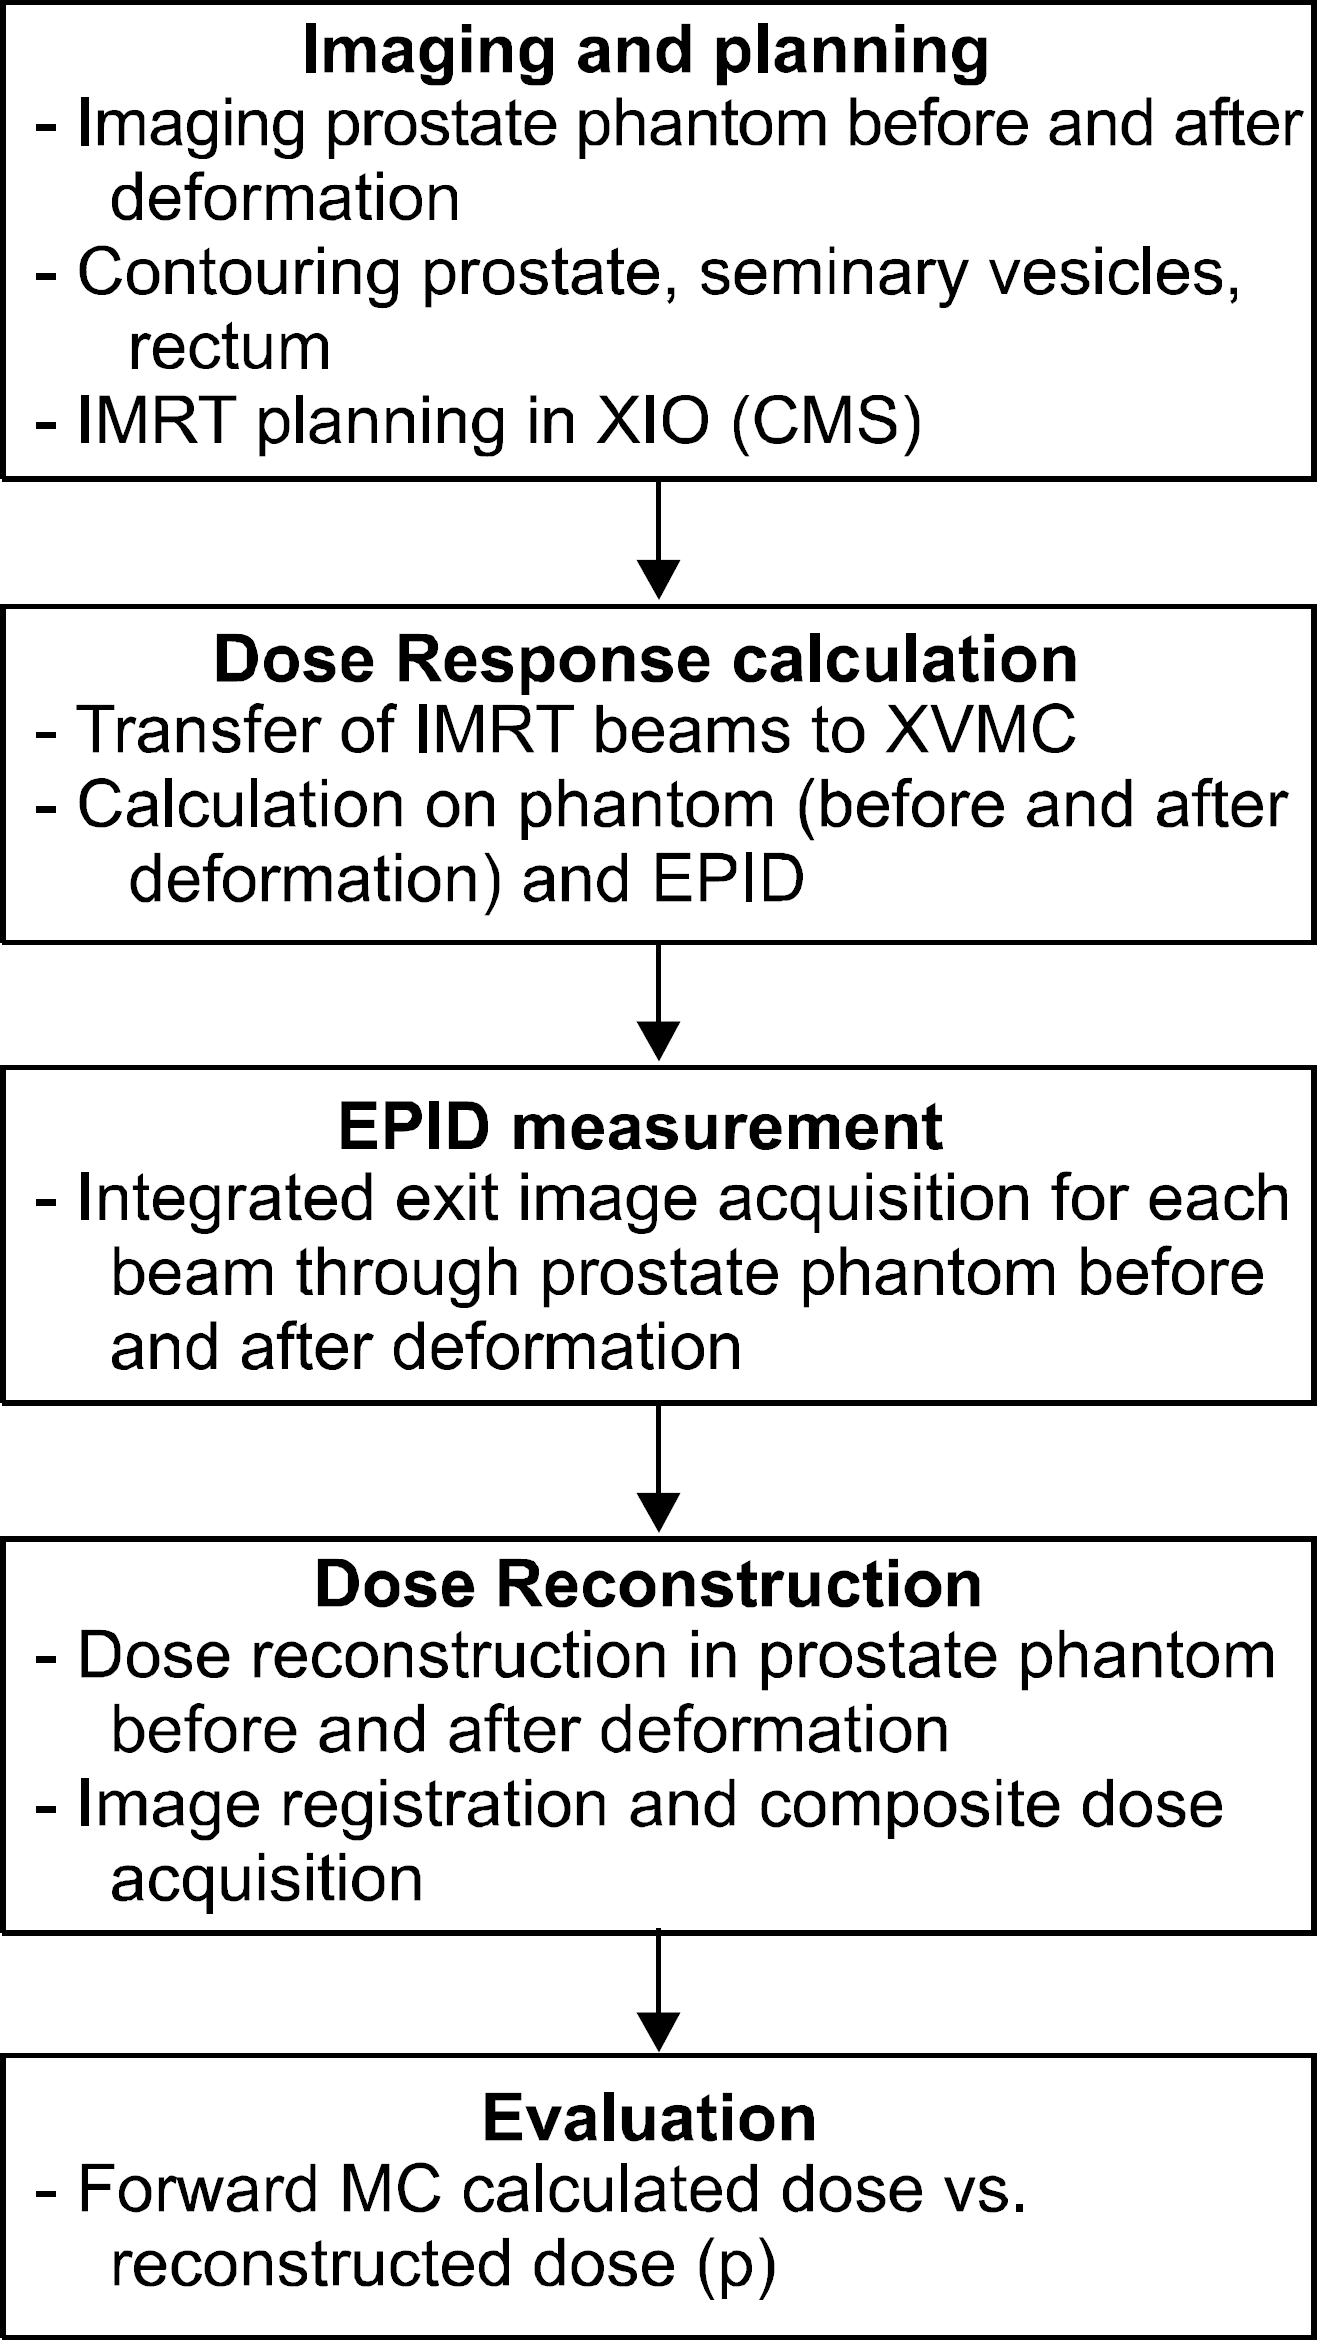
Fig. 2.
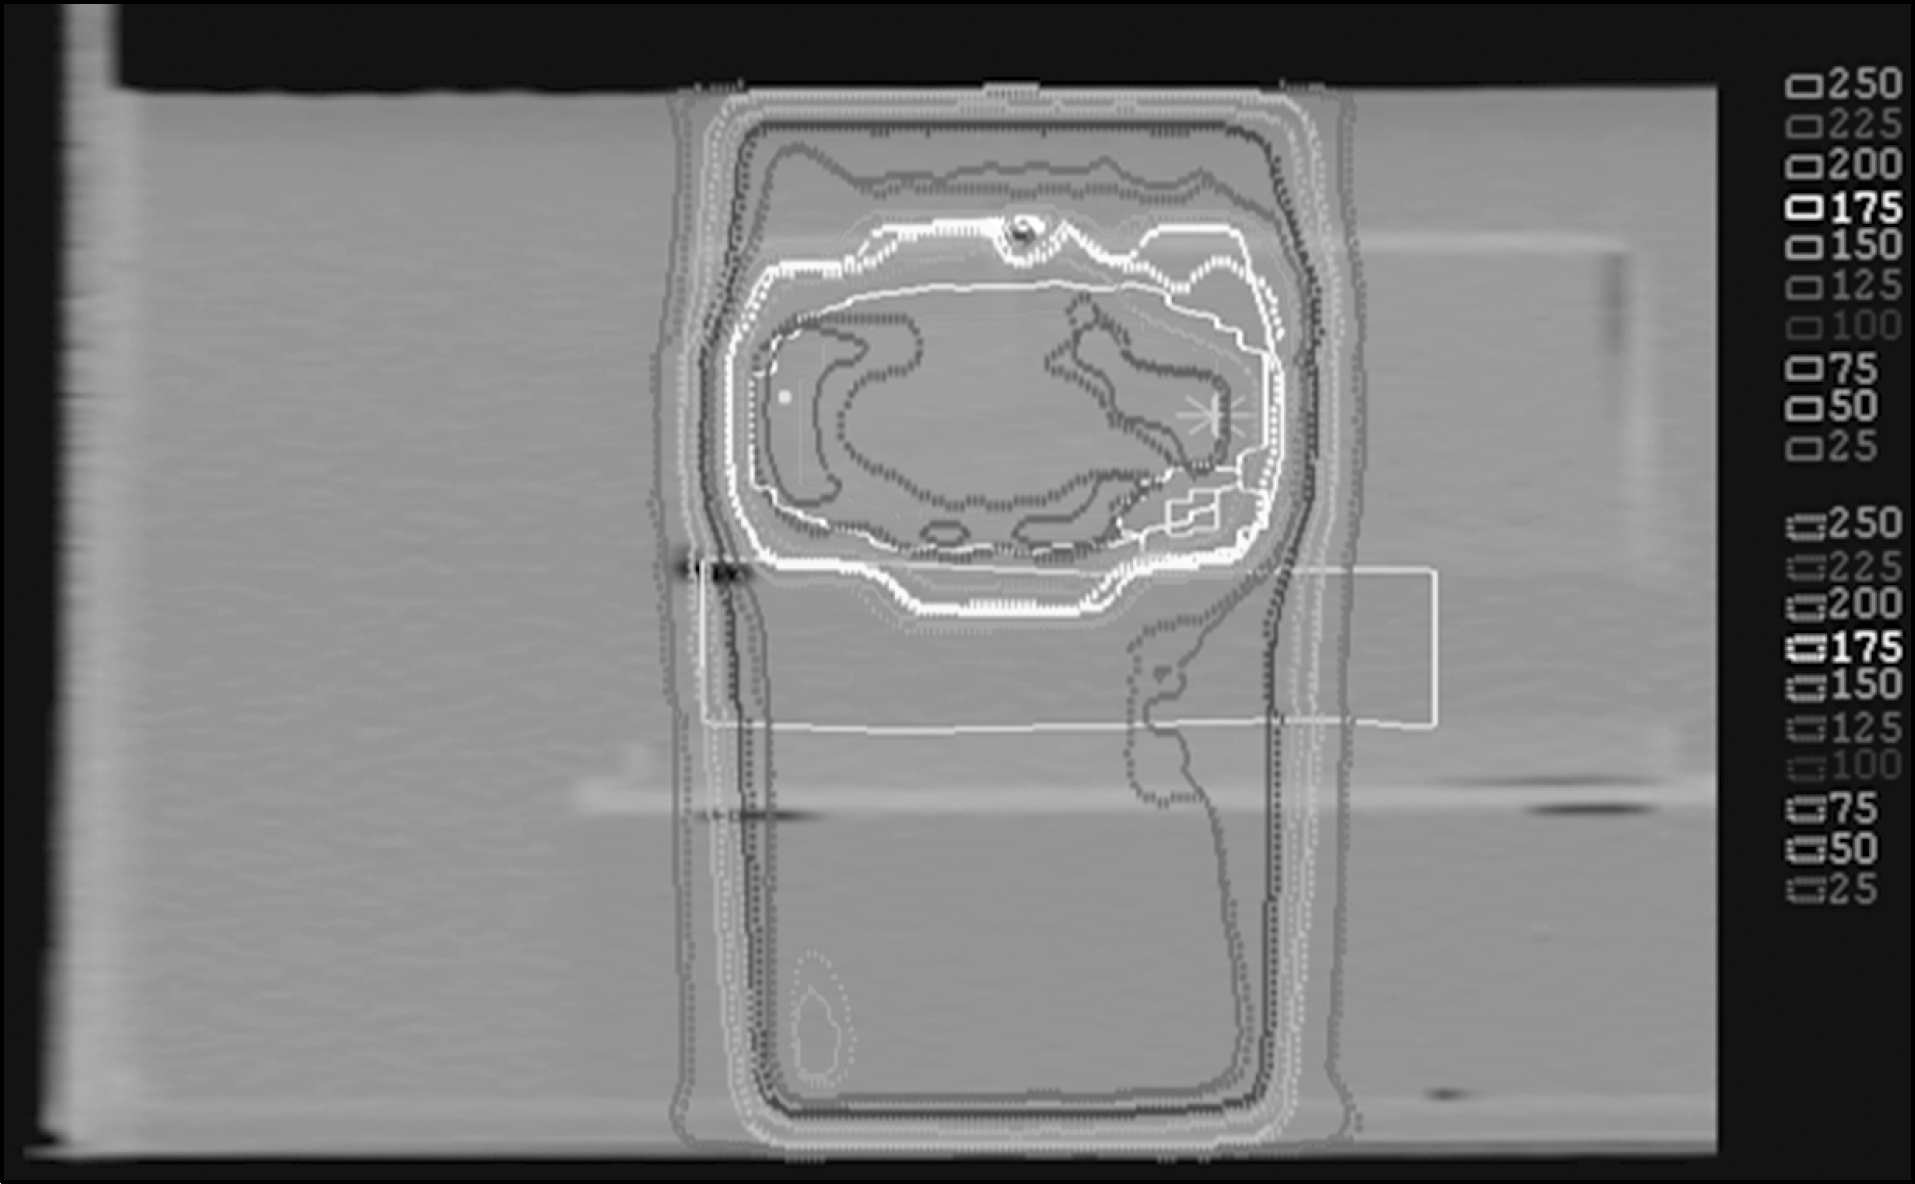
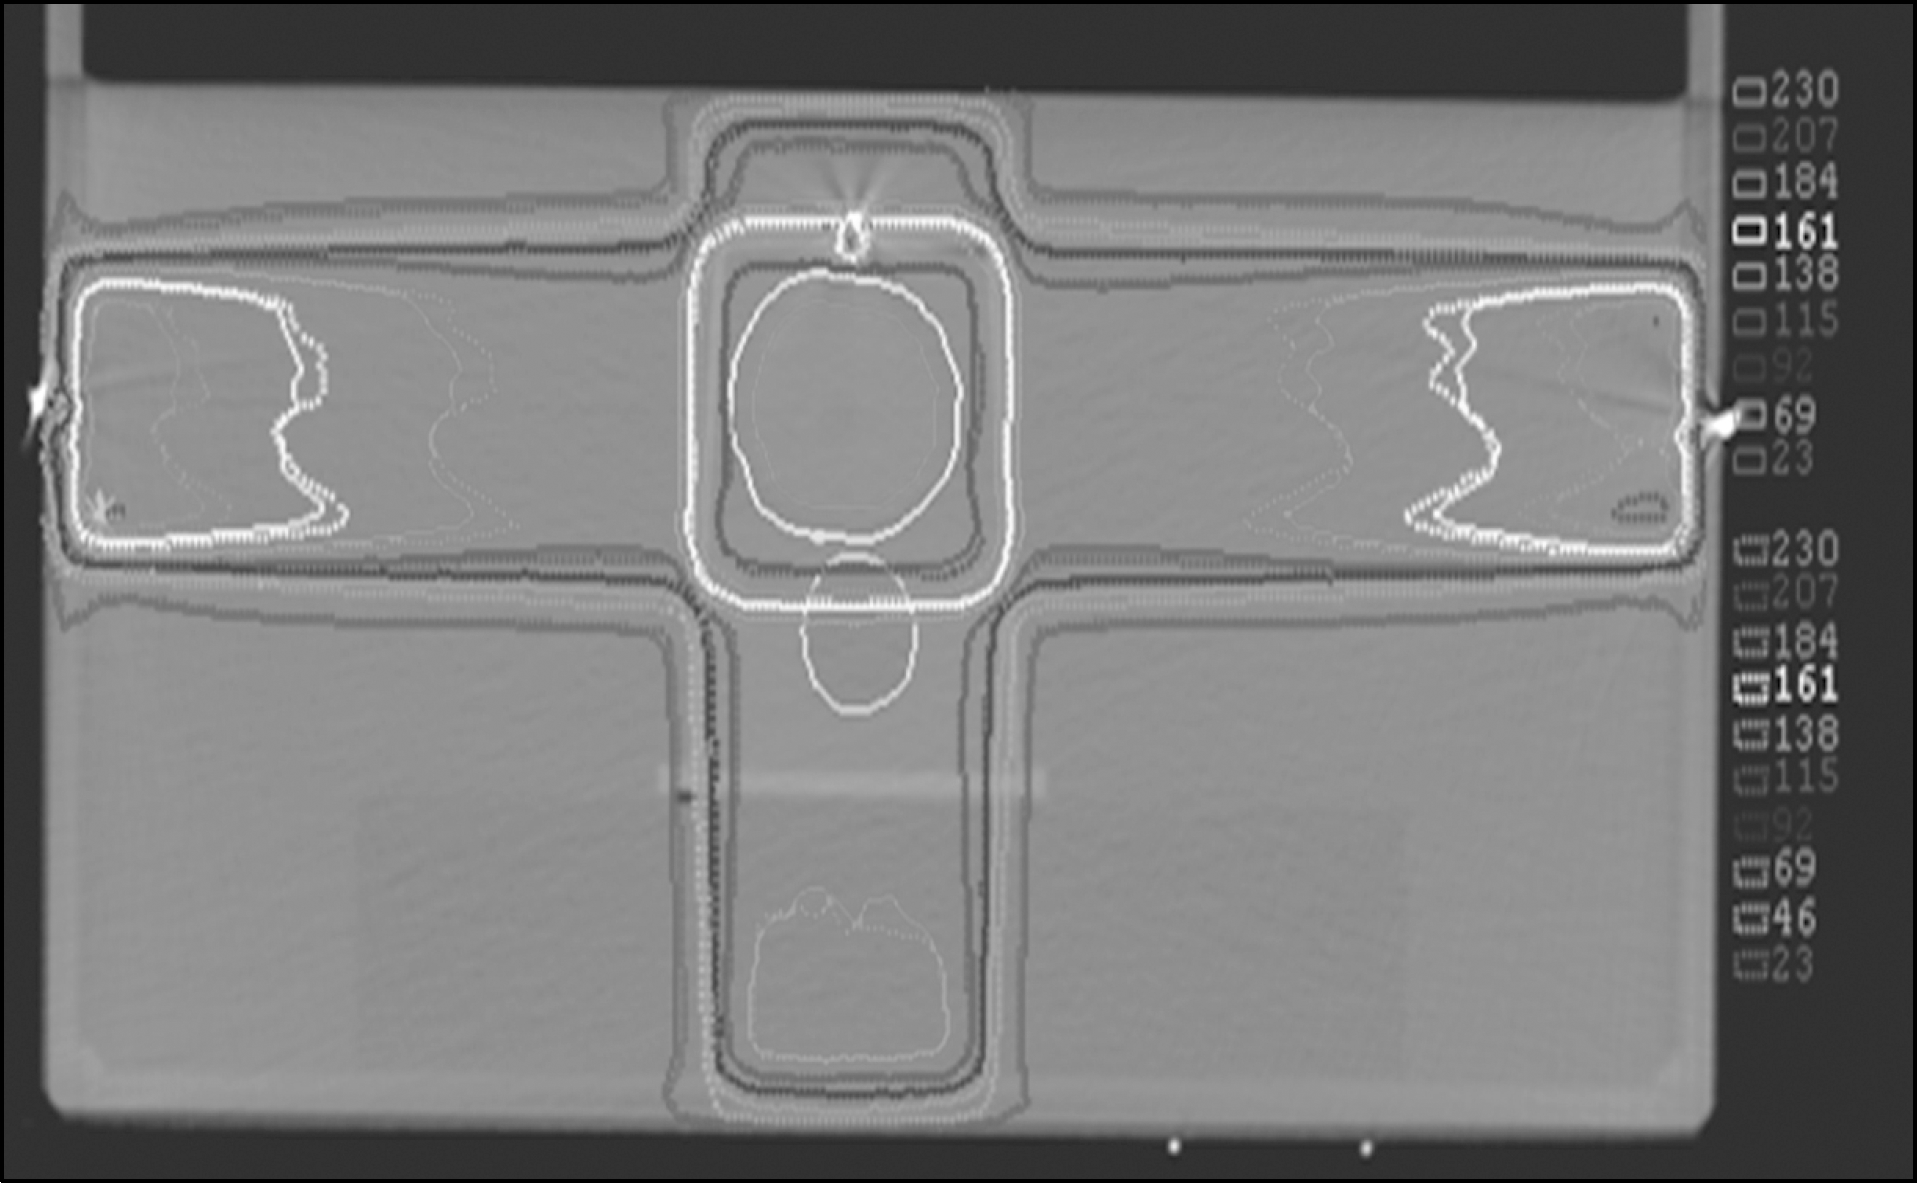
Isodose comparison between plan (solid) and reconstruction (dashed) on the isocentric sagittal plane. Various isodose lines (legends on the righthand side) are plotted. The prostate is contoured in red color; the prostate PTV in white color; the SV PTV in green color; the rectum in cyan color.
 XML Download