Abstract
Image quality of computed tomography (CT) is very vulnerable to metal artifacts. Recently, the thickness and background normalization techniques have been introduced. Since they provide flat sinograms, it is easy to determine metal traces and a simple linear interpolation would be enough to describe the missing data in sinograms. In this study, we have developed a theory describing two normalization methods and compared two methods with respect to various sizes and numbers of metal inserts by using simple numerical simulations. The developed theory showed that the background normalization provide flatter sinograms than the thickness normalization, which was validated with the simulation results. Numerical simulation results with respect to various sizes and numbers of metal inserts showed that the background normalization was better than the thickness normalization for metal artifact corrections. Although the residual artifacts still existed, we have showed that the background normalization without the segmentation procedure was better than the thickness normalization for metal artifact corrections. Since the background normalization without the segmentation procedure is simple and it does not require any users' intervention, it can be readily installed in conventional CT systems.
Go to : 
REFERENCES
1. Parker RP, Hobday PA, Cassell KJ. The direct use of CT numbers in radiotherapy dosage calculations for inhomogeneous media. Phys Med Biol. 24(4):802–809. 1979.

2. Guerrero ME, Jacobs R, Loubele M, et al. State-ofthe- art on cone beam CT imaging for preoperative planning of implant placement. Clin Oral Invest. 10(1):1–7. 2006.
3. Cho MK, Kim HK, Youn H, Kim SS. A feasibility study of digital tomosynthesis for volumetric dental imaging. J Instrum. 7(3):P03007. 2012.

4. Glover GH, Pelc NJ. An algorithm for the reduction of metal clip artifacts in CT reconstructions. Med Phys. 8(6):799–807. 1981.

5. Kalender WA, Hebel R, Ebersberger J. Reduction of CT artifacts caused by metallic implants. Radiology. 164(2):576–577. 1987.

6. Wang G, Snyder DL, O'Sullivan JA, et al. Iterative deblurring for CT metal artifact reduction. IEEE Trans Med Imaging. 15(5):657–664. 1996.
7. De Man B, Nuyts J, Dupont P, et al. An iterative maximum- likelihood polychromatic algorithm for CT. IEEE Trans Med Imaging. 20(10):999–1008. 2001.
8. Kachelrieβ M, Watzke O, Kalender WA. Generalized multi-dimensional adaptive filtering for conventional and spiral single-slice, multislice, and cone-beam CT. Med Phys. 28(4):475–490. 2001.
9. Nuyts J, De Man B, Fessler JA, et al. Modelling the physics in the iterative reconstruction for transmission computed tomography. Phys Med Biol. 58(12):R63–R96. 2013.

10. Park JC, Song B, Kim JS, et al. Fast compressed sensing- based CBCT reconstruction using Barzilai-Borwein formulation for application to online IGRT. Med Phys. 39:1207–1217. 2012.
11. Choi J, Kim KS, Kim MW, et al. Sparsity driven metal part reconstruction for artifact removal in dental CT. J X-ray Sci Tech. 19(4):457–475. 2011.

12. Müller J, Buzug TM. Spurious structures created by interpolation- based CT metal artifact reduction. Proc SPIE. 7258:72581Y(8pp). 2009.
13. Müller J, Buzug TM. Intersection Line Length Normalization in CT Projection Data. Bildverarbeitung fur die Medizin;Berlin: 2008. p. 77–81.
14. Meyer E, Raupach R, Lell M, Schmidt B, Kachelrieβ M. Normalized metal artifact reduction (NMAR) in computed tomography. Med Phys. 37(10):5482–5493. 2010.

15. Jain AK. Fundamentals of Digital Image Processing. Prentice-Hall Inc;Englewood Cliffs, NJ: 1989. ), pp.p. 438–439.
16. Otsu N. A threshold selection method from gray-level histograms. IEEE Trans Syst Man Cybern. 9(1):62–66. 1979.

17. Sezgin M, Sankur B. Survey over image thresholding techniques and quantitative performance evaluation. J Electron Imaging. 13(1):146–165. 2004.
Go to : 
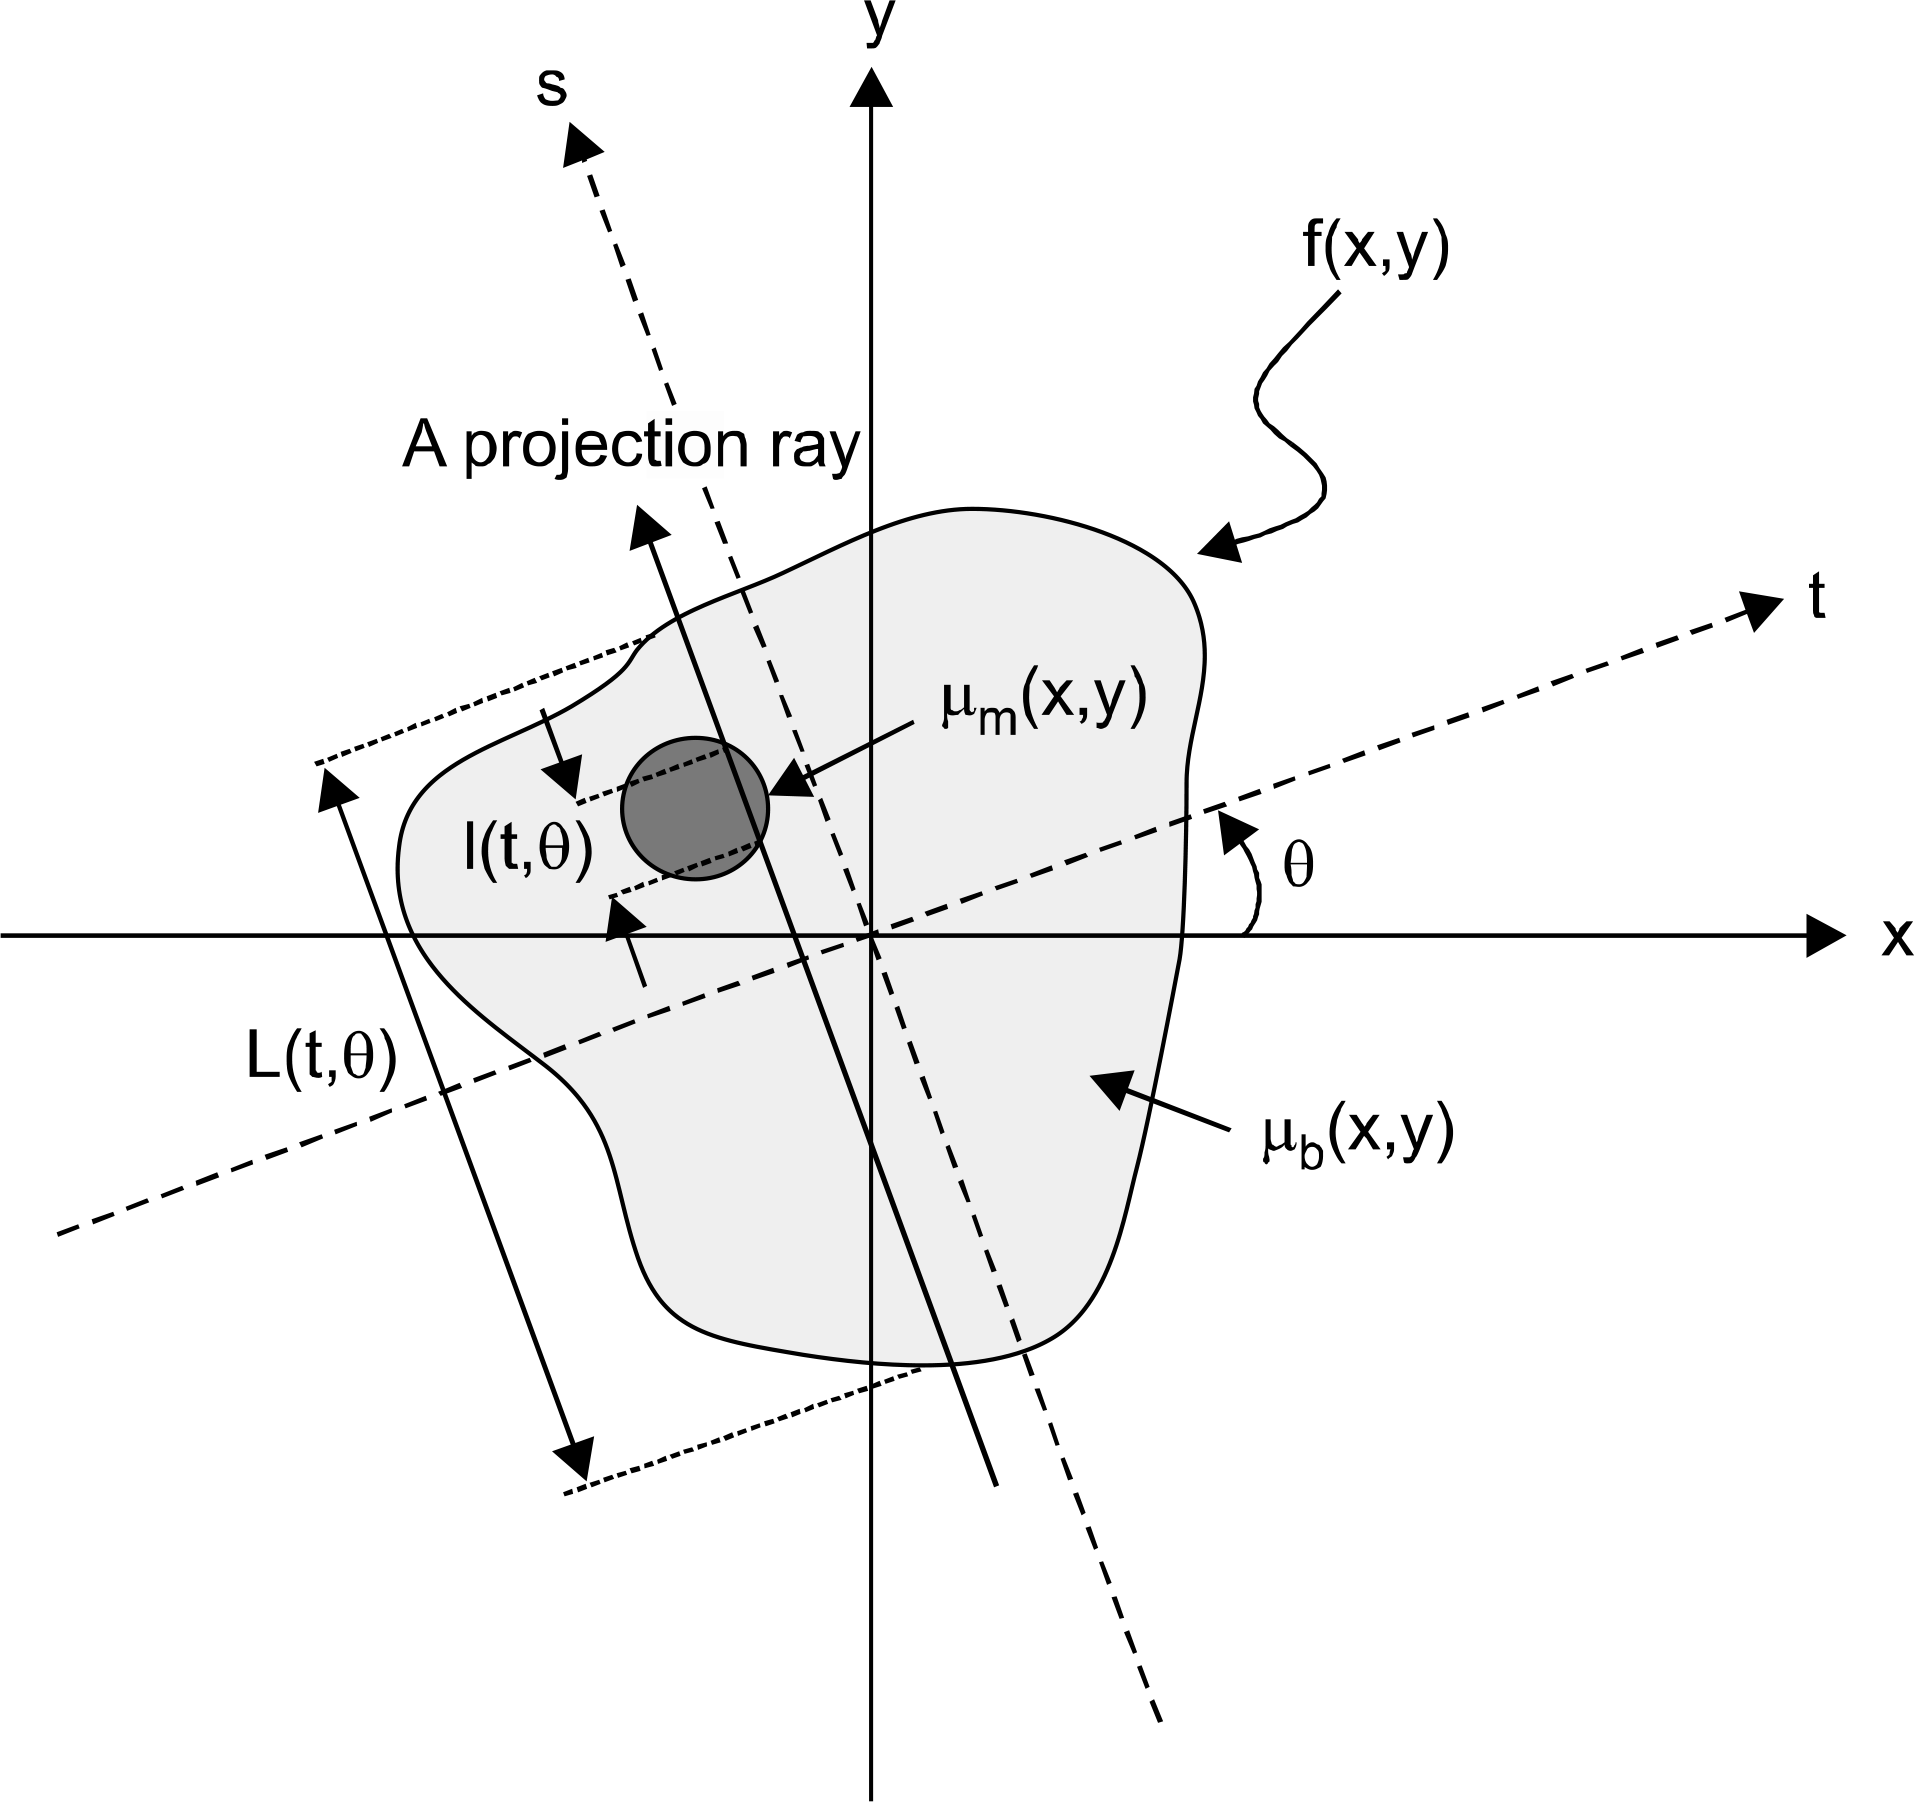 | Fig. 1.Sketch describing the projection of an object f(x, y) containing a circular metal insert by a single ray at a projection angle θ. The lengths intersected by the ray with the object and the metal insert are L(t,θ) and l(t,θ), respectively. |
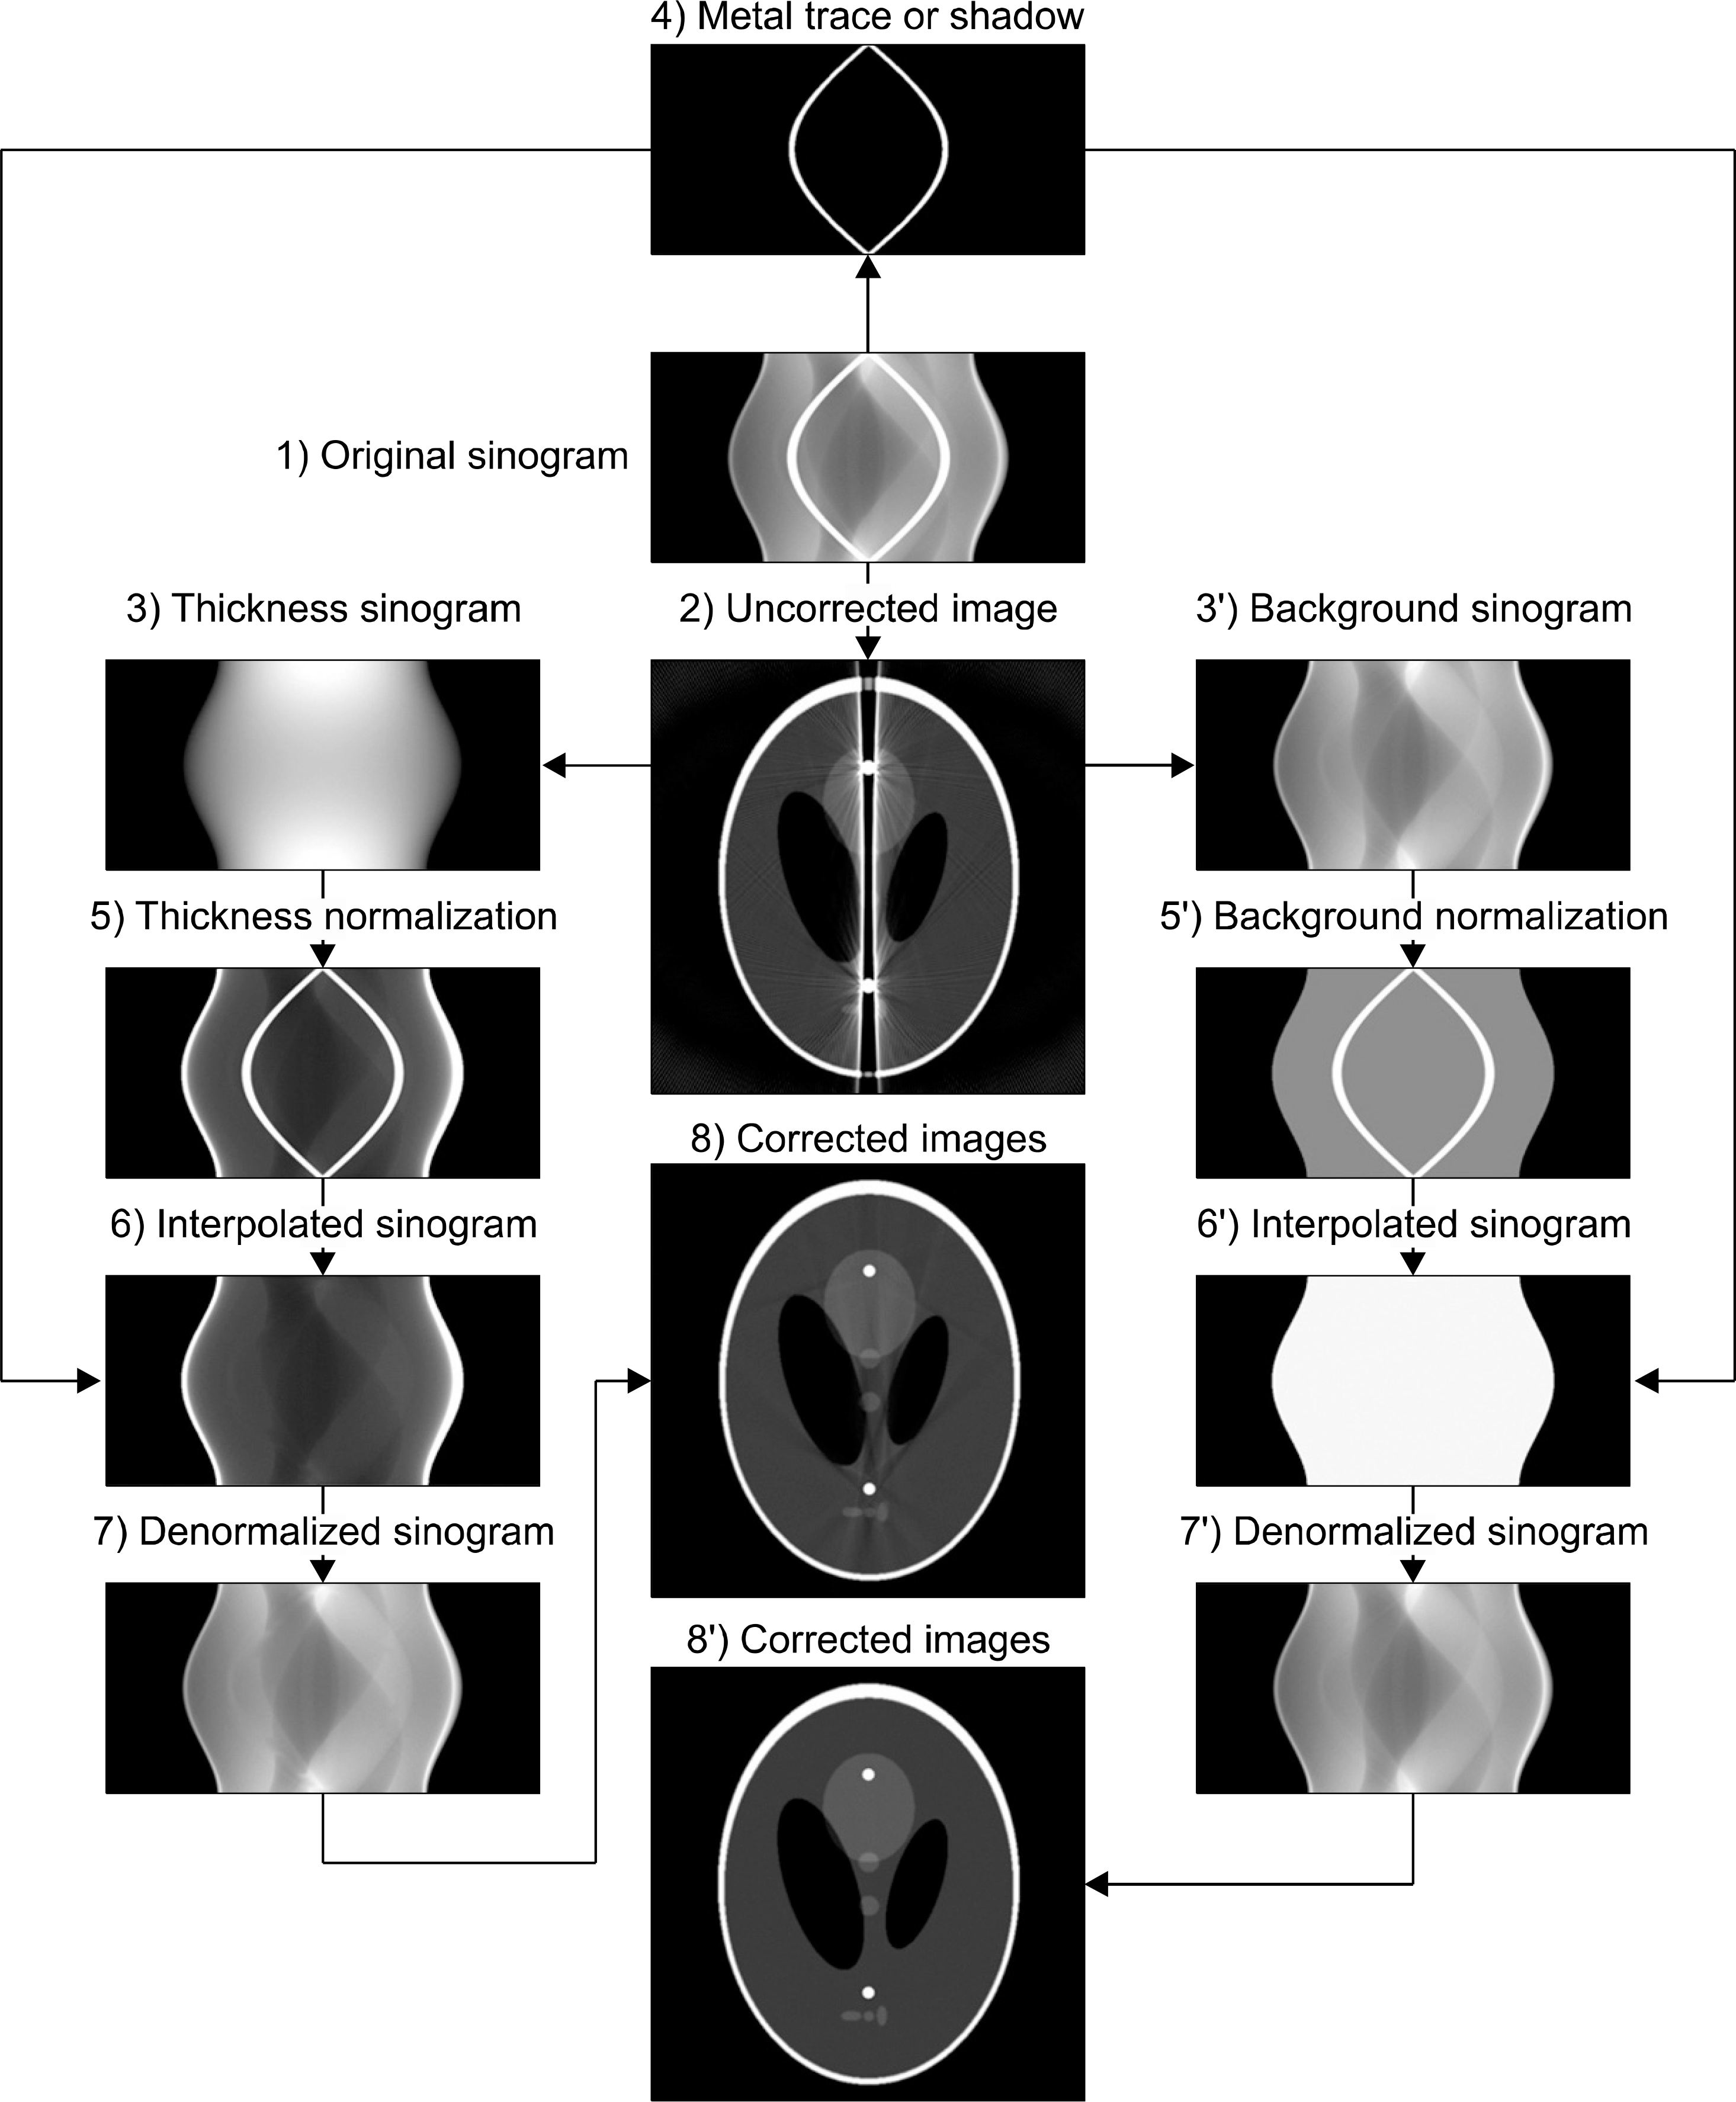 | Fig. 2.Illustration of the metal artifact reduction algorithm based on the thickness and background normalizations. 1) Generation of a sinogram from the CT scan. 2) Image reconstruction using the sinogram 1). Generation of sinograms 3) and 3') by forward-projecting the uncorrected image after replacing its internal components by air and redefining the internal components, except the metal insert, by the segmentation procedure, respectively. 4) Extraction of metal traces from the original sinogram. Generation of normalized sinograms 5) and 5') dividing 1) by 3) and 3'), respectively. Interpolated sinograms 6) and 6') by applying the linear interpolation to 5) and 5'), respectively, with the known metal traces. Generation of corrected sinograms 7) and 7') by multiplying 6) and 6') by 3) and 3'), respectively (the denormalization procedure). Generation of corrected images 8) and 8'). |
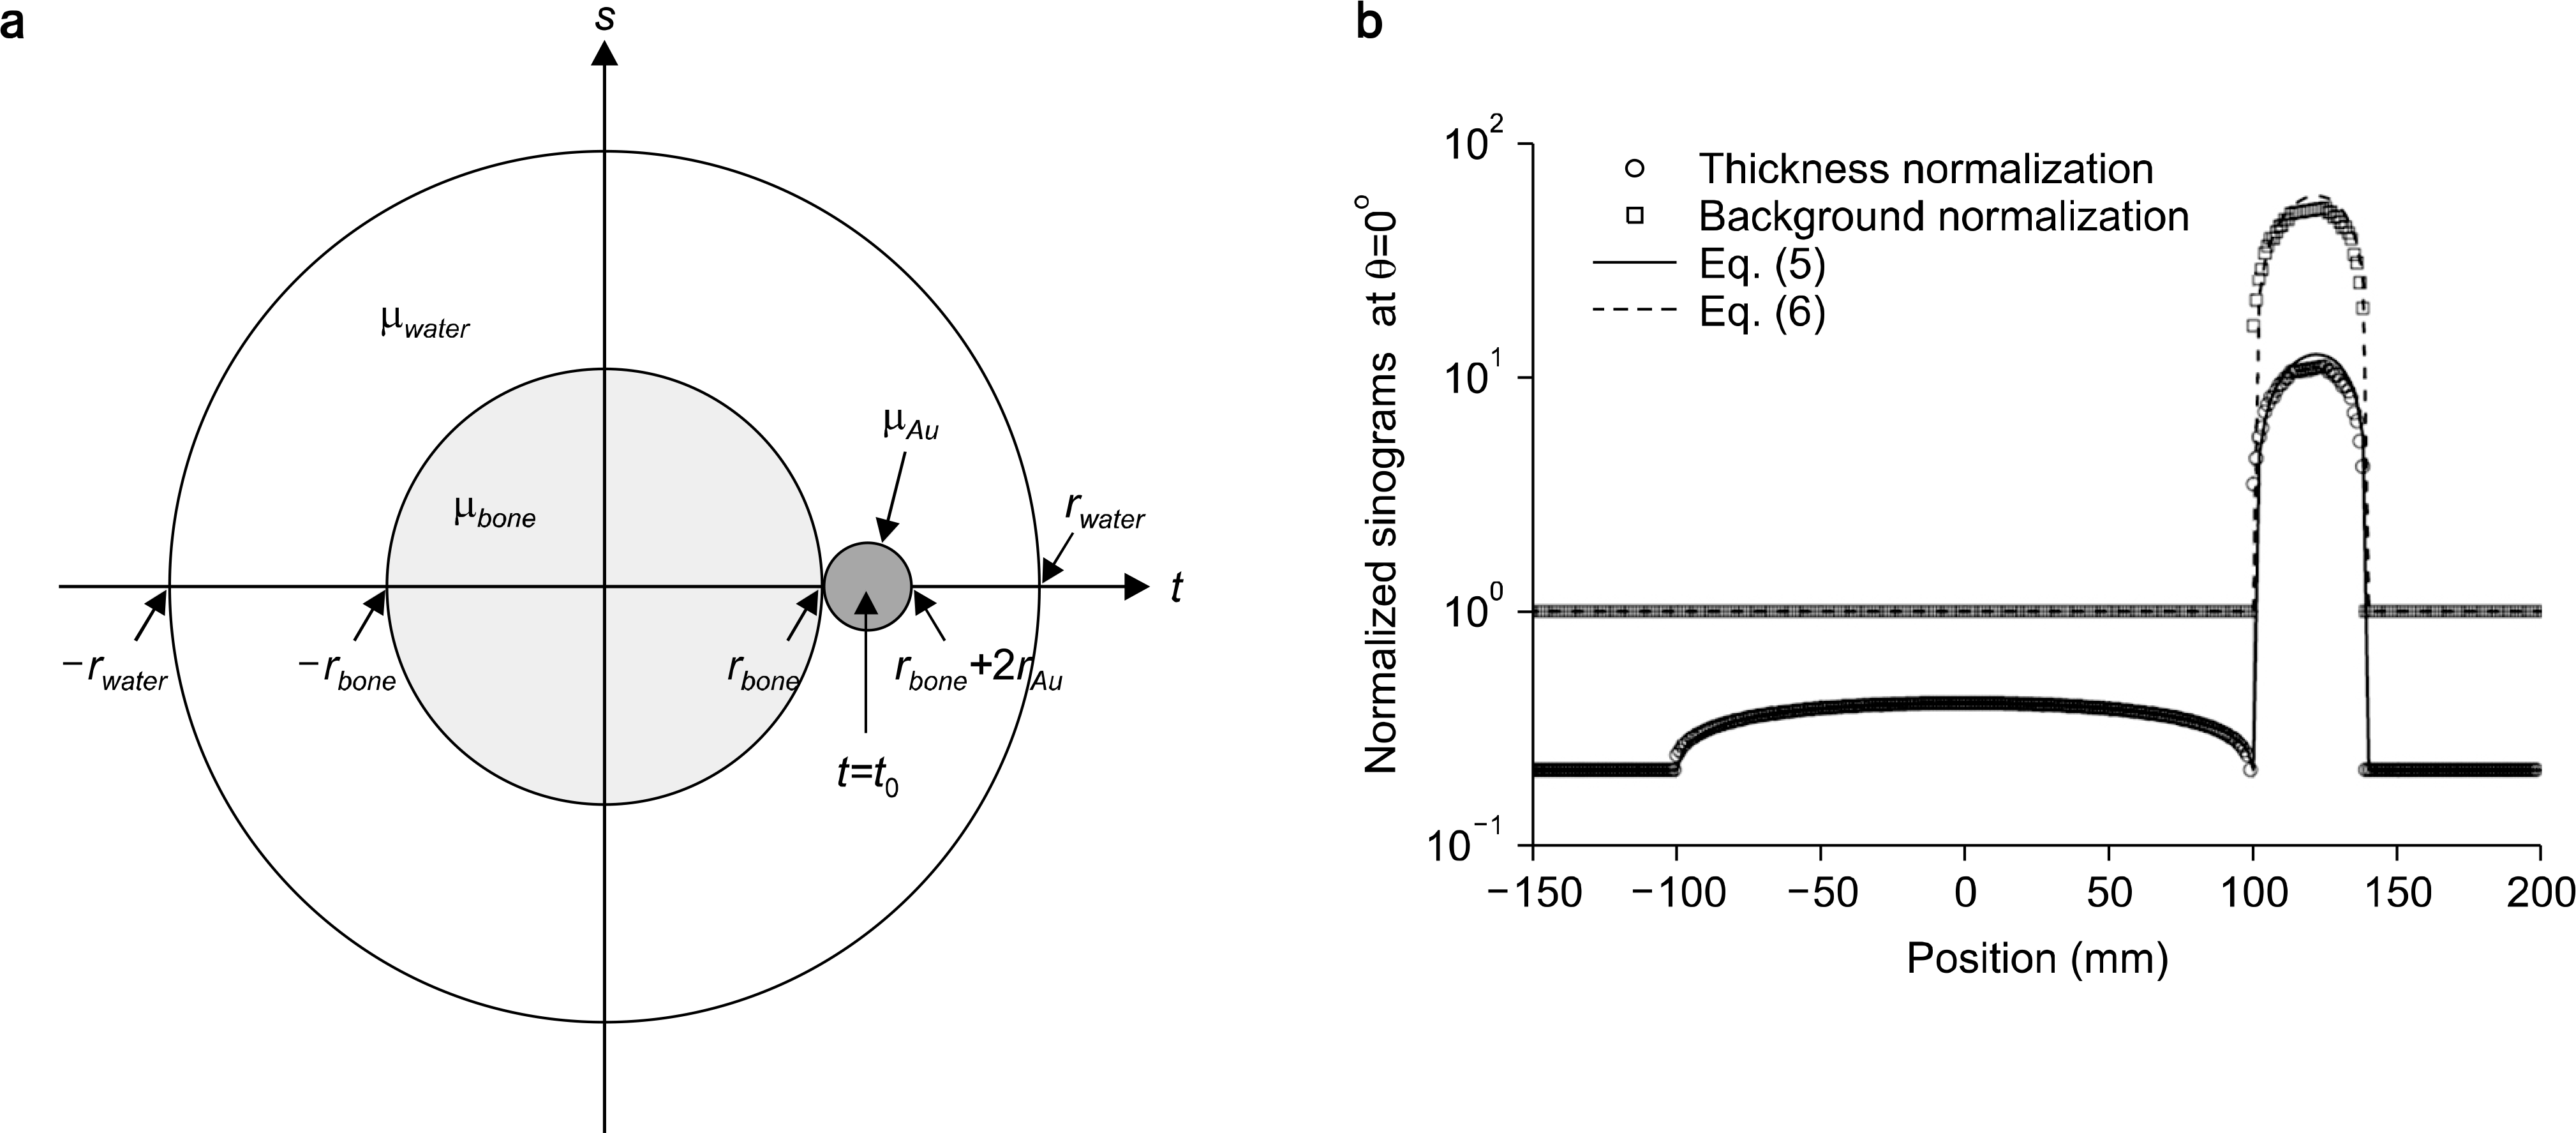 | Fig. 3.(a) Simple circular numerical phantom consisting of water (μwater), bone (μbone) and gold (μAu). Radii of each material rj, where j=water, bone, and Au, are 200, 100 and 20 mm, respectively. The center of gold material is located at t0=120 mm. (b) Comparison of normalized sinograms obtained at θ=0o. Symbols describe the simulation results, whereas solid lines describe theoretical calculations. |
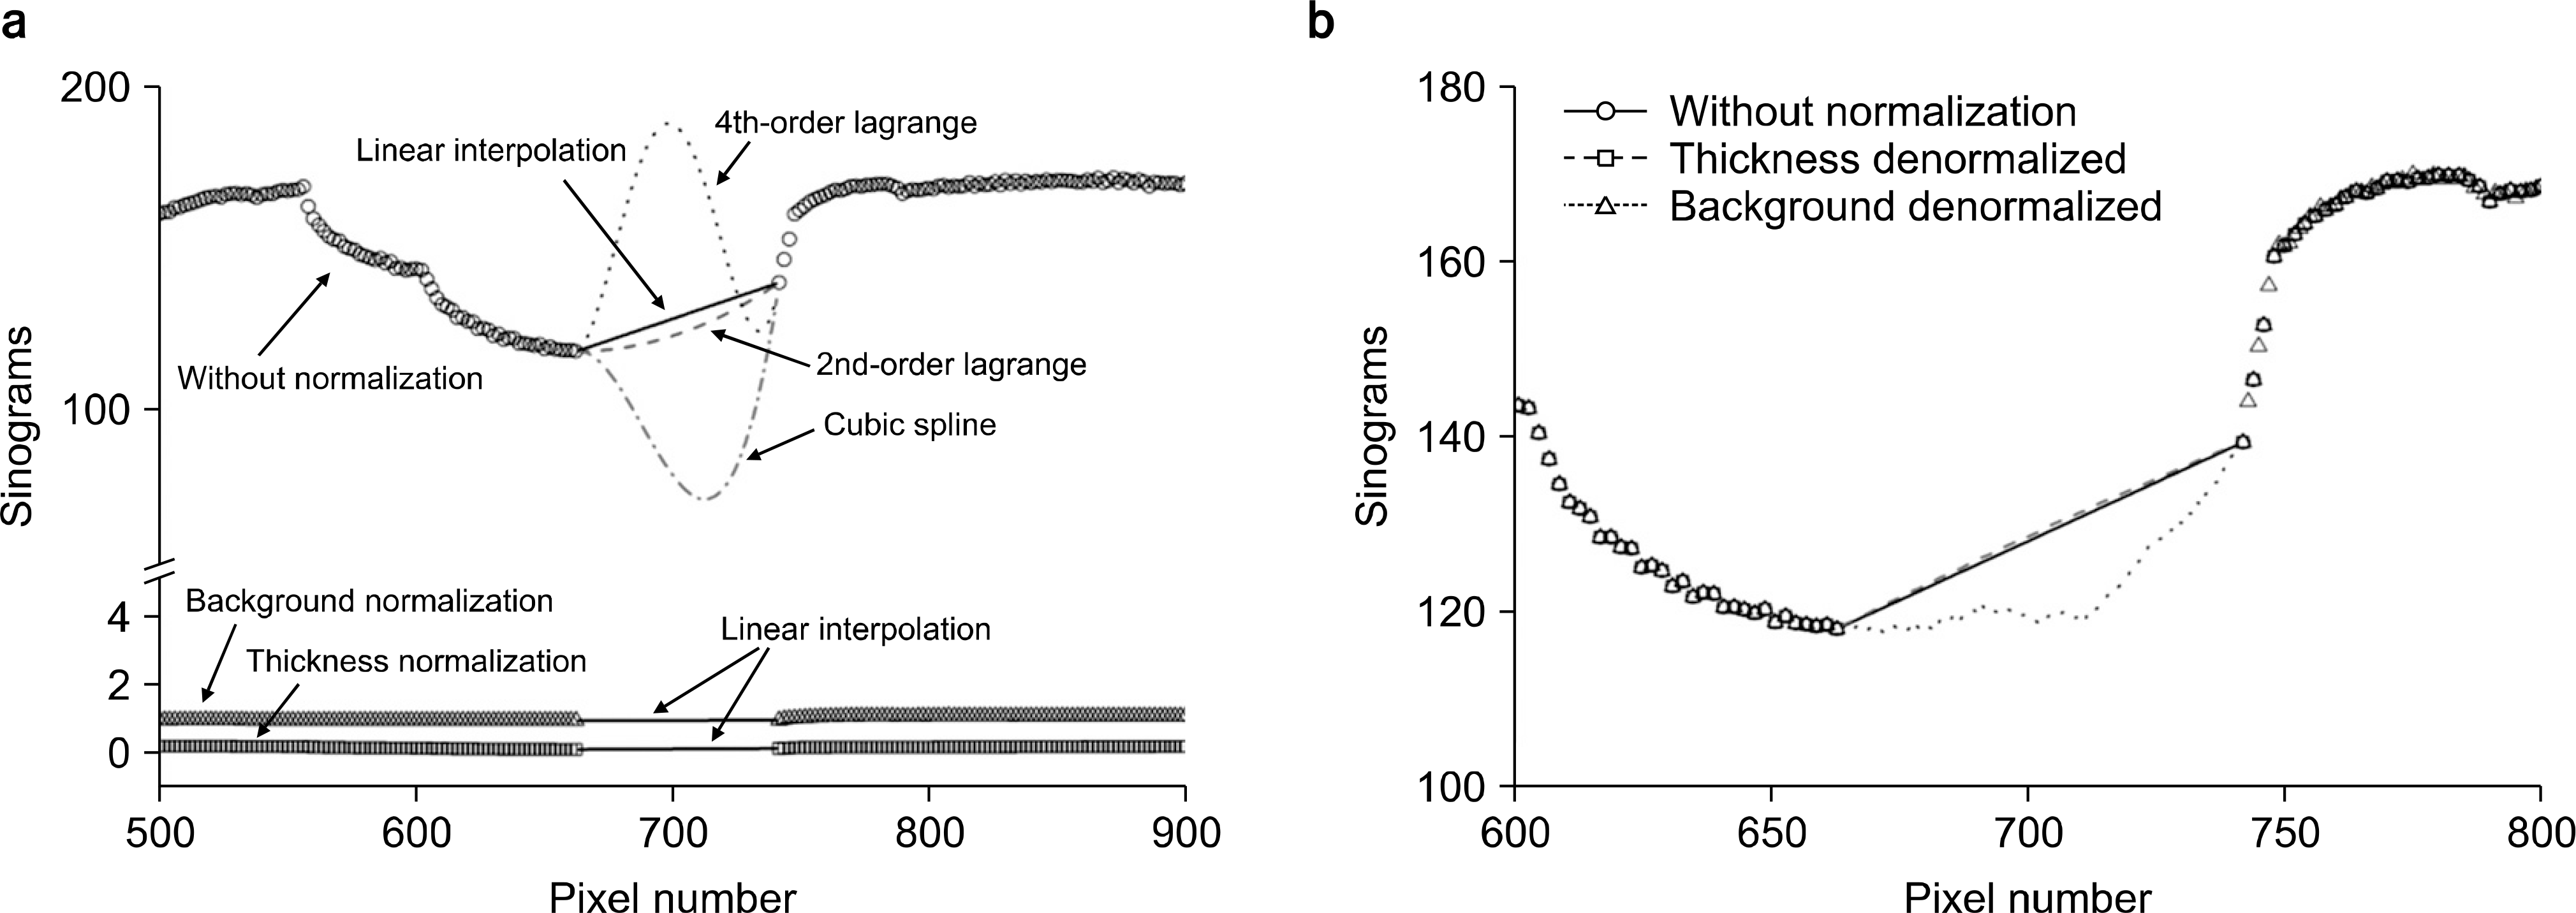 | Fig. 4.(a) Interpolated sinograms with various functions which include simple linear function, 2nd-, 3rd-, and 4th-order Lagrange functions, and cubic spline. For comparison, the thickness- and background-normalized sinograms with linear interpolation are also plotted. (b) Sinograms denormalized from the thickness and background normalizations. For comparison, the original sinogram with linear interpolation is also plotted. All the profiles are extracted from sinograms obtained at θ=263o at which the effect of interpolation can be well addressed. |
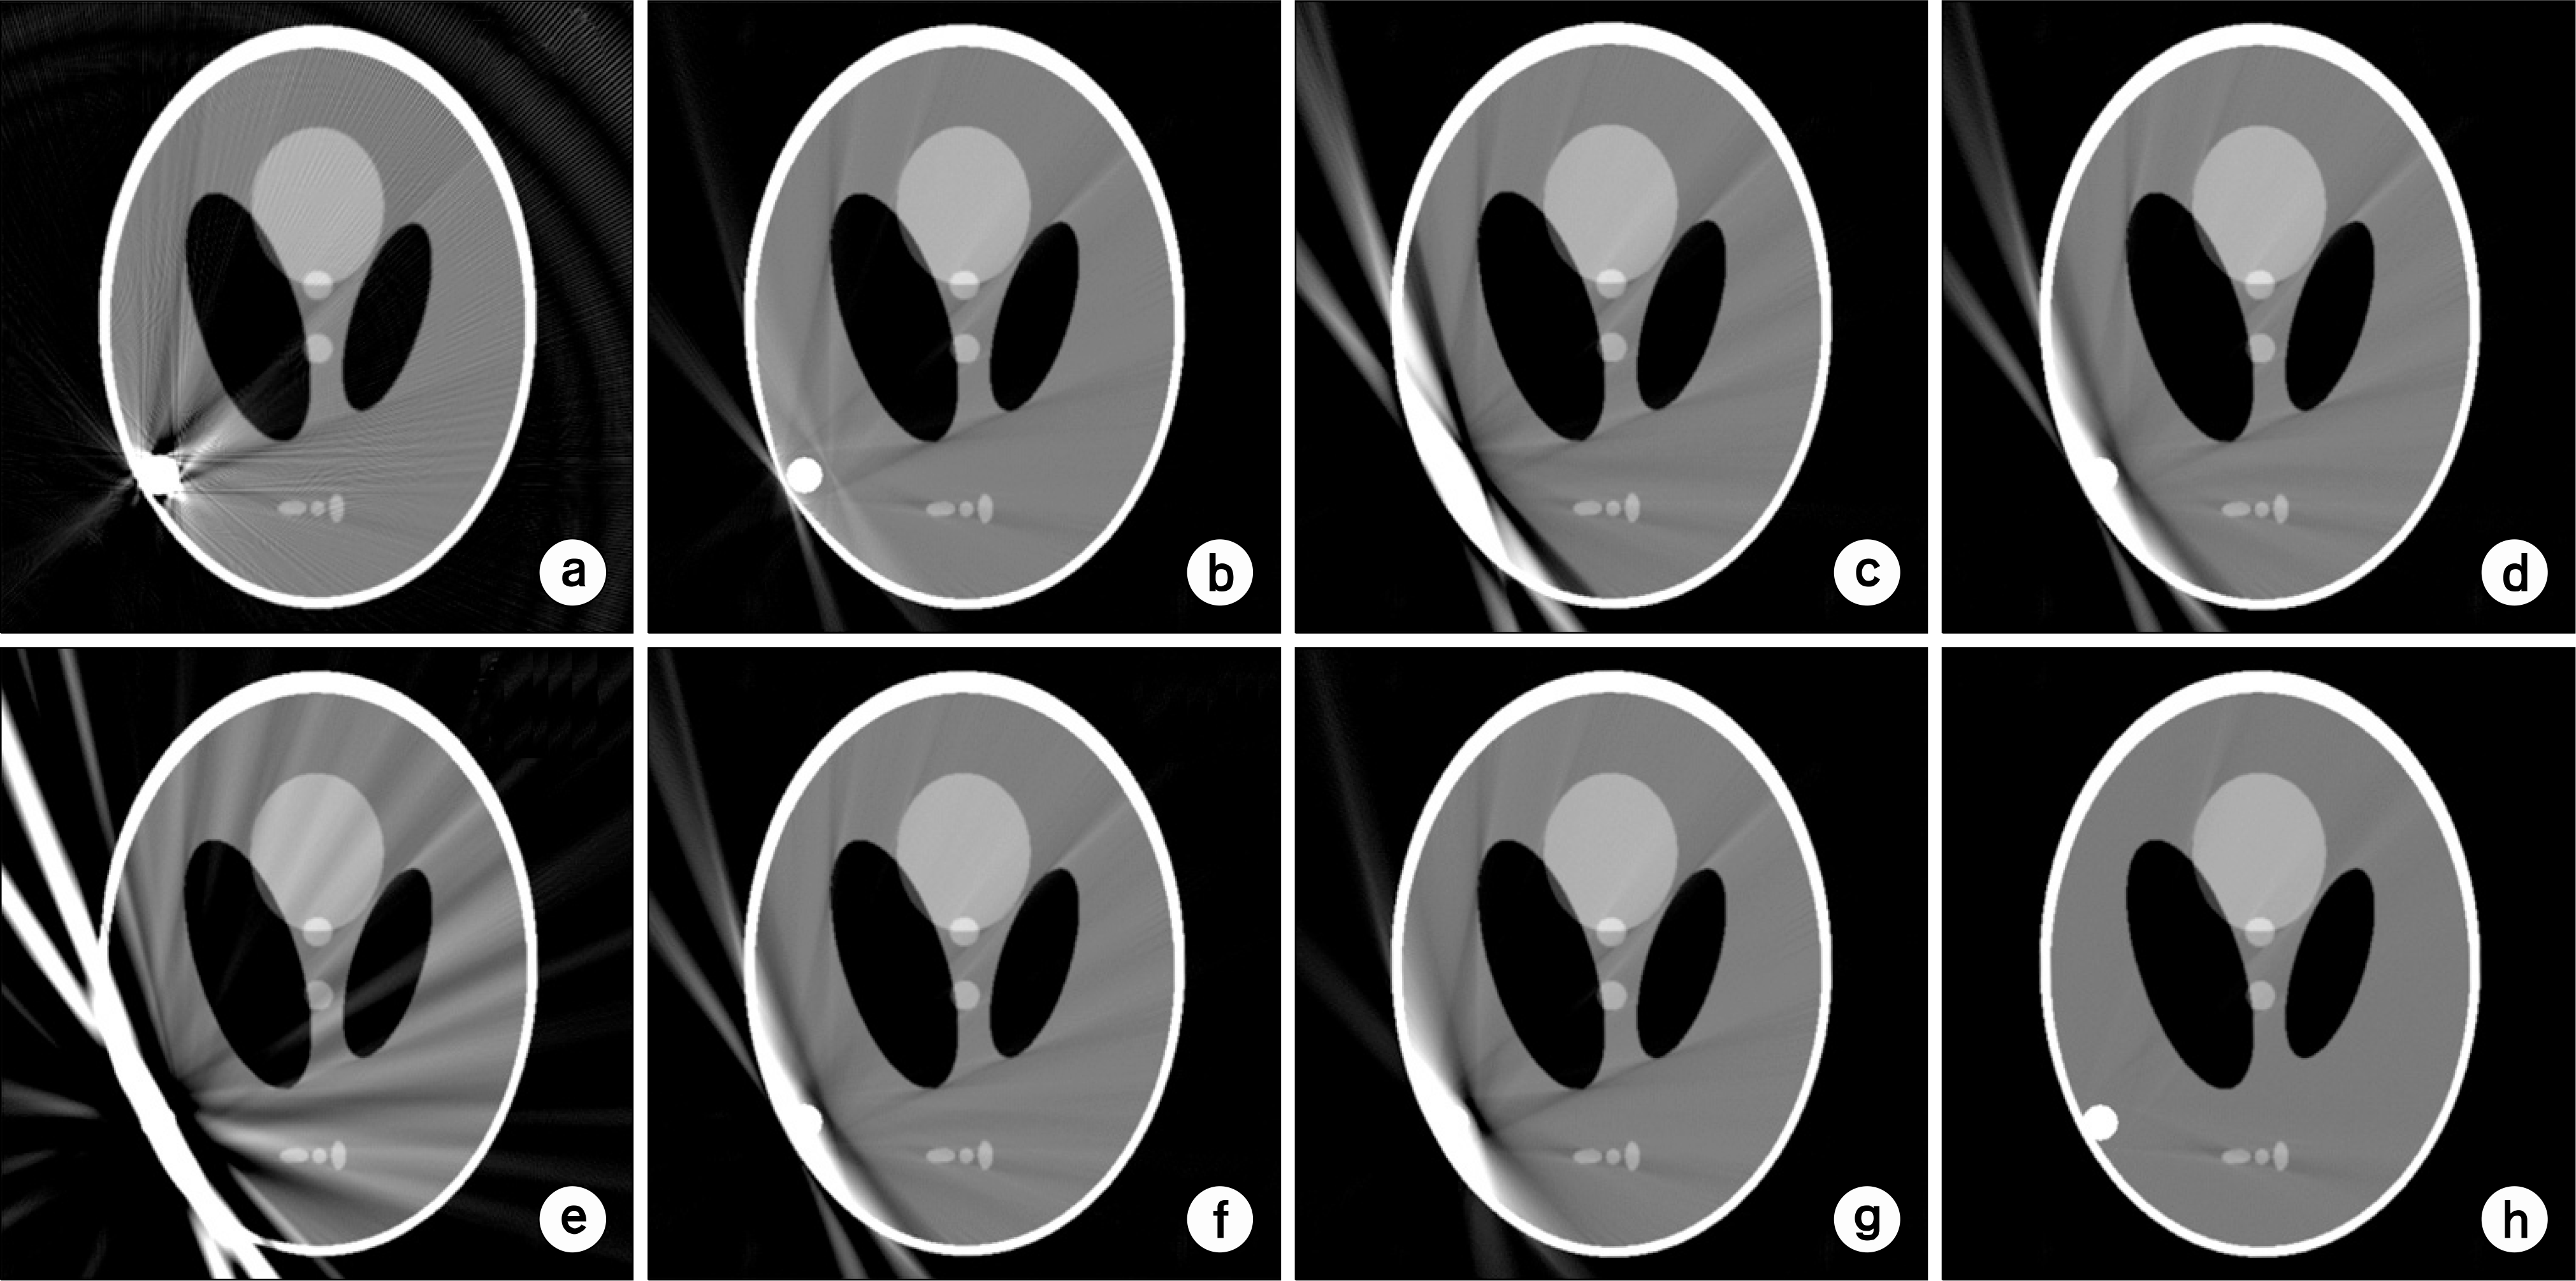 | Fig. 5.Restored images by using various interpolation methods for (a) an original image: (b) linear interpolation, (c) 2nd-order Lagrange interpolation, (d) 3rd-order Lagrange interpolation, (e) 4th-order Lagrange interpolation, (f) cubic spline interpolation, (g) linear interpolation in the thickness-normalized sinogram, and (h) linear interpolation in the background-normalized sinogram. |
 | Fig. 6.Column (a) shows the reconstructed images with metal objects having various sizes. Column (b) and (c) shows the restored images using the thickness and background normalization methods, respectively. Column (d) shows the restored images using the background normalization method without the segmentation procedure. The insets are the profiles extracted from sinograms obtained at θ=30o. |
 | Fig. 7.Column (a) shows the reconstructed images with various numbers of metal objects. Column (b) and (c) shows the restored images using the thickness and background normalization methods, respectively. Column (d) shows the restored images using the background normalization method without the segmentation procedure. The insets are the profiles extracted from sinograms obtained at θ=30o. |
Table 1.
Linear attenuation coefficients of tissue and metal, and ratios between metal and tissue at diagnostic energy.


 PDF
PDF ePub
ePub Citation
 Print
Print


 XML Download