

 PDF
PDF ePub
ePub Citation
 Print
Print


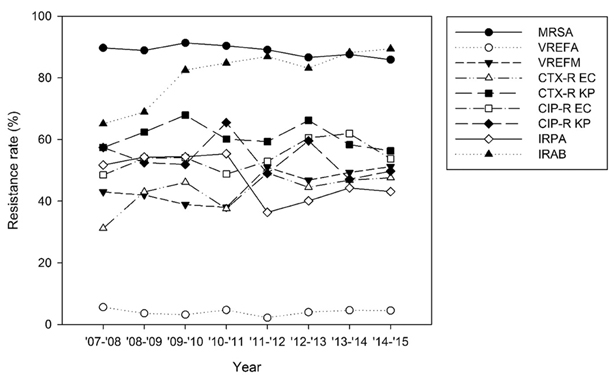 | Figure 1.Antimicrobial resistance rates of major pathogens isolated from patients with nosocomial infections during 8-year period (MRSA, methicillin-resistant Staphylococcus aureus; VREFA, vancomycin-resistant Enterococcus faecalis; VREFM, vancomycin-resistant Enterococcus faecium; CTX-R EC, cefotaxime-resistant Escherichia coli; CTX-R KP, cefotaxime-resistant Klebsiella pneumoniae; CIP-R EC, ciprofloxacin-resistant Escherichia coli; CIP-R KP, ciprofloxacin-resistant Klebsiella pneumoniae; IRAP, imiepenem-resistant Pseudomonas aeruginosa; IRAB, imipenem-resistant Acinetobacter baumannii).
|
Table 1.
Characteristics of hospitals and intensive care units participated in KONIS from July 2014 through June 2015
![]()
Table 2.
Pooled means of nosocomial infection rates, by number of hospital beds, July 2014 through June 2015
| Nosocomial infection rate |
No. of hospital beds |
|||
|---|---|---|---|---|
| ≥900 | 700-899 | 300-699 | All | |
| No. of units | 41 | 62 | 66 | 169 |
| Patient-days | 227,623 | 349,535 | 305,980 | 883,138 |
| Infection rate* | ||||
| No. of infections | 594 | 1,090 | 840 | 2,524 |
| Pooled mean | 2.61 | 3.12 | 2.75 | 2.86 |
| 95% CI | 2.41-2.83 | 2.94-3.31 | 2.57-2.94 | 2.75-2.97 |
| UTI rate† | ||||
| No. of UTI | 140 | 283 | 276 | 699 |
| Pooled mean | 0.62 | 0.81 | 0.90 | 0.79 |
| 95% CI | 0.52-0.73 | 0.72-0.91 | 0.80-1.01 | 0.73-0.85 |
| BSI rate‡ | ||||
| No. of BSI | 310 | 459 | 321 | 1,090 |
| Pooled mean | 1.36 | 1.31 | 1.05 | 1.23 |
| 95% CI | 1.22-1.52 | 1.20-1.44 | 0.94-1.17 | 1.16-1.31 |
| PNEU rate§ | ||||
| No. of PNEU | 144 | 348 | 243 | 735 |
| Pooled mean | 0.63 | 1.00 | 0.79 | 0.83 |
| 95% CI | 0.54-0.74 | 0.90-1.11 | 0.70-0.90 | 0.77-0.89 |
![]()
Table 3.
Pooled means and percentiles of the device-associated infection rates, by number of hospital beds, July 2014 through June 2015
| No. of hospital beds | No. of units | No. of infection | Device days | Pooled mean | 95% CI | 10‰ | 25‰ | 50‰ | 75‰ | 90‰ |
|---|---|---|---|---|---|---|---|---|---|---|
| Urinary catheter-associated UTI rate* | ||||||||||
| ≥900 | 41 | 134 | 193,951 | 0.69 | 0.58-0.82 | 0 | 0 | 0.45 | 0.67 | 2.87 |
| 700-899 | 62 | 276 | 304,684 | 0.91 | 0.81-1.02 | 0 | 0.20 | 0.51 | 1.28 | 2.12 |
| 300-699 | 66 | 265 | 247,132 | 1.07 | 0.95-1.21 | 0 | 0.29 | 0.74 | 1.59 | 2.39 |
| All | 169 | 675 | 745,767 | 0.91 | 0.84-0.98 | 0 | 0.20 | 0.56 | 1.34 | 2.32 |
| Central line-associated BSI rate† | ||||||||||
| ≥900 | 41 | 278 | 137,720 | 2.02 | 1.79-2.27 | 0 | 0.84 | 1.34 | 2.86 | 4.07 |
| 700-899 | 62 | 392 | 193,050 | 2.03 | 1.84-2.24 | 0.42 | 1.07 | 1.92 | 3.02 | 3.66 |
| 300-699 | 66 | 262 | 127,118 | 2.06 | 1.83-2.33 | 0 | 0.20 | 1.49 | 3.10 | 4.82 |
| All | 169 | 932 | 457,888 | 2.04 | 1.91-2.17 | 0 | 0.84 | 1.54 | 3.01 | 3.99 |
| Ventilator-associated PNEU rate‡ | ||||||||||
| ≥900 | 41 | 90 | 103,137 | 0.87 | 0.71-1.07 | 0 | 0 | 0.56 | 1.81 | 2.64 |
| 700-899 | 62 | 234 | 153,033 | 1.53 | 1.35-1.74 | 0 | 0.27 | 1.03 | 2.03 | 4.41 |
| 300-699 | 66 | 119 | 103,883 | 1.15 | 0.96-1.37 | 0 | 0 | 0.50 | 1.60 | 3.87 |
| All | 169 | 443 | 360,053 | 1.23 | 1.12-1.35 | 0 | 0 | 0.67 | 1.82 | 3.89 |
![]()
Table 4.
Pooled means and percentiles of the distribution of device- utilization ratios, by number of hospital beds, July 2014 through June 2015
| No. of hospital beds | No. of units | Device days | Patient days | Pooled mean | 95% CI | 10‰ | 25‰ | 50‰ | 75‰ | 90‰ |
|---|---|---|---|---|---|---|---|---|---|---|
| Urinary catheter utilization ratio* | ||||||||||
| ≥900 | 41 | 193,951 | 227,623 | 0.85 | 0.849-0.851 | 0.71 | 0.81 | 0.89 | 0.93 | 0.97 |
| 700-899 | 62 | 304,684 | 349,535 | 0.87 | 0.869-0.871 | 0.75 | 0.83 | 0.90 | 0.94 | 0.98 |
| 300-699 | 66 | 247,132 | 305,980 | 0.81 | 0.809-0.811 | 0.63 | 0.76 | 0.85 | 0.91 | 0.96 |
| All | 169 | 745,767 | 883,138 | 0.84 | 0.839-0.841 | 0.69 | 0.81 | 0.88 | 0.93 | 0.98 |
| Central line utilization ratio† | ||||||||||
| ≥900 | 41 | 137,720 | 227,623 | 0.61 | 0.608-0.612 | 0.40 | 0.50 | 0.65 | 0.75 | 0.85 |
| 700-899 | 62 | 193,050 | 349,535 | 0.55 | 0.548-0.552 | 0.40 | 0.43 | 0.53 | 0.68 | 0.78 |
| 300-699 | 66 | 127,118 | 305,980 | 0.42 | 0.418-0.422 | 0.25 | 0.32 | 0.41 | 0.51 | 0.59 |
| All | 169 | 457,888 | 883,138 | 0.52 | 0.519-0.521 | 0.30 | 0.40 | 0.51 | 0.64 | 0.77 |
| Ventilator utilization ratio‡ | ||||||||||
| ≥900 | 41 | 103,137 | 227,623 | 0.45 | 0.448-0.452 | 0.19 | 0.29 | 0.47 | 0.66 | 0.76 |
| 700-899 | 62 | 153,033 | 349,535 | 0.44 | 0.438-0.442 | 0.27 | 0.35 | 0.42 | 0.51 | 0.60 |
| 300-699 | 66 | 103,883 | 305,980 | 0.34 | 0.338-0.342 | 0.15 | 0.24 | 0.36 | 0.45 | 0.53 |
| All | 169 | 360,053 | 883,138 | 0.41 | 0.409-0.411 | 0.19 | 0.30 | 0.39 | 0.51 | 0.63 |
![]()
Table 5.
Pooled means and percentiles of the distribution of device- associated infection rates, by type of ICU, July 2014 through June 2015
| Type of ICU | No. of units | No. of infection | Device days | Pooled mean | 95% CI | 10‰ | 25‰ | 50‰ | 75‰ | 90‰ |
|---|---|---|---|---|---|---|---|---|---|---|
| Urinary catheter-associated UTI rate* | ||||||||||
| MICU | 68 | 261 | 309,194 | 0.84 | 0.75-0.95 | 0 | 0 | 0.38 | 1.13 | 2.09 |
| MCICU | 31 | 122 | 150,769 | 0.81 | 0.68-0.97 | 0 | 0.24 | 0.57 | 1.28 | 1.94 |
| SCICU | 23 | 95 | 87,684 | 1.08 | 0.86-1.33 | 0 | 0 | 0.80 | 1.59 | 2.41 |
| SICU | 22 | 80 | 88,445 | 0.91 | 0.73-1.13 | 0 | 0.19 | 0.50 | 1.14 | 1.99 |
| NSICU | 25 | 117 | 109,675 | 1.07 | 0.89-1.28 | 0.08 | 0.27 | 0.64 | 2.13 | 2.66 |
| Central line-associated BSI rate† | ||||||||||
| MICU | 68 | 468 | 201,581 | 2.32 | 2.12-2.54 | 0.22 | 1.13 | 2.12 | 3.39 | 4.75 |
| MCICU | 31 | 152 | 83,413 | 1.82 | 1.55-2.14 | 0 | 0.27 | 1.15 | 3.18 | 3.96 |
| SCICU | 23 | 100 | 55,571 | 1.80 | 1.48-2.19 | 0 | 0 | 1.45 | 2.41 | 4.27 |
| SICU | 22 | 133 | 59,572 | 2.23 | 1.88-2.65 | 0 | 0.92 | 1.73 | 3.10 | 3.80 |
| NSICU | 25 | 79 | 57,751 | 1.37 | 1.10-1.71 | 0 | 0.61 | 1.30 | 2.34 | 3.25 |
| Ventilator-associated PNEU rate‡ | ||||||||||
| MICU | 68 | 134 | 174,117 | 0.77 | 0.65-0.91 | 0 | 0 | 0.44 | 1.10 | 2.06 |
| MCICU | 31 | 66 | 61,650 | 1.07 | 0.84-1.36 | 0 | 0 | 0.46 | 1.37 | 3.32 |
| SCICU | 23 | 63 | 39,684 | 1.59 | 1.24-2.03 | 0 | 0.50 | 0.88 | 1.98 | 3.81 |
| SICU | 22 | 75 | 44,002 | 1.70 | 1.36-2.14 | 0 | 0 | 1.33 | 2.91 | 5.07 |
| NSICU | 25 | 105 | 40,600 | 2.59 | 2.14-3.13 | 0 | 0.60 | 1.82 | 4.76 | 6.24 |
![]()
Table 6.
Pooled means and percentiles of the distribution of device- utilization ratios, by type of ICU, July 2014 through June 2015
| Type of ICU | No. of units | Device days | Patient days | Pooled mean | 95% CI | 10‰ | 25‰ | 50‰ | 75‰ | 90‰ |
|---|---|---|---|---|---|---|---|---|---|---|
| Urinary catheter utilization ratio* | ||||||||||
| MICU | 68 | 309,194 | 377,167 | 0.82 | 0.819-0.821 | 0.67 | 0.78 | 0.83 | 0.90 | 0.95 |
| MCICU | 31 | 150,769 | 176,191 | 0.86 | 0.858-0.862 | 0.73 | 0.83 | 0.87 | 0.92 | 0.96 |
| SCICU | 23 | 87,684 | 103,223 | 0.85 | 0.848-0.852 | 0.59 | 0.77 | 0.91 | 0.95 | 0.99 |
| SICU | 22 | 88,445 | 102,978 | 0.86 | 0.858-0.862 | 0.81 | 0.85 | 0.89 | 0.94 | 0.96 |
| NSICU | 25 | 109,675 | 123,579 | 0.89 | 0.888-0.892 | 0.72 | 0.86 | 0.93 | 0.98 | 0.99 |
| Central line utilization ratio† | ||||||||||
| MICU | 68 | 201,581 | 377,167 | 0.53 | 0.528-0.532 | 0.32 | 0.40 | 0.53 | 0.64 | 0.79 |
| MCICU | 31 | 83,413 | 176,191 | 0.47 | 0.468-0.472 | 0.26 | 0.34 | 0.45 | 0.53 | 0.77 |
| SCICU | 23 | 55,571 | 103,223 | 0.54 | 0.537-0.543 | 0.31 | 0.43 | 0.53 | 0.66 | 0.75 |
| SICU | 22 | 59,572 | 102,978 | 0.58 | 0.577-0.583 | 0.28 | 0.45 | 0.63 | 0.73 | 0.83 |
| NSICU | 25 | 57,751 | 123,579 | 0.47 | 0.467-0.473 | 0.35 | 0.41 | 0.45 | 0.52 | 0.66 |
| Ventilator utilization ratio‡ | ||||||||||
| MICU | 68 | 174,117 | 377,167 | 0.46 | 0.458-0.462 | 0.28 | 0.37 | 0.45 | 0.58 | 0.69 |
| MCICU | 31 | 61,650 | 176,191 | 0.35 | 0.348-0.352 | 0.10 | 0.20 | 0.41 | 0.47 | 0.55 |
| SCICU | 23 | 39,684 | 103,223 | 0.38 | 0.377-0.383 | 0.21 | 0.28 | 0.37 | 0.42 | 0.55 |
| SICU | 22 | 44,002 | 102,978 | 0.43 | 0.427-0.433 | 0.16 | 0.28 | 0.38 | 0.48 | 0.67 |
| NSICU | 25 | 40,600 | 123,579 | 0.33 | 0.327-0.333 | 0.14 | 0.21 | 0.31 | 0.44 | 0.60 |
![]()
Table 7.
Number (%) of microorganisms isolated from clinical specimens of patients with nosocomial infections
![]()
Table 8.
Susceptibilities of major pathogens isolated from patients with nosocomial infections
![]()
Table 9.
Comparison of the device utilization ratios and the rates of device-associated infections from 2010 through 2015
| Parameter | July 2010-June 2011 | July 2011-June 2012 | July 2012-June 2013 | July 2013-June 2014 | July 2014-June 2015 | |
|---|---|---|---|---|---|---|
| No. of hospitals | 72 | 81 | 91 | 94 | 96 | |
| No. of units | 130 | 143 | 161 | 166 | 169 | |
| Patient-days | 585,325 | 698,595 | 867,683 | 832,428 | 883,138 | |
| Device-days | ||||||
| Urinary catheter-days | 503,365 | 590,793 | 679,076 | 701,932 | 745,767 | |
| Central line-days | 309,500 | 362,576 | 426,783 | 437,456 | 457,888 | |
| Ventilator-days | 233,640 | 282,472 | 321,601 | 340,075 | 360,053 | |
| No. of infections | ||||||
| Urinary catheter-associated UTI | 1,949 | 1,366 | 854 | 846 | 675 | |
| Central line-associated BSI | 932 | 1,091 | 1,096 | 1,021 | 932 | |
| Ventilator-associated PNEU | 410 | 481 | 526 | 498 | 443 | |
| Device utilization ratio (95% CI) [range*] | ||||||
| Urinary catheter | 0.86 | 0.85 | 0.78 | 0.84 | 0.84 | |
| (0.859-0.861) | (0.849-0.851) | (0.779-0.781) | (0.839-0.841) | (0.839-0.841) | ||
| [0.73-0.97] | [0.71-0.97] | [0.70-0.98] | [0.71-0.97] | [0.69-0.98] | ||
| Central line | 0.53 | 0.52 | 0.49 | 0.53 | 0.52 | |
| (0.529-0.531) | (0.519-0.521) | (0.489-0.491) | (0.529-0.531) | (0.519-0.521) | ||
| [0.31-0.81] | [0.30-0.79] | [0.29-0.80] | [0.29-0.79] | [0.30-0.77] | ||
| Ventilator | 0.40 | 0.40 | 0.37 | 0.41 | 0.41 | |
| (0.399-0.401) | (0.399-0.401) | (0.369-0.371) | (0.409-0.411) | (0.409-0.411) | ||
| [0.19-0.61] | [0.20-0.65] | [0.17-0.66] | [0.21-0.62] | [0.19-0.63] | ||
| Rate per 1,000 device-days (95% CI) [range*] | ||||||
| Urinary catheter-associated UTI | 3.87 | 2.26 | 1.26 | 1.21 | 0.91 | |
| (3.70-4.05) | (2.14-2.39) | (1.18-1.34) | (1.13-1.29) | (0.84-0.98) | ||
| [0-8.80] | [0-5.61] | [0-4.08] | [0-2.71] | [0-2.32] | ||
| Central line-associated BSI | 3.01 | 3.01 | 2.57 | 2.33 | 2.04 | |
| (2.82-3.21) | (2.84-3.19) | (2.42-2.72) | (2.20-2.48) | (1.91-2.17) | ||
| [0-6.92] | [0-6.64] | [0-7.35] | [0-5.08] | [0-3.99] | ||
| Ventilator-associated PNEU | 1.75 | 1.70 | 1.64 | 1.46 | 1.23 | |
| (1.59-1.93) | (1.56-1.86) | (1.50-1.78) | (1.34-1.60) | (1.12-1.35) | ||
| [0-5.88] | [0-5.96] | [0-6.67] | [0-3.93] | [0-3.89] | ||
![]()
 XML Download