Journal List > J Korean Soc Radiol > v.79(1) > 1098288

Jung and Kim: Association of Volumetric Breast Density with Clinical and Histopathological Factors in 205 Breast Cancer Patients

Abstract

Purpose

To evaluate the association of volumetric breast density with clinicopathological factors in breast cancer patients.

Materials and Methods:

A total of 205 Korean patients with breast cancer who underwent mammography for initial staging between January 2015 and June 2016 were enrolled. Volumetric breast density was measured using a fully automated commercial method (Volpara®). in the contralateral breast. The association of volumetric breast density with clinical and histopathological factors was evaluated using t-test and analysis of variance asappropriate.

Results:

Mean volumetric breast density in all patients was 13.5% (range, 4.1–34.9%). The mean volumetric breast density in patients with symptom-detected cancers was significantly higher than that in those with screening-detected cancers (14.9% vs. 11.8%, p = 0.002). Mean volumetric breast density tended to decrease with age (20–39 years: 19.0%, 40–59 years: 14.3%, 60–80 years: 7.7%). The mean volumetric breast density in postmenopausal women was significantly lower than that in premenopausal women (9.8% vs. 17.6%, p < 0.001). Other histopathological factors including histologic grade or hormone receptor status were not associated with volumetric breast density.

Conclusion:

Our results suggest that volumetric breast density is associated with the method of detection, age, and menopausal status.

REFERENCES

1.Boyd NF., Guo H., Martin LJ., Sun L., Stone J., Fishell E, et al. Mammographic density and the risk and detection of breast cancer. N Engl J Med. 2007. 356:227–236.
crossref
2.McCormack VA., dos Santos Silva I. Breast density and parenchymal patterns as markers of breast cancer risk: a meta-analysis. Cancer Epidemiol Biomarkers Prev. 2006. 15:1159–1169.
crossref
3.Harvey JA., Bovbjerg VE. Quantitative assessment of mammographic breast density: relationship with breast cancer risk. Radiology. 2004. 230:29–41.
crossref
4.Harvey JA., Holm MK., Ranganath R., Guse PA., Trott EA., Hel-zner E. The effects of bazedoxifene on mammographic breast density in postmenopausal women with osteoporosis. Meno-pause. 2009. 16:1193–1196.
crossref
5.Cuzick J., Warwick J., Pinney E., Duffy SW., Cawthorn S., Howell A, et al. Tamoxifen-induced reduction in mammographic density and breast cancer risk reduction: a nested case-control study. J Natl Cancer Inst. 2011. 103:744–752.
crossref
6.Harvey JA., Bovbjerg VE., Smolkin ME., Williams MB., Petroni GR. Evaluating hormone therapy-associated increases in breast density comparison between reported and simultaneous assignment of BI-RADS categories, visual assessment, and quantitative analysis. Acad Radiol. 2005. 12:853–862.
7.Kolb TM., Lichy J., Newhouse JH. Comparison of the performance of screening mammography, physical examination, and breast US and evaluation of factors that influence them: an analysis of 27,825 patient evaluations. Radiology. 2002. 225:165–175.
crossref
8.Pinsky RW., Helvie MA. Mammographic breast density: effect on imaging and breast cancer risk. J Natl Compr Canc Netw. 2010. 8:1157–1164. quiz 1165.
crossref
9.American College of Radiology. Breast Imaging Reporting and Data System (BI-RADS). 4th ed.Reston, VA: American College of Radiology;2003.
10.Byng JW., Yaffe MJ., Jong RA., Shumak RS., Lockwood GA., Tritchler DL, et al. Analysis of mammographic density and breast cancer risk from digitized mammograms. Radio-graphics. 1998. 18:1587–1598.
crossref
11.Zhou C., Chan HP., Petrick N., Helvie MA., Goodsitt MM., Sahin-er B, et al. Computerized image analysis: estimation of breast density on mammograms. Med Phys. 2001. 28:1056–1069.
crossref
12.Chang YH., Wang XH., Hardesty LA., Chang TS., Poller WR., Good WF, et al. Computerized assessment of tissue composition on digitized mammograms. Acad Radiol. 2002. 9:899–905.
crossref
13.Ng KH., Lau S. Vision 20/20: mammographic breast density and its clinical applications. Med Phys. 2015. 42:7059–7077.
crossref
14.Destounis S., Johnston L., Highnam R., Arieno A., Morgan R., Chan A. Using volumetric breast density to quantify the potential masking risk of mammographic density. AJR Am J Roentgenol. 2017. 208:222–227.
crossref
15.Leong SP., Shen ZZ., Liu TJ., Agarwal G., Tajima T., Paik NS, et al. Is breast cancer the same disease in Asian and Western countries? World J Surg. 2010. 34:2308–2324.
crossref
16.Boyd N., Martin L., Stone J., Little L., Minkin S., Yaffe M. A lon-gitudinal study of the effects of menopause on mammographic features. Cancer Epidemiol Biomarkers Prev. 2002. 11:1048–1053.
17.Choppin SB., Wheat JS., Gee M., Goyal A. The accuracy of breast volume measurement methods: a systematic review. Breast. 2016. 28:121–129.
crossref
18.Kovacs L., Eder M., Hollweck R., Zimmermann A., Settles M., Schneider A, et al. Comparison between breast volume measurement using 3D surface imaging and classical techniques. Breast. 2007. 16:137–145.
crossref
19.Veitch D., Burford K., Dench P., Dean N., Griffin P. Measurement of breast volume using body scan technology (computer-aided anthropometry). Work. 2012. 41(Suppl 1):4038–4045.
crossref
20.Teo I., Whelehan P., Macaskill JE., Vinnicombe S., Munnoch DA., Evans A. VolparaTM as a measurement tool for breast volume. J Plast Reconstr Aesthet Surg. 2016. 69:581–582.
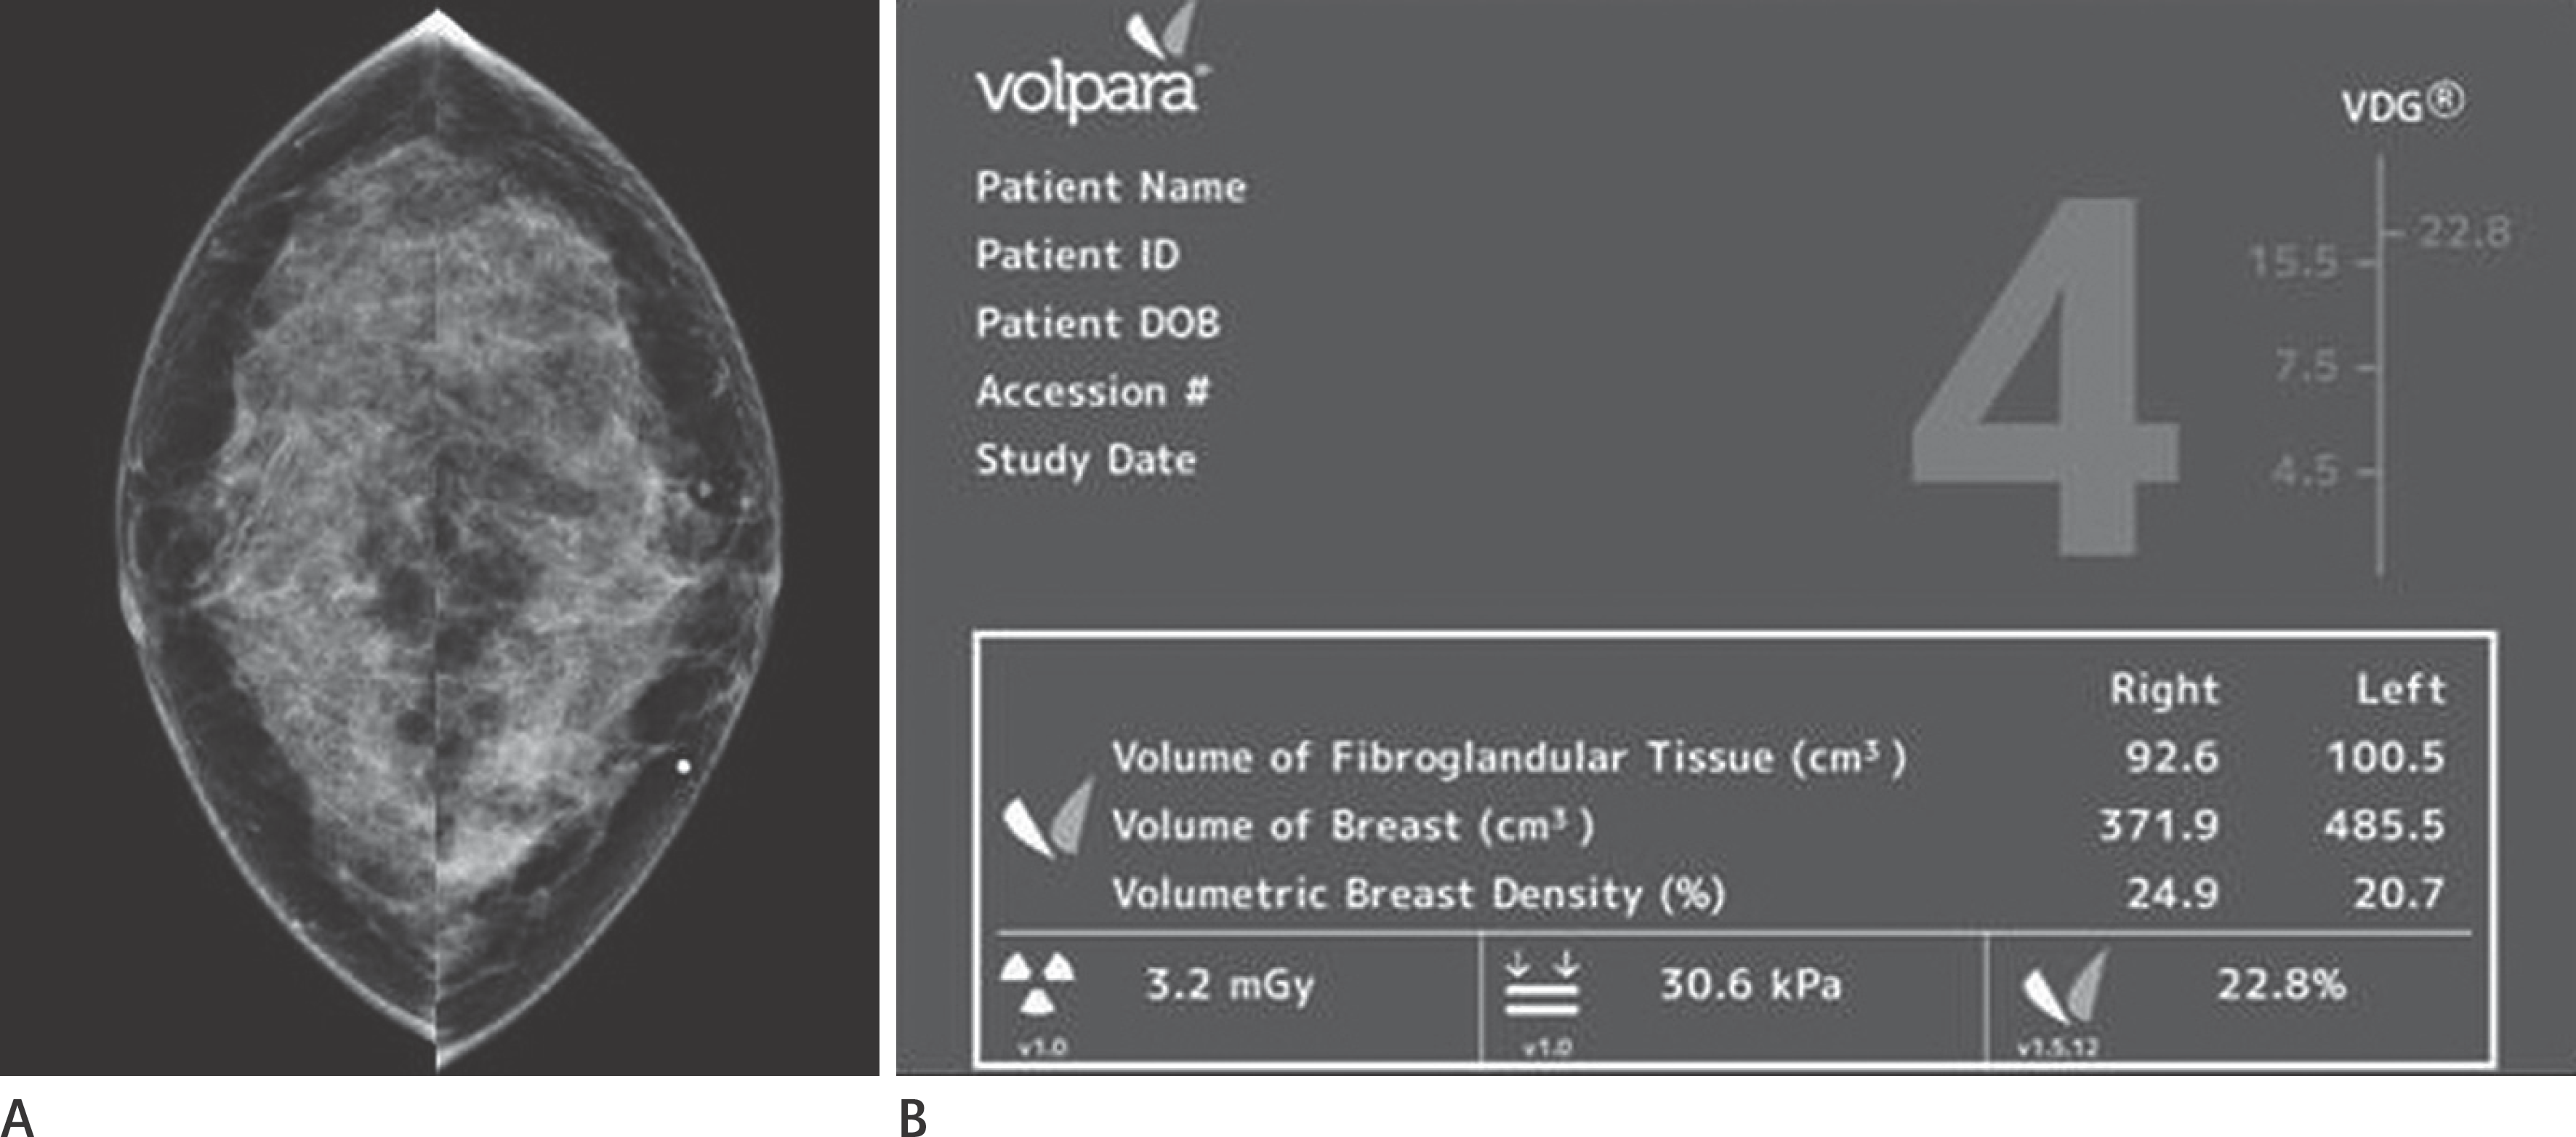
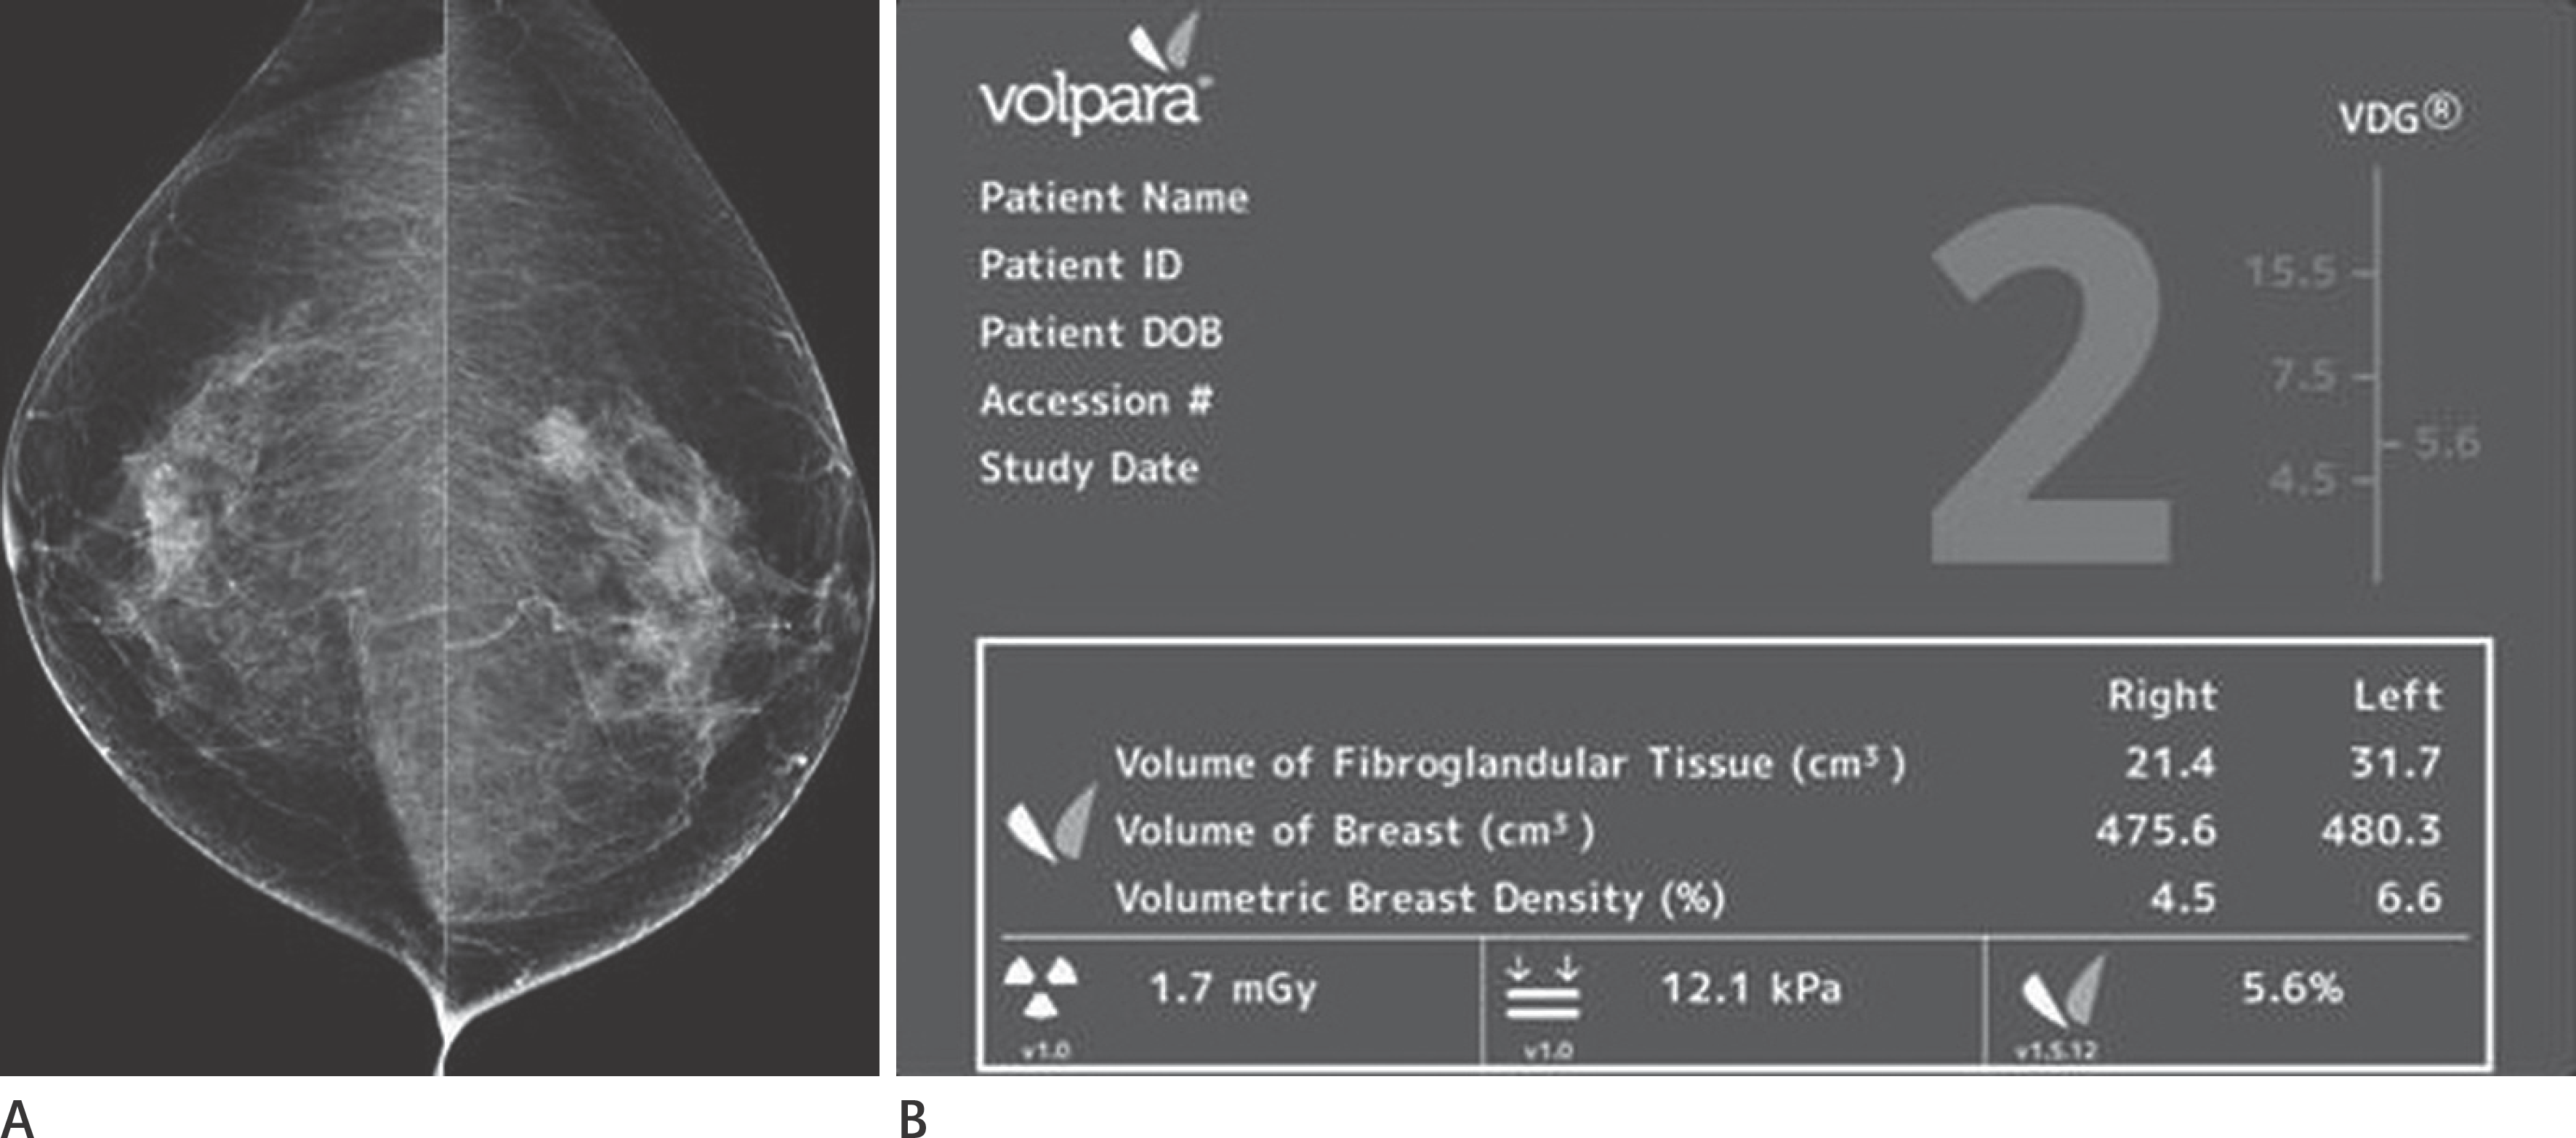
Fig. 1
Right (A) and left (B) craniocaudal mammograms in 49-year-old woman diagnosed with breast cancer for palpable mass in her left inner breast. A fully automated software (Volpara; Volpara Health Technologies, Wellington, the New Zealand) for volumetric breast density assessment shows that the percentage mammographic density of her right breast is 24.9% (Volpara-assigned BI-RADS grade d). Two radiologists assessed BI-RADS grade d for visual assessment in consensus. BI-RADS = Breast Imaging Reporting and Data System
jksr-79-18f1.tif
Fig. 2
Right (A) and left (B) craniocaudal mammograms in 60-year-old woman diagnosed with breast cancer patient detected in health screening in the left mid outer breast. A fully automated software (Volpara; Volpara Health Technologies, Wellington, the New Zealand) for volumetric breast density assessment shows that the percentage mammographic density of her right breast is 4.5% (Volpara-assigned BI-RADS grade b). Two radiologists assessed BI-RADS grade c for visual assessment in consensus. BI-RADS = Breast Imaging Reporting and Data System
jksr-79-18f2.tif
Table 1.
Association of Breast Volume, FGT Volume, and Volumetric Breast Density with Clinical Factors in 205 Breast Cancer Patients
  Breast Volume (cm3) p-Value FGT Volume (cm3) p-Value Breast Density (%) p-Value
Age, years   0.124   0.001   < 0.001
  20–39 (n = 23) 459.4 (395.9)   68.4 (38.7)   19.0 (8.2)  
  40–59 (n = 142) 487.1 (236.4)   64.5 (38.3)   14.3 (6.5)  
  60–80 (n = 40) 573.7 (228.6)   41.8 (19.7)   7.7 (3.4)  
Method of detection   0.271   0.078   0.002
  Screening (n = 90) 523.4 (232.2)   55.5 (31.1)   11.8 (5.9)  
  Symptom (n = 115) 483.3 (277.3)   64.3 (40.0)   14.9 (7.5)  
Family history of breast cancer   0.201   0.359   0.431
  Absent (n = 191) 507.2 (258.7)   60.9 (37.3)   13.4 (7.1)  
  Present (n = 14) 414.0 (251.4)   54.2 (24.8)   14.9 (6.2)  
Menopausal status   0.130   < 0.001   < 0.001
  Premenopausal (n = 98) 472.1 (274.7)   75.2 (40.0)   17.6 (6.7)  
  Postmenopausal (n = 107) 527.2 (241.3)   47.0 (26.8)   9.8 (4.9)  
HRT experience   0.561   0.699   0.542
  Absent (n = 174) 496.6 (261.8)   60.0 (36.4)   13.7 (7.1)  
  Present (n = 31) 524.7 (242.8)   62.9 (38.0)   12.9 (6.6)  
Parity   0.307   0.022   0.183
  Nulliparous (n = 27) 560.8 (332.0)   75.0 (33.4)   15.2 (6.6)  
  Parous (n = 178) 491.8 (245.5)   58.3 (36.6)   13.3 (7.1)  
Type of breast surgery   0.077   0.633   0.499
  Breast-conserving (n = 163) 517.1 (270.1)   58.1 (35.6)   14.2 (7.0)  
  Mastectomy (n = 42) 437.9 (198.9)   61.1 (2.9)   13.4 (7.0)  

Data are mean values, with standard deviations in parenthesis. FGT = fibroglandular tissue, HRT = hormone replacement therapy

Table 2.
Association of Breast Volume, FGT Volume, and Volumetric Breast Density with Histopathological Factors in 205 Breast Cancer Patients
  Breast Volume (cm3) p-Value FGT Volume (cm3) p-Value Breast density (%) p-Value
Histologic type   0.754   0.259   0.736
  Invasive ductal carcinoma (n = 165) 498.0 (244.0)   60.1 (35.9)   13.7 (7.3)  
  DCIS (n = 17) 480.6 (396.9)   51.3 (29.1)   12.3 (5.6)  
  Others (n = 23) 536.8 (245.4)   70.1 (44.8)   13.5 (5.7)  
Histologic grade∗   0.016   0.093   0.465
  Low (n = 23) 645.4 (403.8)   76.6 (47.5)   13.8 (7.5)  
  Intermediate (n = 110) 472.6 (243.6)   60.4 (34.4)   14.3 (7.1)  
  High (n = 55) 488.8 (215.2)   56.8 (37.7)   12.9 (7.1)  
Lymphovascular invasion∗   0.344   0.604   0.154
  Absent (n = 133) 513.6 (251.1)   62.2 (40.4)   13.2 (6.7)  
  Present (n = 55) 476.5 (225.4)   59.1 (27.7)   14.8 (8.1)  
Hormone receptor status   0.442   0.492   0.976
  Negative (n = 58) 480.6 (220.0)   57.8 (33.1)   13.5 (6.9)  
  Positive (n = 147) 208.9 (272.7)   61.5 (37.9)   13.6 (7.1)  
HER2 status   0.126   0.699   0.185
  Negative (n = 169) 511.3 (270.0)   60.0 (35.7)   13.2 (6.7)  
  Positive (n = 36) 452.2 (192.3)   62.8 (40.7)   15.2 (8.1)  
Tumor size∗   0.487   0.280   0.515
  ≤ 2 cm (n = 134) 494.8 (241.1)   59.5 (37.0)   13.4 (7.0)  
  > 2 cm (n = 54) 522.3 (251.6)   65.9 (37.1)   14.2 (7.4)  
Axillary nodal status   0.632   0.109   0.235
  Negative (n = 159) 496.2 (259.9)   58.3 (34.3)   13.2 (6.8)  
  Positive (n = 46) 517.0 (256.5)   68.1 (42.8)   14.6 (7.8)  

Data are mean values, with standard deviations in parenthesis.

∗Patients with only invasive carcinoma (n = 188).

DCIS = ductal carcinoma in situ, FGT = fibroglandular tissue, HER2 = human epidermal growth factor receptor 2

Table 3.
Association of Breast Density Assessed Visually and Assigned by Volpara with Clinical Factors in 205 Patients
  Visual BI-RADS p-Value Volpara-Assigned BI-RADS p-Value
Age, years   < 0.001   < 0.001
  20–39 (n = 23) 3.3 (0.6)   3.5 ± 0.7  
  40–59 (n = 142) 3.1 ± 0.5   3.2 ± 0.8  
  60–80 (n = 40) 2.6∗ (0.7)   2.5 ± 0.6∗  
Method of detection   0.013   0.034
  Screening (n = 90) 2.9 ± 0.5   3.0 ± 0.8  
  Symptom (n = 115) 3.1 ± 0.6   3.2 ± 0.8  
Family history of breast cancer   0.315   0.240
  Absent (n = 191) 3.0 ± 0.6   3.1 ± 0.8  
  Present (n = 14) 3.1 ± 0.5   3.4 ± 0.6  
Menopausal status   < 0.001   < 0.001
  Premenopausal (n = 98) 3.2 ± 0.5   3.6 ± 0.6  
  Postmenopausal (n = 107) 2.7 ± 0.6   2.7 ± 0.7  
Hormone replacement therapy experience   0.414   0.280
  Absent (n = 174) 3.0 ± 0.6   3.1 ± 0.8  
  Present (n = 31) 2.9 ± 0.8   3.0 ± 0.9  
Parity   0.066   0.203
  Nulliparous (n = 27) 3.2 ± 0.5   3.3 ± 0.7  
  Parous (n = 178) 3.0 ± 0.6   3.1 ± 0.8  
Type of breast surgery   0.457   0.178
  Breast-conserving (n = 163) 3.0 ± 0.6   3.1 ± 0.8  
  Mastectomy (n = 42) 3.0 ± 0.5   3.3 ± 0.7  

Data are mean values, with standard deviations in parenthesis. ∗p< 0.05 for groups with 20–39 years and 40–59 years.

BI-RADS = Breast Imaging Reporting and Data System

Table 5.
Volumetric Density Grade by the Method of Detection of Breast Cancer
  Screening-Detected (n = 90) Symptom-Detected (n = 115)
Volpara-assigned (%)
  a 0 2 (1.7)
  b 30 (33.3) 20 (17.4)
  c 32 (35.6) 44 (38.3)
  d 28 (31.1) 49 (42.6)
Visual (%)
  a 1 (1.1) 2 (3.5)
  b 17 (18.9) 7 (6.1)
  c 65 (72.2) 80 (69.6)
  d 7 (7.8) 24 (20.9)

For Volpara-assigned density, the quantitative volumetric breast density is mapped to an automated density scale (Volpara Density Grade) using the VolparaDensity software (Volpara Health Technologies, Wellington, the New Zealand). The threshold for grade a, b, c, and d was 0.0–4.5%, 4.5–7.5%, 7.5–15.5%, and ≥ 15.5% (in percent dense volume), respectively. Visual density was assessed based on American College of Radiology Breast Imaging Reporting and Data System four category system 4th edition (1: almost entirely fatty, 2: scattered fibroglandular densities, 3: heterogeneously dense, and 4: extremely dense) (9).

Table 4.
Association of Breast Density Assessed Visually and Assigned by Volpara with Histopathological Factors in 205 Patients
  Visual BI-RADS p-Value Volpara-Assigned BI-RADS p-Value
Histologic type   0.968   0.836
  Invasive ductal carcinoma (n = 165) 3.0 ± 0.6   3.1 ± 0.8  
  DCIS (n = 17) 3.0 ± 0.4   3.0 ± 0.7  
  Others (n = 23) 3.0 ± 0.6   3.1 ± 0.8  
Histologic grade∗   0.992   0.440
  Low (n = 23) 3.0 ± 0.3   3.1 ± 0.8  
  Intermediate (n = 110) 3.0 ± 0.6   3.2 ± 0.8  
  High (n = 55) 3.0 ± 0.7   3.0 ± 0.9  
Lymphovascular invasion∗   0.291   0.301
  Absent (n = 133) 3.0 ± 0.6   3.1 ± 0.8  
  Present (n = 55) 2.9 ± 0.7   3.2 ± 0.8  
Hormone receptor status   0.769   0.923
  Negative (n = 58) 3.0 ± 0.5   3.1 ± 0.8  
  Positive (n = 147) 3.0 ± 0.7   3.1 ± 0.8  
HER2 status   0.645   0.368
  Negative (n = 169) 3.0 ± 0.6   3.1 ± 0.8  
  Positive (n = 36) 3.0 ± 0.7   3.2 ± 0.8  
Tumor size   0.287   0.784
  ≤ 2 cm (n = 134) 3.0 ± 0.6   3.1 ± 0.8  
  > 2 cm (n = 54) 2.9 ± 0.7   3.1 ± 0.9  
Axillary nodal status   0.462   0.426
  Negative (n = 159) 3.0 ± 0.6   3.1 ± 0.8  
  Positive (n = 46) 3.0 ± 0.6   3.2 ± 0.8  

∗Patients with only invasive carcinoma (n = 188).

BI-RADS = Breast Imaging Reporting and Data System, DCIS = ductal carcinoma in situ, HER2 = human epidermal growth factor receptor 2

TOOLS
Similar articles