

 PDF
PDF ePub
ePub Citation
 Print
Print


INTRODUCTION
Cleft lip and/or palate (CL/P) is one of the most common craniofacial congenital deformities with an incidence range of 1:700 to 1:1,000.12 Most patients with CL/P need long-term multidisciplinary medical and dental cares for rehabilitation of occlusal function and improvement of facial aesthetics.
Previous studies on the incidence of CL/P have provided useful information for the efficient distribution of health care resources and future health care planning for patients with CL/P.123456 On the basis of a study of 7.5 million births worldwide, the IPDTOC (International Perinatal Database of Typical Oral Clefts) Working Group2 determined that the CL/P rate per 1,000 births was 0.99 (0.33 for cleft lip [CL] and 0.66 for cleft lip and palate [CLP]). By analyzing 39 population-based datasets during 2007–2011, Mai et al.6 reported that the CL/P rate per 1,000 livebirths was 1.45 (0.31 for CL, 0.59 for cleft palate [CP], 0.56 for CLP).
On the basis of an incidence study on East Asian patients with CL/P, Koga et al.7 reported that the incidence of CL/P per 1,000 births in Japan was 1.32 (0.42 for CL, 0.28 for CP, and 0.62 for CLP) and the distribution was 32% with CL, 21% with CP, and 47% with CLP. According to Lei et al.4 and Chang et al.,5 the incidence of CL/P in Taiwan was 1.37 to 1.43 per 1,000 births (0.97–0.99 for CL with/without CP, and 0.4–0.49 for CP only) and the distribution was 66.9% to 70.7% for CL with/without CP and 29.3% to 33.1% with CP only.
Analysis of data from several countries that have national oral cleft registries or centralized hospital systems showed a decrease in the prevalence of oral clefts because of early prenatal detection of CL and CLP and legal termination of pregnancy as well as the increased use of folic acid for reducing cleft risk.458 However, regarding the prevalence of CP alone, studies have reported contradictory results including declined prevalence,4 slightly increased of rate,5 and significant rate change.8
In Korea, on the basis of an analysis of hospital-based data for 20 years, Shin et al.9 reported that the incidence of CL/P was 1.33 per 1,000 livebirths (0.51 for CL, 0.33 for CP, and 0.48 for CLP) and the distribution was 38.6% with CL, 36.4% with CLP, and 25% with CP. In a study on Korean young adult males born in 1979 in the four largest cities, Baik et al.10 estimated that the prevalence of CL/P was 0.65 per 1,000 samples (0.26 for CL, 0.03 for CP, and 0.36 for CLP) and the distribution was 39.9% with CL, 4.9% with CP, and 55.2% with CLP. In addition, Baek et al.11 reported that the distribution of CL, cleft lip and alveolus, CP, and CLP was 7.6%, 19.2%, 9.6% and 63.6%, respectively, in patients undergoing orthodontic treatment at Seoul National University Dental Hospital during 1988–1999. Although these studies reported the incidence of CL/P, they were based on data limited to a specific hospital, sex, or location.
Since 1989, claims for primary surgical treatment of patients with CL/P in Korea have been centralized to the Korean National Health Insurance Service (KNHIS). Kim et al.12 estimated that the incidence of CL/P in 1993 was 1.81 per 1,000 and the distribution was 34.1% with CL, 35.8% with CP, and 30.1% with CLP. On the basis of an analysis of the KNHIS data during 2005–2006, Kim et al.13 reported that the incidence of CL/P was 3.9% of all birth defects and 1.11 per 1,000 livebirths, without mentioning the ratio of cleft types. However, there is no consensus regarding whether the degree of health care utilization among patients with CL/P in Korea has remained constant or has changed during the last decade.
Although Korea does not have a national registry yet, this study is, to our knowledge, the first trial aimed at understanding the trend of nationwide incidence/prevalence of oral cleft types by using the KNHIS data. If the KNHIS data could be reorganized to count a specific patient only once for a specific year, it could be regarded as a substitute for population-based epidemiologic data in Korea.
Furthermore, the KNHIS is set to provide insurance benefits for orthodontic treatment to patients with CL/P from late 2018. Therefore, the purpose of this study was to investigate the trend of health care utilization among patients with CL/P during 2007–2016 by using the KNHIS data.
MATERIALS AND METHODS
Collection of primary data
The KNHIS data covers primary cheiloplasty, palatoplasty, or alveolar bone grafting for patients with CL/P. This retrospective epidemiologic study tried to analyze the KNHIS data claimed by medical and dental institutions throughout Korea during 2007–2016. When the data were requested, the KNHIS checked the error of data processing and confirmed the integrity of the data.
The population data were obtained via the website or dataset on demand from the Korean Statistical Information Service (KOSIS) and National Archives of Korea (NAK). According to the KOSIS and NAK data, the number of total new-births in Korea was 4,378,608 and the sum of the annual population in Korea was 500,613,900 during 2007–2016. From these data, we extracted the total population per year, sex-specific population per year, and specific age population during 2007–2016.
Reorganization of the year-based secondary dataset for counting the number of patients with CL/P who used the KNHIS
The original insurance claim data were reorganized to count a specific patient with CL/P only once for a specific year even though he/she visited health care facilities more than one time in the same year. Therefore, the KNHIS provided a year-based secondary dataset for counting the number of patients with CL/P.
Classification of cleft types
The 10th revision of ICD (International Classification of Diseases) and Related Health Problems was used to classify cleft types. Codes including Q35, Q35.1, Q35.3, Q35.5, Q35.7, and Q35.9 were for CP; codes including Q36, Q36.0, Q36.1, and Q36.9 were for CL; and codes including Q37, Q37.0, Q37.1, Q37.2, Q37.3, Q37.4, Q37.5, Q37.8, and Q37.9 were for CLP.
Grouping of patients with CL/P
Cleft type (CL, CP, and CLP), sex, and age at the time of health care utilization were divided into subgroups. The period of 2007–2016 was also divided into the first half (2007–2011) and the last half (2012–2016).
The number and rate of health care utilization among patients with CL/P in all age groups
In order to calculate the rates per 1,000 population of health care utilization among patients with CL/P, the number of patients with CL/P, CL, CP, and CLP per year was divided by the population of the same year and then multiplied by 1,000. The number and rate per 1,000 population of health care utilization according to each cleft type were compared between male and female patients. The average number and rate of CP/L, CP, CL and CLP during 2007–2011 were compared with those during 2012–2016.
Distribution of the number and percentage of patients with CL/P in each age group
The patients were divided into 5-year age groups as follows: “0–4” years old was the first age group, “5–9” years old was the second age group, and the rest of them were grouped into similar 5-year age groups until the age “80” years old. Patients aged above “80” years old were included into a single group. The distribution of the number and percentage of patients with CL/P in each age group was investigated to understand the trend of health care utilization.
The number and rate of health care utilization among patients with CL/P in the new-born group
The rate of health care utilization during the birth year (for new-borns) was calculated as follows: health care utilization number of the new-born group was divided by the birth population of the same year and then multiplied by 1,000.
The rates per 1,000 births in the new-born group during 2007–2016 were compared by sex and cleft type (CP, CL, and CLP). Then, the average rates of CP/L, CP, CL, and CLP in the new-born group from the first half (2007–2011) were compared with those from the last half (2012–2016).
Statistical analysis
Independent t-test, one-way analysis of variance, and multiple comparisons with Tukey's honestly significant difference test were used for statistical analyses. Bonferroni correction was applied to protect from Type 1 error when comparing the number and rate of health care utilization between the first half (2007–2011) and the last half (2012–2016) among the cleft types for both the total and new-born patient populations. The new p-value was the alpha-value (αoriginal = 0.05) divided by the number of comparisons (12): (αaltered = 0.05/12) = 0.0041. The p-values ≤ 0.0041 were considered statistically significant.
RESULTS
The number and rate of health care utilization in the total and new-born patient populations
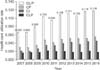
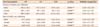
The total number and average rate of health care utilization per 1,000 births in the total patient population were 48,707 and 0.097, respectively (Table 1). The mean utilization rate in the total patient population increased from 0.066 in 2007 to 0.118 in 2016 (Figure 1).
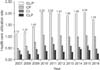
The total number and average rate of health care utilization per 1,000 births in the new-born patient population were 7,617 and 1.74, respectively (Table 1). Although the rate of health care utilization per 1,000 births showed a fluctuation, it increased from 1.12 in 2007 to 1.74 in 2016 (Figure 2).
Comparison of the number and rate of health care utilization between cleft type, sex, and age groups in the total patient population during 2007–2016
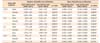
The total patient population comprised 45.3% with CP (n = 22,056), 35.5% with CL (n = 17,268), and 19.2% with CLP (n = 9,383) (Table 1). The annual mean number and rate of the CP group (2,206 and 0.044) were the largest, followed by the CL group (1,727 and 0.034) and CLP group (938 and 0.019) (CLP < CL < CP; all p < 0.001).
In the male population, the composition of CP, CL, and CLP was 38.7%, 38.0%, and 23.3%, respectively (Table 1). The annual mean number and rate of the CLP group were smaller than those of the CP and CL groups (CLP < [CL, CP]; all p < 0.001). In the female population, the composition of CP, CL, and CLP was 52.9%, 32.5%, and 14.6%, respectively (Table 1). The annual mean number and rate of the CP group were the largest, followed by the CL group and the CLP group (CLP < CL < CP; all p < 0.001).
The number and rate per 1,000 population of health care utilization in the total population of patients with CL/P and CP were not different between the male and female patients (all p > 0.05). However, a male-dominant pattern was observed in the CL (994 and 0.040 in males vs. 733 and 0.029 in females; all p < 0.05) and CLP (609 and 0.024 in males vs. 329 and 0.013 in females; all p < 0.001) groups.
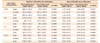
The total annual number of patients with CL/P during the last half (2012–2016) was marginally higher than that during the first half (2007–2011) after Bonferroni correction (5,679 in 2012–2016 vs. 4,062 in 2007–2011; p = 0.0042; Table 2). The annual number of patients with CP and CL during 2012–2016 was significantly higher than that during 2007–2011 after Bonferroni correction (2,613 with CP and 2,099 with CL during 2012–2016 vs. 1,798 with CP and 1,354 with CL during 2007–2011; all p < 0.0041; Table 2). However, the annual number and rate per 1,000 population with CLP were not different between the two periods after Bonferroni correction (966 and 0.019 during 2012–2016 vs. 910 and 0.018 during 2007–2011; all p > 0.0041; Table 2).
Comparison of the number and rate of health care utilization between cleft types and sexes in the new-born group during 2007–2016
New-born patients with CL/P included 51.0% with CP (n = 3,884), 30.4% with CL (n = 2,314) and 18.6% with CLP (n = 1,419) (Table 1). The annual mean number and rate of utilization were the largest in the CP group (388.4 and 0.89), followed by the CL group (231.4 and 0.53), and CLP group (141.9 and 0.32) (CLP < CL < CP); all p < 0.001; Table 3).
In the male population, the composition of CP, CL, and CLP was 40.7%, 36.0%, and 23.3%, respectively (Table 1). The annual mean number and rate were smaller in the CLP group than in the CP and CL groups (CLP < [CL, CP]; all p < 0.001; Table 3). In the female population, the composition of CP, CL, and CLP was 62.0%, 24.4%, and 13.6%, respectively (Table 1). The annual mean number and rate were the smallest for the CLP group, followed by the CL group and the CP group (CLP < CL < CP; all p < 0.001; Table 3).
Although the number and rate of health care utilization of the total patient population in the new-born group were not different between the male and female patients (p > 0.05), the new-born group showed a female-dominant pattern in the CP group (160.3 and 0.71 vs. 228.1 and 1.07; all p < 0.01) and a male-dominant pattern in the CL group (male, 141.7 and 91.8 vs. female, 89.7 and 50.1; all p < 0.001) and CLP group (male, 0.63 and 0.41 vs. female, 0.42 and 0.24; all p < 0.01).
Unlike in the aforementioned total population of patients with CL/P, CP and CL (Table 2), the new-born population did not exhibit a statistical difference in the average number and rate by sex and cleft type between the first half (2007–2011) and the last half (2012–2016) after Bonferroni correction (all p > 0.0041; Table 4).
Comparison of the number and rate of health care utilization according to age groups
Among the age groups, the 0- to 4-year-old group utilized 50.5% of the total health care (n = 24,595). The percentage of utilization in the 5- to 9-year-old group was 15.3% (n = 7,457). The mean utilization rate increased from 0.68 in 2007 to 1.39 in 2016.
The annual number and rate of health care utilization among patients aged 0 to 4 years old during the last half (2012–2016) was higher than those of patients during the first half (2007–2011) (2,924.8 and 1.28 in 2012–2016 vs. 1,994.2 and 0.87 in 2007–2011; all p < 0.01). The annual number and rate of CP, CL, and CLP during 2012–2016 (CP, 1,716.8 and 0.75; CL, 773.4 and 0.34 [all p < 0.01]; CLP, 434.6 and 0.19 [p < 0.05]) were significantly higher than those during 2007–2011 (CP, 1,142.2 and 0.50; CL, 524.2 and 0.23 [all p < 0.01]; CLP, 325.8 and 0.14 [p < 0.05]).
DISCUSSION
To our knowledge, this is the first study to investigate the trend of health care utilization among patients with CL/P in Korea by using the KNHIS data.
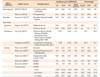
The distribution of cleft types in the new-born group in this study (51.0% with CP, 30.4% with CL, and 18.6% with CLP; Table 1) showed a similar order of cleft types documented in previous studies despite the different percentages (Table 5): Korean (35.8% with CP, 34.1% with CL, and 30.1% with CLP from the KNHIS data)12 and Brazilian (38.4% with CP, 31.1% with CL, and 30.5% with CLP).14 However, the order of cleft types differed in the Korean population (38.6% with CL, 36.4% with CLP, and 25% with CP according to hospital birth records over 20 years)9 and the Japanese papulation (47% with CLP, 32% with CL, and 21% with CP) (Table 5).7 Although the IPTOC workgroup2 and Mai et al.6 investigated international populations, they did not divide the CP and CLP populations (Table 5). Therefore, it is impossible to directly compare their results with those of the present study.
In this study, a difference in sex-dominance was observed between cleft types in the new-born group (a female-dominant pattern in the CP group and a male-dominant pattern in the CL and CLP groups). This finding was in agreement with those of previous studies.61112
The rate per 1,000 births in the new-born group (1.74; Table 1) was within the range of rates described in previous studies using the KNHIS data (1.81 in the study by Kim et al.12 and 1.11 in the study of Kim et al.13; Table 5). However, it was higher than the rates reported in the Japanese (1.32),7 Taiwanese (1.37–1.43),45 and international populations (0.99–1.45)26 (Table 5).
Although the number of births in Korea decreased from 493,189 in 2007 to 406,243 in 2016 according to the KOSIS data, the utilization rate in the new-born group increased from 1.12 in 2007 to 1.74 in 2016 (Figure 2). This phenomenon might be associated with environmental factors, pollution, older first-birth age of mothers, or education regarding CL/P management. The reason should be investigated in more detail by employing sophisticated statistical methods in future studies.
To supplement the limitation of birth incidence (new-born group), we investigated health care utilization among 0- to 4-year-old patients with CL/P. The reason this group accounted for 50% of total health care utilizations seems that primary cheiloplasty and palatoplasty for patients with CL/P are usually performed within 1–2 years after birth. Shin et al.9 reported that 54.3% of primary cheiloplasty was done during 1–3 months, 22.4% during 3–12 months, and 23.5% after a year. Baek et al.11 reported that the majority of primary cheiloplasty was performed during 0–3 months (60.4%) and 4–6 months (17.9%) and the majority of palatoplasty was performed during 0–1 years (25.6%) and 1–2 years (31.7%).
In terms of orthodontic treatment, the following two points have to be considered. First, the present study reported that in the total patient population with CL/P obtained from the KNHIS data during 2007–2016, 19.2% had CLP, 35.5% had CL, and 45.3% had CP (Table 1). However, these values were obtained from the utilization of primary surgery and other procedures. Furthermore, no nationwide orthodontic treatment data are as yet available for patients with CL/P. Since orthodontic treatment coverage by KNHIS will be started in late 2018, it is necessary to investigate whether specific cleft types would more frequently require orthodontic care than would other cleft types under a future insurance system. These data will give important clues for lowering the budget burden and efficiently distributing health resources for orthodontic treatment of patients with CL/P.
Second, the present study estimated that the 0- to 4-year-old group utilized 50.5% of the total health care (n = 24,595) and the 5- to 9-year-old group utilized another 15.3% (n = 7,457). However, considering the age at which patients opt for orthodontic treatment, Baek et al.11 reported that 52% of patients with CL/P visited at the age of 7–12 years old, 20.4% at the age of 13–18 years old, and 10.4% at an age over 18 years old. Therefore, the primary care professionals who take care of 0- to 4-year-old patients with CL/P should interact with orthodontists to provide systematic referral and consultation at the right time for successful multidisciplinary treatment.
The results from this study might be useful for understanding the needs of orthodontic treatment and for designing future health care insurance benefits for patients with CL/P requiring orthodontic treatment. However, this study has several limitations. First, the KNHIS data did not provide any information about still births, aborted fetuses, or syndromic and non-syndromic orofacial clefts. Second, if a patient with CL/P was not physically healthy enough to undergo cheiloplasty and palatoplasty in the year of birth, the utilization number of the new-born patient might not be counted and the frequency of occurrence of clefts in that age group might be underestimated. Third, the accuracy of case ascertainment for cleft types might affect both the incidence and health care utilization among new-born patients with CL/P because of either overestimation or underestimation. 2612 Future studies should consider these issues when the secondary dataset is manipulated by the KNHIS.
 XML Download