Journal List > Korean J Health Promot > v.18(2) > 1098274

Kang, Lee, Shim, and Paik: Gender Analysis of Food Items Selection for Food Frequency Questionnaire Development

Abstract

Background

The aims of this study were 1) to compare foods between men and women with high contributions to absolute intake and the variability in energy and nutrient intakes, which are common criteria of selecting foods for food frequency questionnaire (FFQ), 2) to analyze possible inaccuracies due to not taking gender into consideration.

Methods

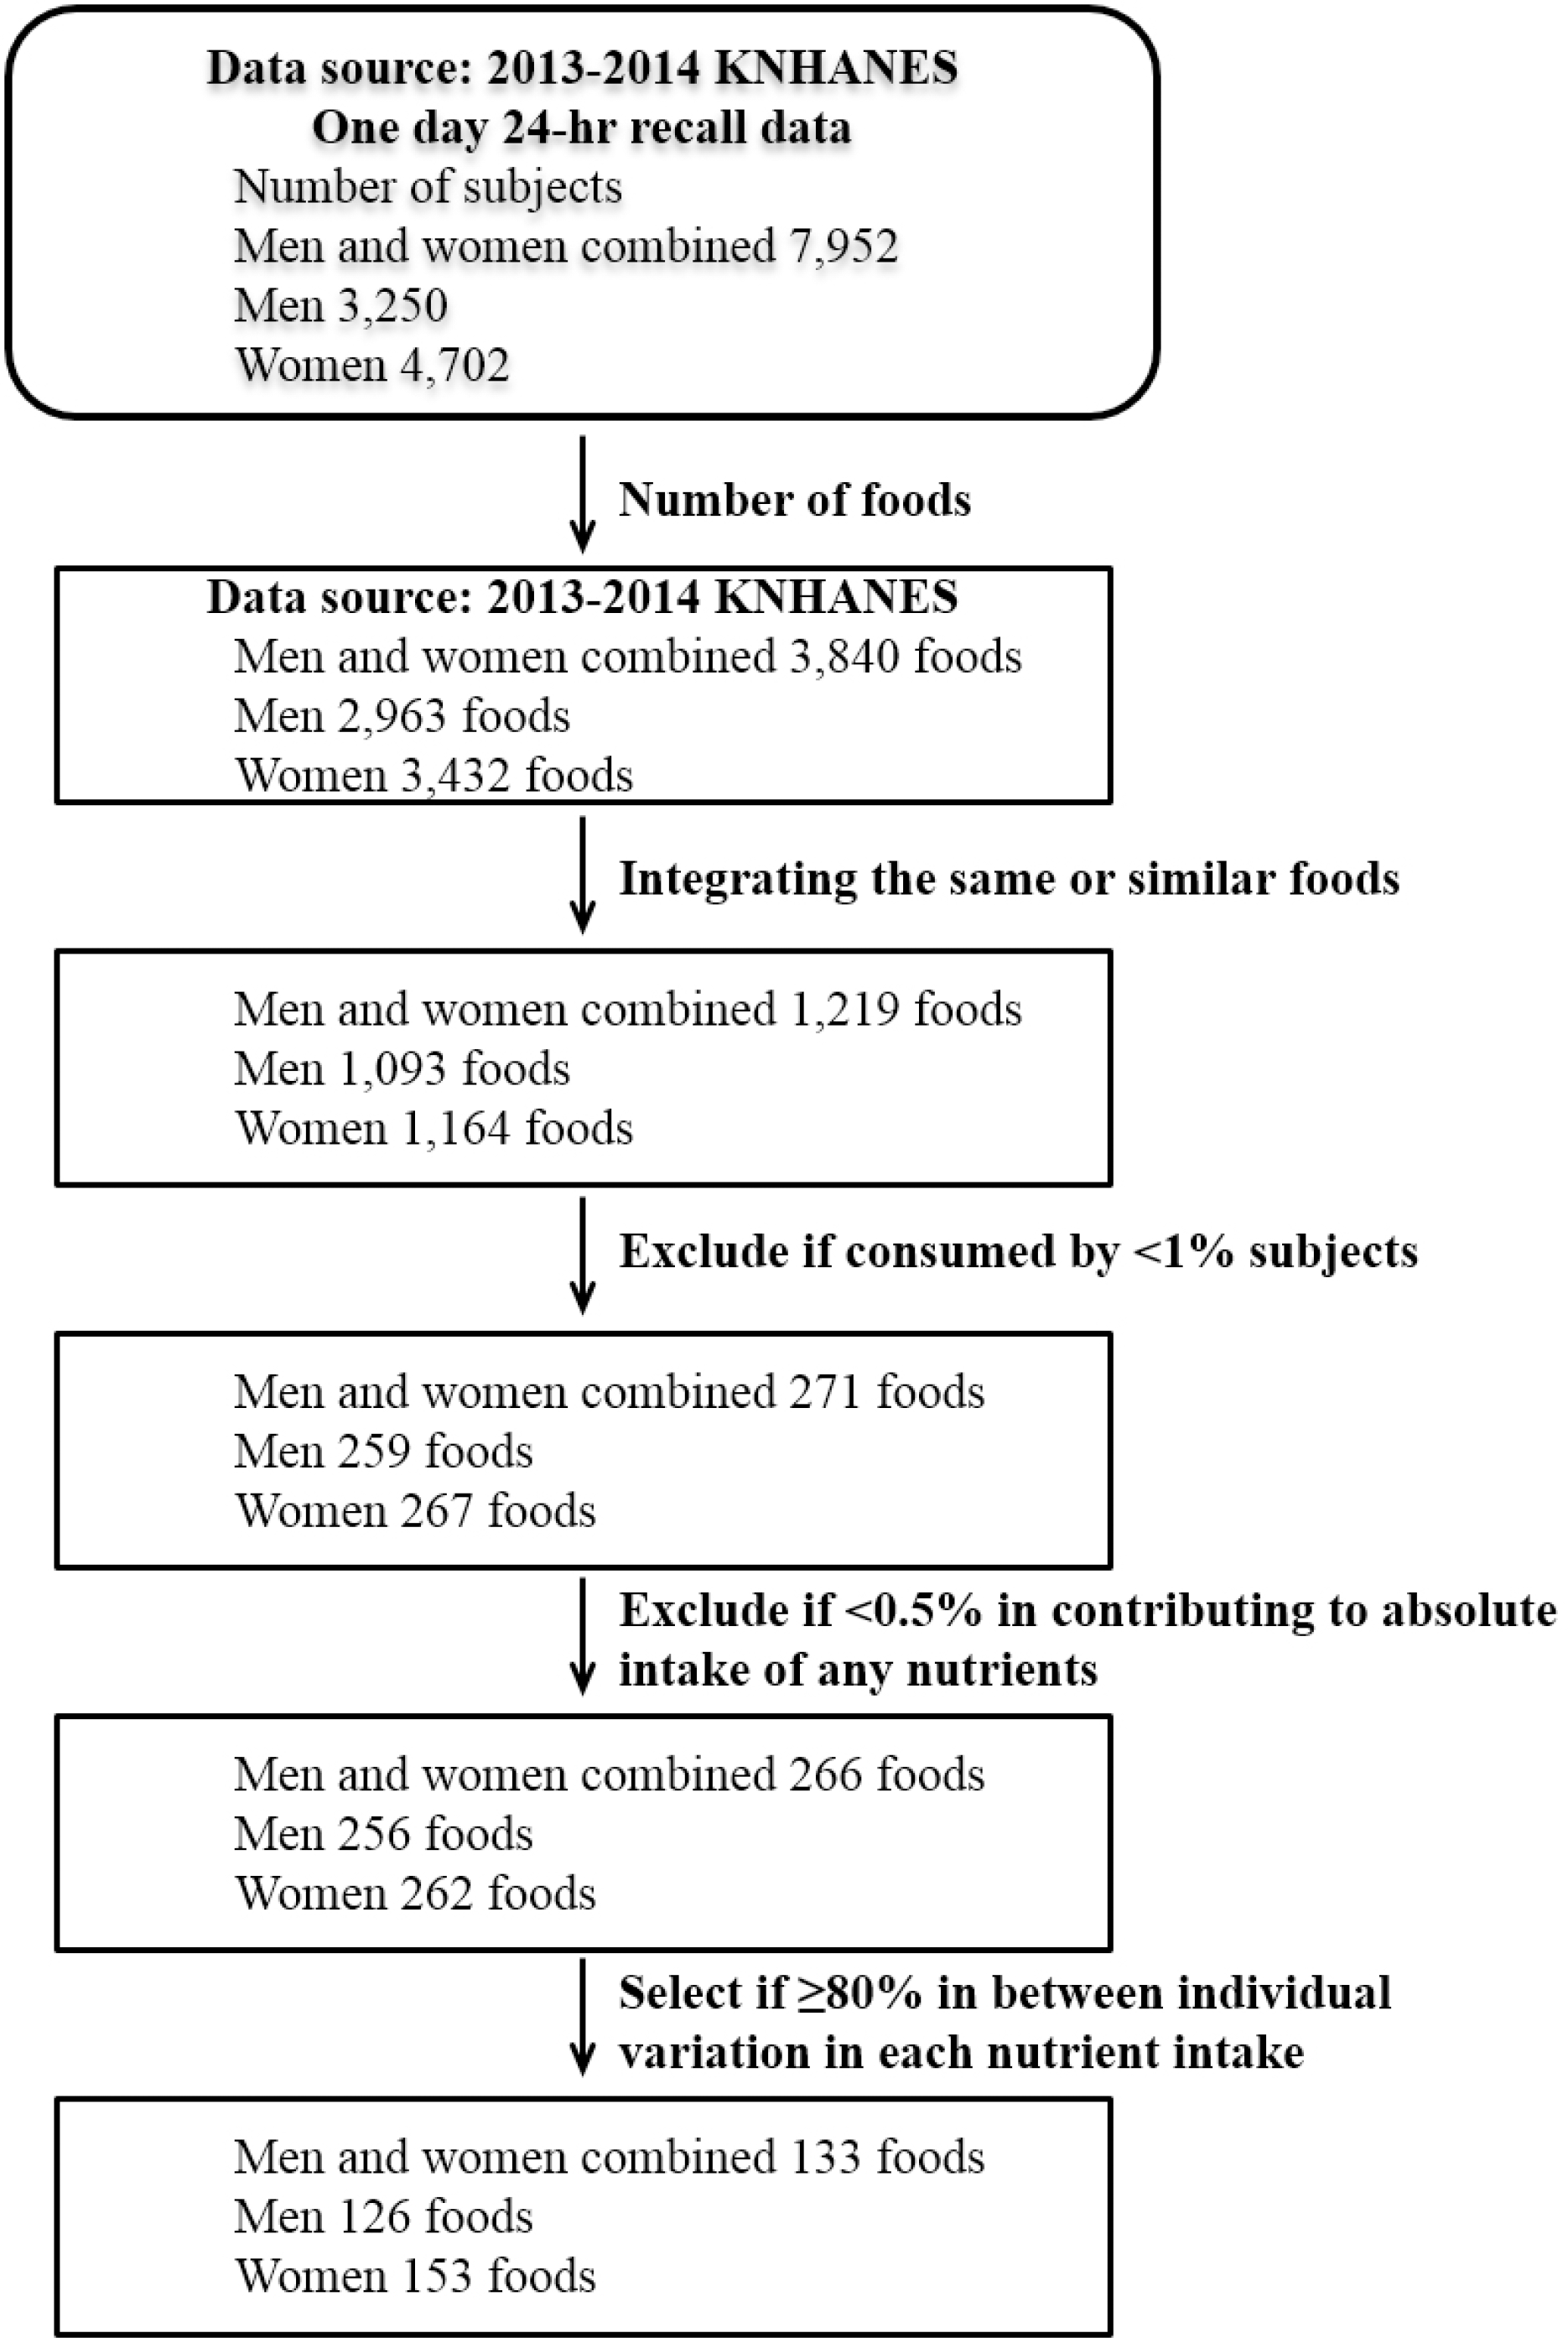
The study used 1-day 24 hour recall data of 7,952 participants (n=3,250 men, n=4,702 women) aged 19–64 years who participated in the 2013–2014 Korea National Health and Nutrition Examination Survey. Foods which have high possibility of being included in FFQ items, called candidate foods, were selected by analyzing their contribution to absolute intake and variability in the intakes of energy and 15 nutrients in total participants, men and women.

Results

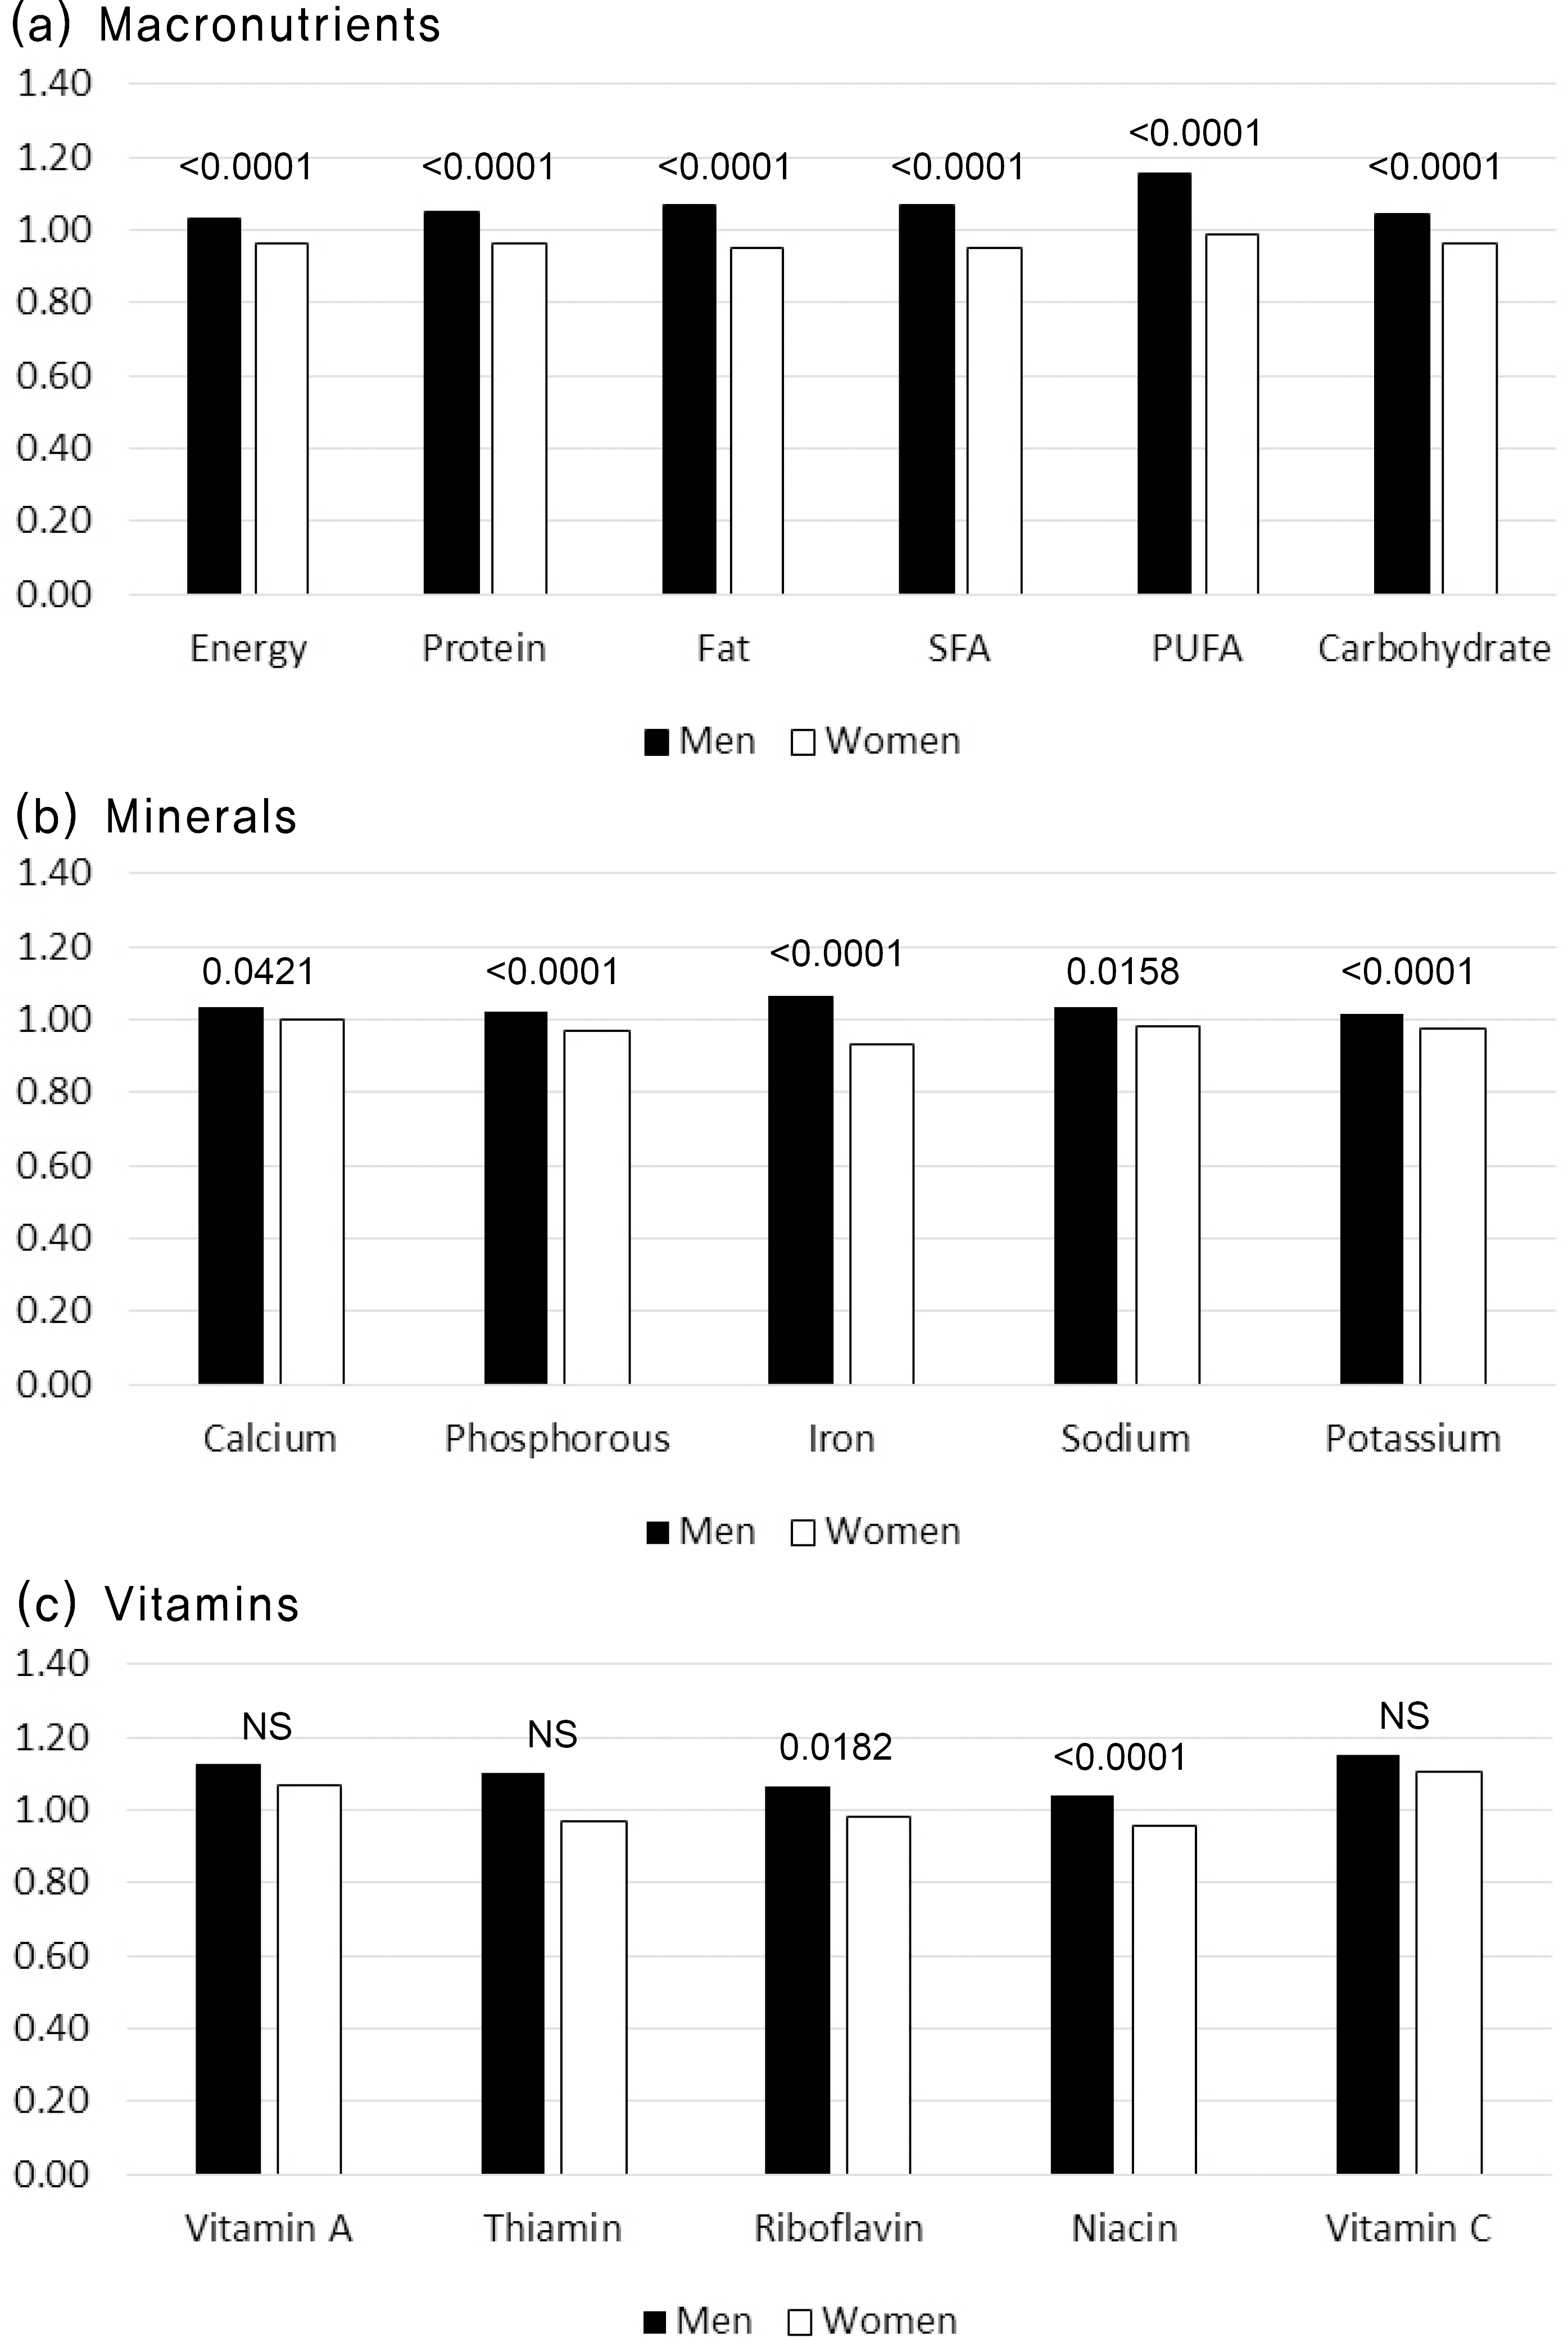
The number of candidate foods selected was 133 for total participants, 126 for men, and 153 for women. Intakes of candidate foods for total participants were significantly higher in energy and six nutrients out of selected 16 nutrients than those of candidate foods for men only. On the contrary, all nutrient intakes of candidate foods for total participants were significantly lower than those of candidate foods for women only.

Conclusions

Differences were revealed between men and women not only in the total numbers, but also in the selected food items from the candidate foods for FFQ. Thus, developing FFQs without considering gender may produce systematic errors in dietary assessment, possibly in different directions for men and women.

References

1. Block G, Dresser CM, Hartman AM, Carroll MD. Nutrient sources in the American diet: quantitative data from the NHANES II survey. I. Vitamins and minerals. Am J Epidemiol. 1985; 122(1):13–26.
2. Block G, Dresser CM, Hartman AM, Carroll MD. Nutrient sources in the American diet: quantitative data from the NHANES II survey. II. Macronutrients and fats. Am J Epidemiol. 1985; 122(1):27–40.
3. Block G, Hartman AM, Dresser CM, Carroll MD, Gannon J, Gardner L. A databased approach to diet questionnaire design and testing. Am J Epidemiol. 1986; 124(3):453–69.
crossref
4. Stryker WS, Salvini S, Stampfer MJ, Sampson L, Colditz GA, Willett WC. Contributions of specific foods to absolute intake and between-person variation of nutrient consumption. J Am Diet Assoc. 1991; 91(2):172–8.
5. Beaton GH, Milner J, Corey P, McGuire V, Cousins M, Stewart E, et al. Sources of variance in 24-hour dietary recall data: implications for nutrition study design and interpretation. Am J Clin Nutr. 1979; 32(12):2546–59.
crossref
6. Ireland P, Jolley D, Giles G, O'Dea K, Powles J, Rutishauser I, et al. Development of the Melbourne FFQ: a food frequency questionnaire for use in an Australian prospective study involving an ethnically diverse cohort. Asia Pac J Clin Nutr. 1994; 3(1):19–31.
7. Park MK, Kim DW, Kim J, Park S, Joung H, Song WO, et al. Development of a dish-based, semiquantitative FFQ for the Korean diet and cancer research using a database approach. Br J Nutr. 2011; 105(7):1065–72.
crossref
8. Hebden L, Kostan E, O'Leary F, Hodge A, Allman-Farinelli M. Validity and reproducibility of a food frequency questionnaire as a measure of recent dietary intake in young adults. PLoS One. 2013; 8(9):e75156.
crossref
9. Lee H, Kang M, Song WO, Shim JE, Paik HY. Gender analysis in the development and validation of FFQ: a systematic review. Br J Nutr. 2016; 115(4):666–71.
crossref
10. Korea Centers for Disease Control and Prevention. The sixth Korea National Health and Nutrition Examination Survey (KNHANES VI). [Internet]. Sejong: Ministry of Health and Welfare;2015. [Accessed June 5, 2018]. Available from:. https://knhanes.cdc.go.kr/knhanes/sub02/sub02_03.do.
11. Overvad K, Tjønneland A, Haraldsdóttir J, Ewertz M, Jensen OM. Development of a semiquantitative food frequency questionnaire to assess food, energy and nutrient intake in Denmark. Int J Epidemiol. 1991; 20(4):900–5.
crossref
12. Yum J, Lee S. Development and evaluation of a dish-based semiquantitative food frequency questionnaire for Korean adolescents. Nutr Res Pract. 2016; 10(4):433–41.
crossref
13. Yun SH, Shim JS, Kweon S, Oh K. Development of a food frequency questionnaire for the Korea National Health and Nutrition Examination Survey: data from the fourth Korea National Health and Nutrition Examination Survey (KNHANES IV). Korean J Nutr. 2013; 46(2):186–96.
crossref
14. Kang M, Jung HJ, Joung H, Shim JE, Lee SE, Park YH, et al. Development of Han-sik database utilizing an expert focus group and assessment of Han-sik effects on diet quality. Korean J Food culture. 2014; 29(1):9–17.
crossref
15. Cade J, Thompson R, Burley V, Warm D. Development, validation and utilisation of food-frequency questionnaires – a review. Public Health Nutr. 2002; 5(4):567–87.
crossref
16. Block G, Hartman AM, Naughton D. A reduced dietary questionnaire: development and validation. Epidemiology. 1990; 1(1):58–64.
crossref
17. Drewnowski A, Henderson SA, Shore AB, Fischler C, Preziosi P, Hercberg S. Diet quality and dietary diversity in France: implications for the French paradox. J Am Diet Assoc. 1996; 96(7):663–9.
18. Jayawardena R, Byrne NM, Soares MJ, Katulanda P, Yadav B, Hills AP. High dietary diversity is associated with obesity in Sri Lankan adults: an evaluation of three dietary scores. BMC Public Health. 2013; 13:314–21.
crossref
19. Kim CW, Kim TH. Study on the food selection by analyzing the correlates of perceptions and consumptions frequency of foods. Korean J Food Culture. 2004; 19(5):524–31.
20. Hong YH. A study of dietary pattern and food preference of unversity students in Gwangju and Chonnam province. Korean J Food Culture. 2008; 23(3):318–27.
21. Blanck HM, Gillespie C, Kimmons JE, Seymour JD, Serdula MK. Trends in fruit and vegetable consumption among U.S. men and women, 1994–2005. Prev Chronic Dis. 2008; 5(2):1–10.
22. Fagerli RA, Wandel M. Gender differences in opinions and practices with regard to a "healthy diet". Appetite. 1999; 32(2):171–90.
crossref
23. Bates CJ, Prentice A, Finch S. Gender differences in food and nutrient intakes and status indices from the National Diet and Nutrition Survey of people aged 65 years and over. Eur J Clin Nutr. 1999; 53(9):694–9.
24. Noh H, Park MK, Lee H, Kim J, Joung H, Paik HY. Reanalyzing sex/gender specific portion sizes of dish items for a dish-based, semiquantitative FFQ for Korean adults. Gender Summit 4 in Europe;. 2014. June 30 – July 01; Brussels.
25. Nishi N, Horikawa C, Murayama N. Characteristics of food group intake by household income in the National Health and Nutrition Survey, Japan. Asia Pac J Clin Nutr. 2017; 26(1):156–9.

Figure 1.
Selection of candidate foods for the food frequency questionnaire (FFQ).a
kjhp-18-98f1.tif
Figure 2.
Ratios of energy and nutrient intakes for the selected candidate foods.a-c
kjhp-18-98f2.tif
Table 1.
Descriptions of 6th (2013–2014) Korea National Health and Nutrition Examination Survey whose dietary intake data were included in the present study
Characteristic Total (n=7,952) Men (n=3,250) Women (n=4,702) Pa
Age, y 43.4±12.4 43.3±12.5 43.5±12.3 0.3736
Age group        
   19–29 years 1,237 (15.6) 523 (16.1) 714 (15.2) 0.4030
   30–49 years 3,830 (48.2) 1,571 (48.3) 2,259 (48.0)  
   50–64 years 2,885 (36.3) 1,156 (35.6) 1,729 (36.8)  
Residential areab        
   Rural 1,385 (17.4) 616 (19.0) 769 (16.4) 0.0005
   City 2,980 (37.5) 1,244 (38.3) 1,736 (36.9)  
   Metropolitan 3,587 (45.1) 1,390 (42.8) 2,197 (46.7)  
Household income, monthly, won
   ≤2,000,000 1,939 (24.5) 717 (22.2) 1,222 (26.1) 0.0009
   2,000,000–3,500,000 2,227 (28.1) 944 (29.2) 1,283 (27.4)  
   3,500,000–5,000,000 1,762 (22.3) 733 (22.6) 1,029 (22.0)  
   >5,000,000 1,988 (25.1) 843 (26.0) 1,145 (24.5)  
Education
   Middle school or less 1,445 (21.1) 461 (17.2) 984 (23.6) <0.0001
   High school 2,722 (39.7) 1,081 (40.2) 1,641 (39.4)  
   College or more 2,685 (39.2) 1,144 (42.6) 1,541 (37.0)  

Values are mean±standard deviation or number (%).

a Differences between men and women were analyzed by t-test for continuous variable and by χ2 test for categorical variables.

b Residential area was categorized as rural area (Eup-Myeon area of the administrative district in Korea), city (Dong area in non-metropolitan cities, such as Gyeonggi-do), and metropolitan area (Dong area in metropolitan cities such as Seoul).

Table 2.
Number of candidate foods selected among total participants, men, and women in the 2013–2014 Korea National Health and Nutrition Examination Surveya
Group Total participants (n=7,952) Men (n=3,250) Women (n=4,702)
Cooked rice 13 11 14
Breads and baked products 7 9 11
Noodles and dumplings 9 7 11
Porridges 1 1 2
Soups 4 4 6
Stews 6 6 7
Steamed food 3 3 3
Grilled food 10 10 10
Pan-fried food 3 3 3
Stir-fried food 5 6 8
Braised food 4 3 2
Fried food 4 4 4
Cooked and seasoned vegetables 4 4 5
Seasoned fresh vegetables of other food 4 5 4
Kimchi 5 5 8
Pickled or preserved food 4 3 4
Seasoning 4 7 3
Milk and milk products 5 4 5
Beverages and tea 10 8 12
Alcoholic beverages 3 3 2
Fruits 11 11 11
Grain, starch and grain products 7 2 9
Legumes, nuts, and seeds 3 2 4
Vegetables and seaweeds 3 3 3
Meat, poultry, and fish 1 2 2
Total 133 126 153

a Candidate foods: foods which have high possibility of being included in food frequency questionnaire items, which were identified as foods with high contribution to total energy and major nutrient intakes as well as foods of major sources of between-person variation in energy and nutrient intakes.

Table 3.
Energy and nutrient intakes from the selected candidate foodsab
Nutrient Men (n=3,249) Women (n=4,699)
From candidate foods of total participantsc From candidate foods of mend From candidate foods of total participantse From candidate foods of womenf
Macro nutrients        
   Energy, kcal 1934.4±929.9 1915.6±921.6g 1343.5±649.7 1399.4±660.4g
   Protein, g 59.4±40.7 59.4±41.3 42.3±27.6 44.2±28.1g
   Fat, g 39.2±37.3 38.8±36.8h 28.0±26.9 29.8±27.5g
   Saturated fatty acid, g 12.2±12.7 12.0±12.4 g 8.6±9.4 9.1±9.6g g
   Polyunsaturated fatty acid, g g 9.2±9.3 9.0±9.1g g 6.8±7.4 7.1±7.4g g
   Carbohydrate, g 284.7±124.7 280.6±122.3g 219.8±105.6 228.4±107.2g
Minerals   g   g
   Calcium, mg 392.7±276.7 389.3±275.1g 322.4±253.1 332.4±247.4g
   Phosphorous, mg 918.7±499.6 917.8±503.1 703.8±426 730.0±429.8g
   Iron, mg 14.1±63.5 13.7±63.5g 10.0±6.6 11.0±7.1g
   Sodium, mg 3240.2±2757.3 3303.2±2742.2g 2187.6±1915 2329.4±1950.5g
   Potassium, mg 2520.1±1421.7 2521.3±1405.3 2120.2±1360.4 2186.7±1380.1g
Vitamins        
   Vitamin A, μgRE 550.2±642.2 526.1±598.2g 457.8±565.8 479.2±579.2g
   Thiamin, mg Riboflavin, mg 1.9±1.1 1.2±0.8 1.9±1.1 1.2±0.8 1.4±0.8 0.9±0.6 1.4±0.8g 0.9±0.6g
   Niacin, mg 13.6±8.8 13.5±9.1 10.2±6.5 10.7±6.6g
   Vitamin C, mg 68.2±97.5 71.3±99.6g 79.9±122.3 81.1±122.6g

Values are mean±standard deviation or number (%).

a Candidate foods: foods which have high possibility of being included in food frequency questionnaire items, which were identified as foods with high contribution to total energy and major nutrient intakes as well as foods of major sources of between-person variation in energy and nutrient intakes.

b Among the participants (men, n=3,250; women, n=4,702), those who did not consume the candidate foods (men, n=1; women, n=3) were excluded from the nutrient intake comparison.

c Nutrient intakes among men calculated from candidate foods of total participants.

d Nutrient intakes among men calculated from candidate foods of only men.

e Nutrient intakes among women calculated from candidate foods of total participants.

f Nutrient intakes among women calculated from candidate foods of only women.

g Nutrient intakes from candidate foods selected for total participants, and for each gender, were compared by paired t-test (<0.001).

h Nutrient intakes from candidate foods selected for total participants, and for each gender, were compared by paired t-test (<0.05).

TOOLS
Similar articles