

 PDF
PDF ePub
ePub Citation
 Print
Print


INTRODUCTION
Cerebral palsy (CP) is a childhood-onset neurodevelopmental disorder that causes severe disabilities, as well as several medical problems other than movement and postural abnormalities throughout the lifetime.12 According to previous studies conducted in other countries, including Sweden, United States, United Kingdom, and Republic of Ireland, socioeconomic status (SES) has an effect on CP occurrence.1,345 Results, however, are controversial when considering confounders, such as prematurity (gestational age less than 37 weeks) and low birth weight (LBW) (birth weight of less than 2500 grams).167 Prematurity and LBW are known as the strongest risk factors of CP and are also associated with SES.89
According to data published by the Statistics Korea, the number of births in Korea has gradually decreased from 490543 in 2003 to 438700 in 2015, and has maintained a lowest-low fertility status, with a total fertility rate at or below 1.30 over the last 10 years. In 2015, the total fertility rate was 1.24, and was the lowest recorded in Organization for Economic Cooperation and Development countries. Based on a report released by the Korean Women's Development Institute, preterm birth rates in Korea increased by about 1.8 times, from 3.2% in 1997 to 5.6% in 2009,10 and the Korea Institute for Health and Social Affairs reported that LBW rate in Korea increased by about two times, from 2.6% in 1993 to 5.3% in 2012. According to this report, the increase in LBW rate resulted from an increasing number of older pregnancies, along with later marriages and multiple gestations associated with the development of assisted reproductive technology.11 Considering the low fertility rate and increment of high-risk pregnancies, it is surprising that no studies have yet reported the incidence of CP in relation thereto in Korea. Furthermore, none have investigated whether SES affects the occurrence of CP and CP risk factors, such as prematurity and LBW. A precise evaluation of the effect of SES on CP incidence is crucial to help establish welfare policies to prevent CP.
Korea operates a National Health Insurance system, which is compulsory and required by Korean law. The National Health Insurance Service (NHIS) is the only public medical insurance institution operated by the Ministry of Health and Welfare in Korea. The NHIS provides universal coverage to all Korean nationals, except for the lower-income group, which is supported by the Medical Aid program. The insured are classified into two groups: employee insured and self-employed insured. The National Health Information Database (NHID) is a public database on health care utilization, health screening, sociodemographic variables, and mortality for the whole population of South Korea, and was formed by the NHIS.12 Using data from the NHID, we investigated the incidences of and recent trends in the occurrence of CP, prematurity, and LBW. We also analyzed the effect of SES on those incidences.
MATERIALS AND METHODS
This study was conducted using data from the NHID for 7 years, from January 1, 2007 to December 31, 2013. We analyzed data related to persons diagnosed with CP at least twice after 24 months of age within this period. Accordingly, data related to CP were analyzed for 5 years, from children born in 2007 to 2011. The disease codes from the International Classification of Disease, 10th edition, related to CP can be found in Supplementary Table 1 (only online). Prematurity and LBW were defined as persons who had corresponding diagnostic codes at least once within a 24-month period after birth.
For the evaluation of SES, data on income quintile, birth region, and coverage classification (employee insured, self-employed insured, or medical aid beneficiaries) were collected on the basis of birth information. Income quintiles of each insured person represent the economic status of persons, and were based on the amount of health insurance payments and then divided into 20 quintiles. Of those, a higher income quintile indicates a higher income. For statistical analysis, the income quintile was divided into five groups; the first group included medical aid recipients and the 0−20% income quintile; second, 21–40%; third, 41–60%; fourth, 61–80%; and fifth, 81–100%. Birth regions and coverage classification were considered to represent social status.
Ethics approval was obtained following project approval by the National Health Insurance Service Ilsan Hospital (NHIMC 2015-02-015). The need for written consent was formally waived by the ethics committee.
Statistical analysis
SAS ver. 9.4 (SAS Institute Inc., Cary, NC, USA) was used for all statistical analyses. Between-group differences (i.e., differences in CP and incidence of prematurity and LBW), in terms of sex, coverage classification, and income group were assessed using chi-square tests, and multiple regression analysis was used to determine the effect of various factors on the occurrence of CP. The level of statistical significance was set at p<0.05.
RESULTS
Overall cerebral palsy incidence
Regarding the overall CP incidence from 2007 to 2011, 0.41% of total neonates were diagnosed with CP in 2007, whereas only 0.25% were diagnosed with CP in 2011, showing that the incidence decreased remarkably over 5 years (Fig. 1). This decreasing trend was similar in male and female children, although the 5-year CP incidence was 1.3 times higher in male than in female children (p<0.05).

Over the 5-year period, 2.14% of neonates were diagnosed with prematurity in 2007, and that number increased to 2.80% in 2011. In regards to LBW, 1.40% of neonates were diagnosed with LBW in 2007 and 2.09% in 2011, showing an increase of around 1.5 times (Fig. 1). When analyzing the history of prematurity or LBW in persons with CP, it was found that the percentage of persons with a history of prematurity had increased over the 5-year period, from 29.8% in 2007 to 37.7% in 2011. Similarly, the percentage of subjects with a history of LBW increased from 22.4% in 2007 to 31.7% in 2011.
Incidences of cerebral palsy, prematurity, and low birth weight according to social status
The incidence of CP was significantly higher for medical aid beneficiaries than for both the employee insured and self-employed categories, between which there was no significant difference. A significantly higher CP incidence in medical aid beneficiaries was found both before and after controlling for confounders, such as sex, income group, prematurity, and LBW [before: odds ratio (OR) 2.64, 95% confidence interval (CI) 2.35–2.97; after: OR 2.41, 95% CI 2.09–2.77]. When evaluating the difference in the incidences of prematurity and LBW according to the coverage classification, the incidences of prematurity and LBW were significantly lower in medical aid beneficiaries (OR 0.76, 95% CI 0.71–0.80 and OR 0.67, 95% CI 0.63–0.72, respectively) (Table 1).
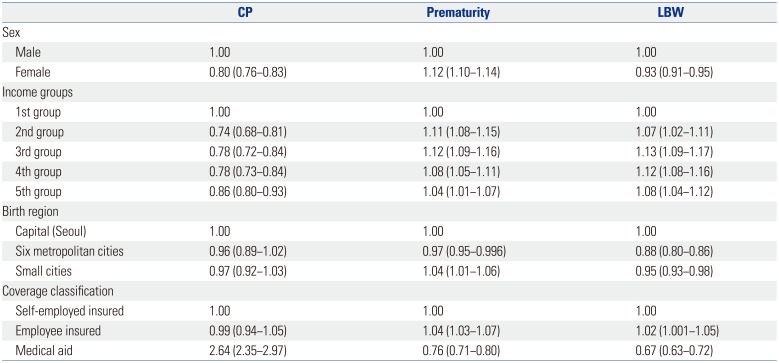
Table 1
Unadjusted Odds Ratios for Associations between Risk Factors and CP, Prematurity, and LBW
![]()
When comparing the incidence of CP according to birth regions, the risk of CP in Seoul, the capital of South Korea, was not significantly different from that in six metropolitan cities and small cities (OR 0.96, 95% CI 0.89–1.02 and OR 0.97, 95% CI 0.92–1.03, respectively). Furthermore, the 5-year incidence had decreased evenly in all regions.
Incidences of cerebral palsy, prematurity, and low birth weight according to economic status
Overall numbers of neonates, CP, prematurity, and LBW according to the five income groups over the 5-year period are presented in Table 2. First, birth rate was lower in the lowest income group. Second, there were significant differences in CP incidence between the income groups (p<0.05). Regression analysis indicated that the CP incidence was significantly higher in the first income group (medical aid and the 0–20% income quintile group) than in all other groups (OR 0.74, 95% CI 0.68–0.81, OR 0.78, 95% CI 0.72–0.84; OR 0.78, 95% CI 0.73–0.84; and OR 0.86, 95% CI 0.80–0.93, respectively, according to the income group order) (Table 1). However, after controlling for confounders, including sex, coverage classification, prematurity, and LBW, this difference became non-significant (Table 3). The CP incidence decreased over time in all the groups (Fig. 2). Third, there were significant differences in prematurity and LBW among the income groups. The incidence of both was lower in the first income group (medical aid the 0–20% income quintile group), compared to all other income groups (Table 1). Fourth, further analyses were conducted to evaluate the relationship between CP incidence and economic status according to the presence of history of prematurity or LBW. After controlling for confounders, the incidence of CP did not show a difference among the income groups, based on whether or not there was a history of prematurity. Similarly, there was no difference in CP incidence among the income groups, based on whether or not there was history of LBW (Table 4).
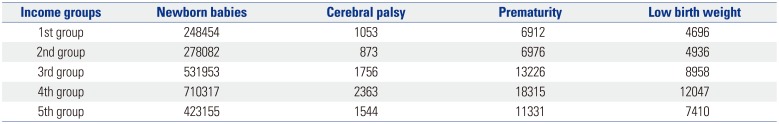
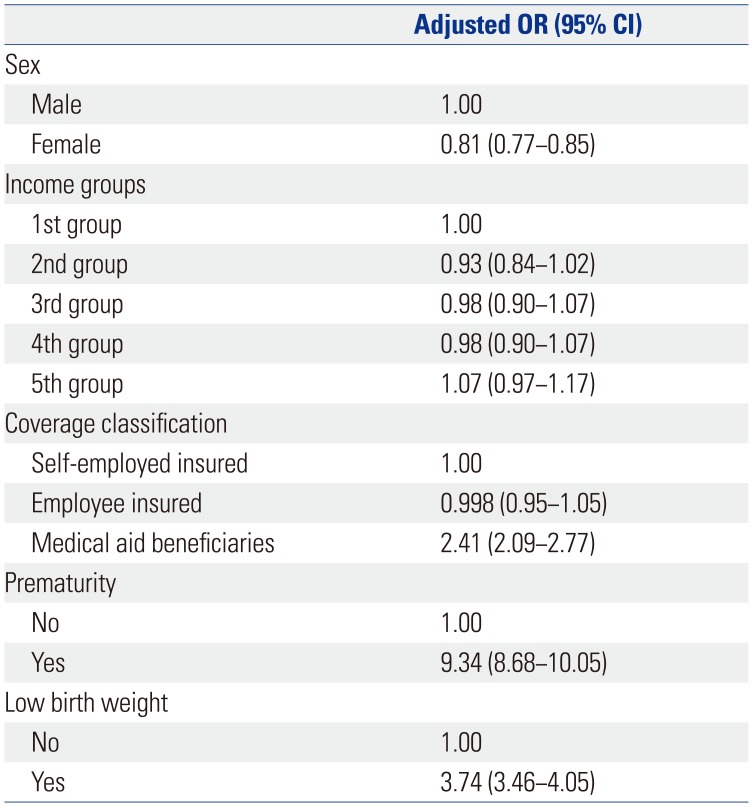
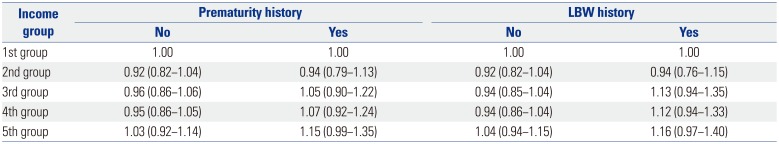
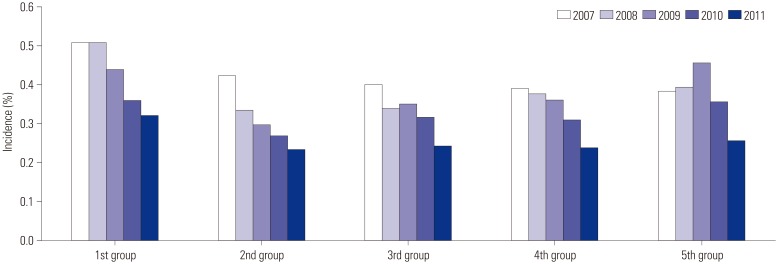
Table 2
Overall Numbers of Children according to Income Groups
![]()
Table 3
Results of Multivariable Logistic Regression Analysis for Associations between Multiple Factors and Cerebral Palsy
![]()
Table 4
Multivariable Logistic Regression Analysis: Relationship between Cerebral Palsy Incidence and Economic Status according to the Presence of History of Prematurity or LBW
![]()
DISCUSSION
Cerebral palsy is a neurodevelopmental disorder that causes serious disability, the strongest risk factors of which are known to be prematurity and LBW. While SES has been found to influence the occurrence of CP, prematurity, and LBW, no studies have investigated this effect in Korea. Hence, we conducted a large-scale study including the nationwide population, based on data from the NHID. The incidence of CP has decreased over the last five years, despite an increase in high-risk deliveries. CP incidence was significantly lower in the affluent groups than the most deprived group, although this difference disappeared after controlling for confounders. However, the incidence of CP was significantly higher in medical aid beneficiaries, even after controlling for confounders, such as sex, income group, coverage classification, prematurity, and LBW.
Our previous study conducted in 2014 using data from the NHID revealed that prematurity had increased by about 1.4 times in the last four years, from 7461 in 2007 to 10519 in 2010, and that LBW had increased by 1.3 times, from 6677 in 2007 to 8580 in 2010 (data not yet published). Over the last 10 years, the birth rate in Korea has reduced and a lowest-low fertility status has been maintained; however, the percentage of high-risk childbirth is increasing. Prematurity and LBW are well known to be the strongest risk factors of CP. Oskoui, et al.13 reported that the incidence of CP had increased along with short intra-uterine periods and/or LBWs. Clark, et al.14 showed that the changing pattern of CP incidence differs in accordance with the intra-uterine period and birth weight. As suggested by the present results, the reducing pattern of CP incidence despite the increment of percentage with a history of prematurity or LBW among the persons diagnosed with CP reflects the high quality of medical services in South Korea, including improved quality of neonatal intensive care.
In this study, CP incidence was lower in the affluent group than in the most deprived group before controlling for the confounders, although the difference was not significant after controlling for the confounders, regardless of whether or not there was history of prematurity or LBW. However, CP incidence was significantly higher in medical aid beneficiaries both before and after controlling for the confounders. There have been several studies concerning the relationship between SES and CP incidence, and the results vary. Durkin, et al.1 reported that spastic CP prevalence was reduced in the affluent group (when SES groups were divided based on the maternal education level), even after correction for the perinatal risk factors such as race, intra-uterine period, and birth weight. Sundrum, et al.6 reported that CP prevalence was high in the most deprived group, although the difference was partially attributable to the difference in the incidences of prematurity and LBW according to SES. Wu, et al.7 revealed that CP prevalence was higher in black children than in white children, although there were no differences in CP incidence between the races after correction of confounders, such as prematurity and LBW. Dolk, et al.15 and Dowding, et al.5 reported that CP prevalence differed in accordance with SES in normal birth weight infants, although the difference was not significant in LBW infants.
The incidence of the strongest risk factors of CP (prematurity and LBW) was high in the affluent groups before controlling for confounders. This trend seemed to be related with increased infertility due to numerous causes, including older pregnancies. Our previous study conducted in 2016 using data from the NHID revealed that the average ages at birth of the mothers were 30.2±3.8 years in 2005, 30.3±3.9 years in 2006, 30.5±3.9 years in 2007, 30.8±4.0 years in 2008, and 30.9±4.0 years in 2009, and it was found that the average maternal age gradually increased (data not yet published). In the case of assisted reproductive technology, the risk of multiple gestations has increased, and the risks of prematurity and LBW have increased in multiple gestations.161718 Infertility is thought to be high in relatively affluent groups, in alignment with the higher education of women, increasing economic activity rate of women, and postponed marriage and childbearing age, sequentially.16 Furthermore, accessibility to assisted reproductive technology is poor for relatively deprived groups, including medical aid beneficiaries, because this treatment is costly.
This study has a few limitations. First, this study was conducted based on data from the NHID, and thus, it may have less accuracy than a population-based registration. Nevertheless, this study is thought to be meaningful, as it reflected the nationwide population of South Korea. Second, information on SES was limited to birth regions, coverage classification, and income quintile; other information that might have represented SES, such as education level of parents, occupation, and number of family members, was not available. Third, the analysis of the use of assistive reproductive technology was not conducted in this study. Further study related to this would be needed.
To conclude, the present study revealed that, over the last 5 years, CP incidence has reduced in South Korea, despite an increase in high-risk deliveries. Prematurity and LBW were confirmed as the strongest risk factors of CP. There was no difference in CP incidence according to income group after controlling for confounders, although CP incidence was high in medical aid beneficiaries. According to these results, support to reduce prematurity and LBW is required at all income levels, and a more effective strategy is needed to prevent CP in medical aid beneficiaries, who appear to be highly susceptible to this condition. These results may be useful for the development of CP management strategies and prevention policies.
 XML Download