

 PDF
PDF ePub
ePub Citation
 Print
Print


INTRODUCTION
The incidence of thyroid cancer continues to increase worldwide, including Korea.12 Papillary thyroid cancer (PTC) usually has a favorable prognosis with an excellent survival rate.12 However, a minority of PTC patients develop locoregional recurrence, including cervical lymph node metastases, and some of them may eventually succumb to the cancer.3 Treatment of PTC employs a three-tiered approach, including surgery, radioactive iodine ablation (RAI), and long-term exogenous hormone replacement.3 Following surgery and RAI, neck ultrasonography and whole-body radioactive iodine scan (WBS) are usually employed to detect residual tumors or metastasis.3 Nowadays, positron emission tomography (PET) using 18F-fluorodeoxyglucose (FDG) has become a standard modality for staging, restaging, and monitoring treatment responses in a variety of tumors.4 However, routine use of PET scans as a work-up is not recommended in thyroid cancer. In PTC patients with high thyroglobulin levels and negative WBS, 18F-FDG PET should be considered in order to detect suspected tumor recurrence or metastasis.3
In the field of oncology, messenger RNA (mRNA) has emerged as a major molecular player in cancer genes, because mRNA is a core part of protein synthesis.5 In cancer, mutated DNA is transcribed into complementary mRNA, which is then translated into malfunctioning cancer protein. However, few studies have investigated the role of mRNA as a prognostic predictor.5 Recently, The Cancer Genome Atlas (TCGA) Research Network Initiative provided a detailed description of the genomic landscape of 509 PTC cases, named the “Integrated Genomic Characterization of PTC.”6
18F-FDG, a glucose analog, is transported to tumor cells via glucose transporter (GLUT) proteins and then phosphorylated by hexokinase (HK).7
123I or 131I are radiopharmaceuticals that are applied in WBS and transported transcellularly to thyrocytes by the sodium/iodide symporter (NIS).8 Therefore, we investigated mRNA expression of these genes, which are connected with FDG PET and WBS, to discern potential prognostic roles of mRNA using PTC data from TCGA.
Go to : 
MATERIALS AND METHODS
Data acquisition and characteristics
The primary and processed data were downloaded from the Genomic Data Commons Data Portal (https://gdc-portal.nci.nih.gov/) in August 2016. All TCGA data were available without restrictions on publications or presentations according to TCGA publication guidelines. We downloaded data regarding somatic mutations, mRNA expression [normalized by RNAseq by the Expectation-Maximization (RSEM) method], and clinical information, which were last updated in May 2016. This process was performed using the ‘cgdsr’ package in R statistical software (The R Foundation for Statistical Computing, 2016). Of the 509 PTC cases, 118 patients in the PTC cohort were excluded. The reason for exclusion were 1) samples from metastatic tissues, 2) patients with not available or - infinite gene expression, and 3) patients with insufficient clinical information (age, sex, stage, BRAF mutation, and RAS mutation). mRNA expression data for NIS (solute carrier family 5 member 5, SLC5A5), hexokinase (HK1–3), glucose-6-phosphate dehydrogenase (G6PD), and glucose transporter (solute carrier family 2, SLC2A1–4) were collected.
Statistical analysis
Disease-free survival (DFS) and overall survival (OS) were analyzed with a logrank test after being divided into two groups with a median mRNA expression value and generation of Kaplan-Meier survival plots. After log2 transformation, Spearman rank correlation analysis was used to determine the association between mRNA expression patterns, and the Mann-Whitney U test was used to compare mRNA expression patterns in PTC patients with or without genetic mutations (BRAF and RAS). Thyroid differentiation score was calculated by averaging the log2 transformed fold change of 16 genes (deiodinase, iodothyronine, type I; deiodinase, iodothyronine, type II; dual oxidase 1; dual oxidase 2; forkhead box E1; GLIS family zinc finger 3; NK2 homeobox 1; paired box 8; SLC26A4; SLC5A5; SLC5A8; thyroglobulin; thyroid hormone receptor, alpha; thyroid hormone receptor, beta; thyroid peroxidase; and thyroid stimulating hormone receptor).9 Statistical analyses were performed using GraphPad Prism 7 for Mac OS X (GraphPad Software Inc, San Diego, CA, USA).
Go to :
RESULTS
Patient characteristics
A total of 391 PTC cases were included in this study (111 males and 280 females; age: 47.2±15.8 years). According to histological PTC types, 273 cases were included in the classical type, 85 in the follicular type, 29 in the tall cell variant, and four in others. Extrathyroidal extension was observed in 114 patients. Median follow-up duration was 30.1 months. Patient characteristics are summarized in Table 1.
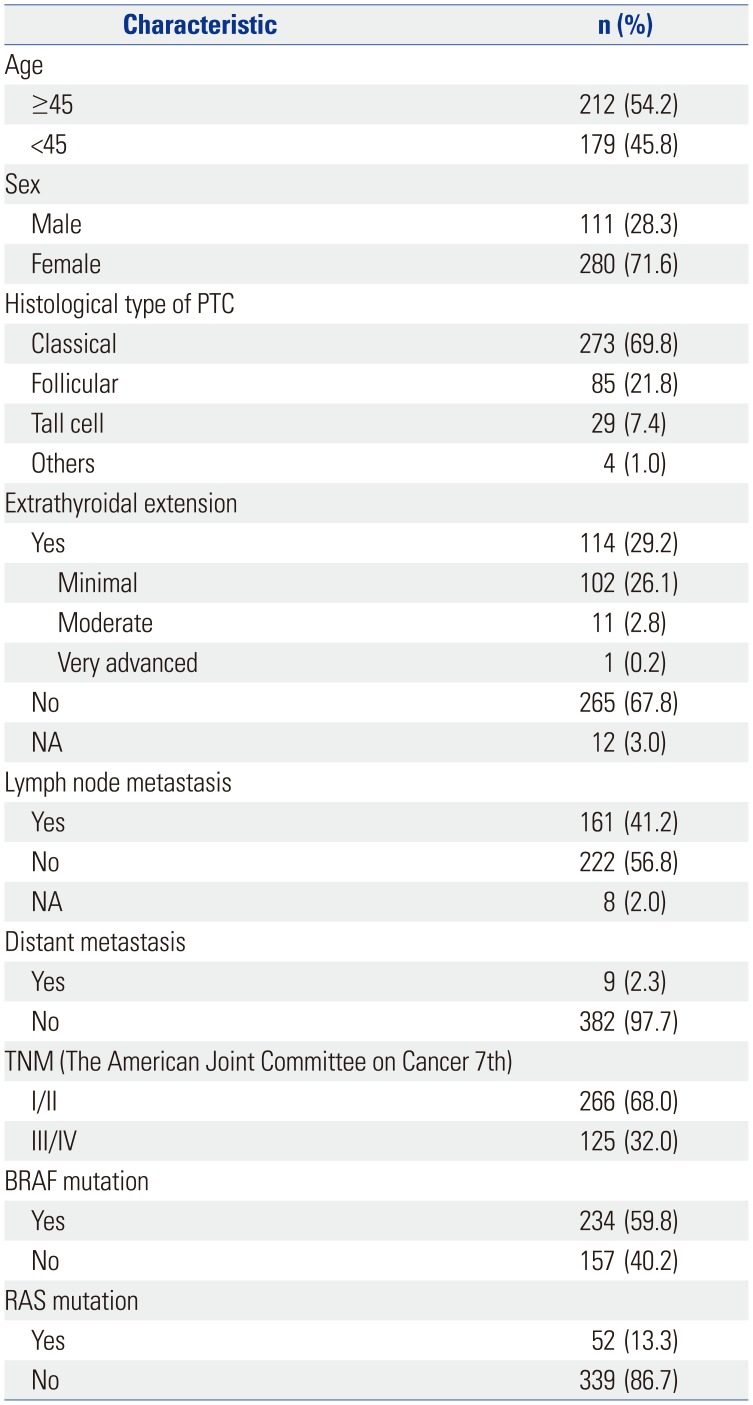
Table 1
Patient Demographics and Clinical Characteristics
![]()
Correlation of mRNA expression of SLC5A5 with other assessed genes
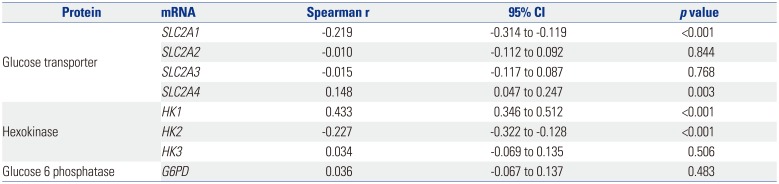
mRNA expression patterns according to thyroid differentiation are described in a heatmap plot of 391 PTC patients (Fig. 1). Among the SLC2 family genes, expression of SLC5A5 mRNA was negatively correlated with that of SLC2A1 (r=−0.2187, p<0.0001) and positively with that of SLC2A4 (r=0.1483, p=0.0033). Among HK family genes, expression of SLC5A5 mRNA was positively correlated with that of HK1 (r=0.4326, p<0.0001) and negatively with that of HK2 (r=−0.2268, p<0.0001) (Table 2, Fig. 2).
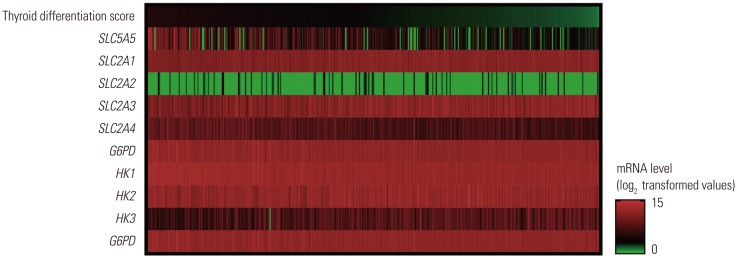 | Fig. 1Heatmap of mRNA expression according to thyroid differentiation score. Genes assessed were SLC5A5, SLC2A1, SLC2A2, SLC2A3, SLC2A4, HK1, HK2, HK3, and G6PD.
|

Table 2
Correlation between mRNA Expression of SLC5A5 and Other Genes Assessed in this Study
![]()
mRNA expression according to genetic mutation status
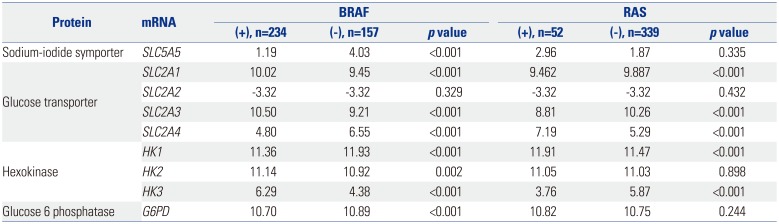
Most mRNA expression patterns were significantly associated with either BRAF or RAS mutation. In PTC patients with BRAF mutation, expression of SLC2A1 (p<0.0001), SLC2A3 (p<0.0001), HK2 (p=0.0018), and HK3 (p<0.0001) mRNA was significantly higher than in PTC patients without BRAF mutations. However, expression of SLC5A5 (p<0.0001), SLC2A4 (p<0.0001), HK1 (p<0.0001), and G6PD (p<0.0001) mRNA was lower in PTC patients with BRAF mutations (Fig. 3). In PTC patients with RAS mutations, expression of SLC2A4 (p<0.0001) and HK1 (p<0.0001) mRNA was higher, and SLC2A1 (p<0.0001), SLC2A3 (p<0.0001), and HK3 (p<0.0001) mRNA expression was lower than in PTC patients without RAS mutations (Table 3, Fig. 4).
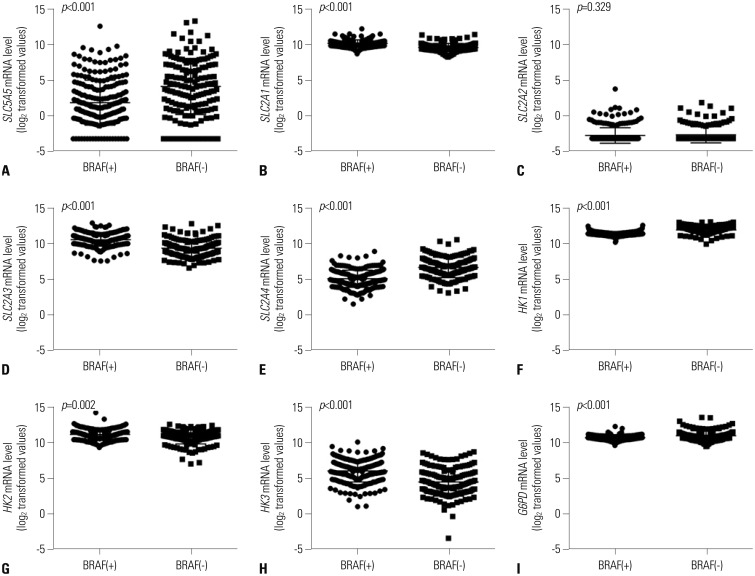 | Fig. 3mRNA expression dynamics according to BRAF mutation status. (A) SLC5A5, (B) SLC2A1, (C) SLC2A2, (D) SLC2A3, (E) SLC2A4, (F) HK1, (G) HK2, (H) HK3, and (I) G6PD.
|
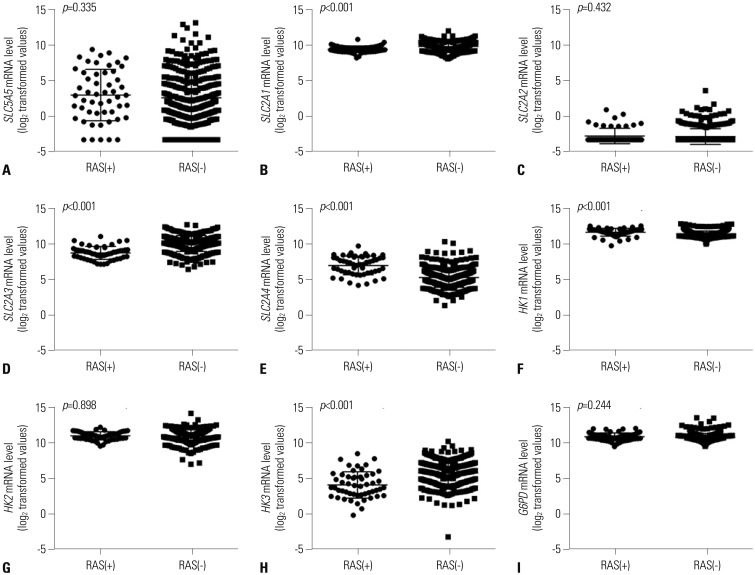 | Fig. 4mRNA expression patterns according to RAS mutation status. (A) SLC5A5, (B) SLC2A1, (C) SLC2A2, (D) SLC2A3, (E) SLC2A4, (F) HK1, (G) HK2, (H) HK3, and (I) G6PD.
|
Table 3
Median mRNA Expression according to BRAF or RAS Mutation Status
![]()
Survival analysis
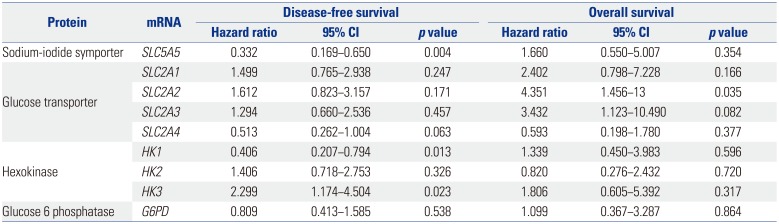
PTC cases with higher expression of SLC5A5 mRNA had a favorable prognosis regarding DFS (hazard ratio 0.3319, p=0.004); however, there was no association with OS (Fig. 5). In addition, SLC2A2 and SLC2A3 mRNA had unfavorable prognosis regarding OS. Among the HK family genes, higher expression of HK1 mRNA was associated with a better prognosis concerning DFS (0.4055, p=0.013), although PTC patients with higher expression of HK3 mRNA showed a worse prognosis in DFS (2.299, p=0.0227) (Table 4).
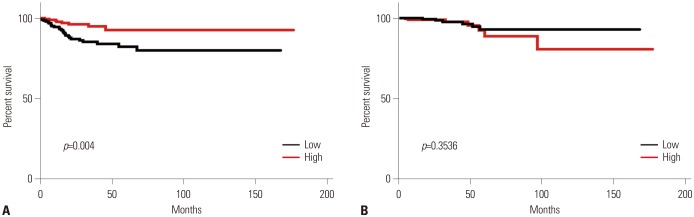 | Fig. 5Survival curves in the context of SLC5A5 mRNA abundance. (A) Disease-free survival and (B) overall survival.
|
Table 4
Survival Analysis according to mRNA Expression
![]()
Go to :
DISCUSSION
In this study, expression of SLC5A5 mRNA was negatively correlated with that of SLC2A1 and HK2 and was positively correlated with SLC2A4 and HK1. During the natural evolution of differentiated thyroid cancer (DTC), either before diagnosis or over the course of treatment and follow-up, there is some loss of the ability to take up iodine owing to diminished SLC5A5 expression. A defective iodide-trapping mechanism due to reduced SLC5A5 expression appears to be an early and consistent feature of the oncogenic transformation of thyroid cells, and is associated with neoplastic transformation.10 This phenomenon is often seen as DTC progresses to the later stages of cancer development, and explains why advanced, high-risk DTC patients have a poorer response to RAI than early-stage DTC patients.11
Among the 14 SLC2A subtypes, SLC2A1 has been most widely investigated in various cancer types, including thyroid cancer, wherein some studies have found increased SLC2A1 expression.1213 Furthermore, adverse effects of SLC2A overexpression on survival outcomes in PTC patients have been implied for associations between SLC2A1 overexpression and tumor aggressiveness or dedifferentiation.1415 The expression of SLC5A5 and SLC2A1 mRNA is related to the accumulation of radioactive iodine (123I or 131I) and 18F-FDG in thyroid cancer cells,16 and the expression of these genes provides a molecular basis for the image modalities of gamma cameras and PET with these radiopharmaceuticals. High glucose uptake measured by FDG PET is associated with low SLC5A5 expression, which indicates dedifferentiation in thyroid cancer.17 This finding is a known phenomenon called “flip-flop” in FDG PET and WBS, which explains the mechanism of how FDG PET detects recurrent or metastatic cancer in patients, but WBS fails to detect tumors,18 consistent with guidelines from the American Thyroid Association.3 As a whole, our findings suggest that SLC2A1 and HK2 expression may be related to BRAF mutation and 18F-FDG uptake of PTC, which leads to cancer aggressiveness or dedifferentiation. Further studies are needed to clarify the relationship among 18F-FDG uptake, the expression of variable glucose transporters, HK2, and BRAF mutations.
Most mRNA expression patterns in this study were significantly associated with PTC genetic mutations. Findings from a previous PTC TCGA showed that BRAF and RAS-like classes of PTC are significantly distinct in regards to differentiation state, and BRAF-like tumors exhibit a gene expression profile associated with a less differentiated state.9 Morari, et al.19 found that 230 DTC patients with a BRAF mutation had reduced SLC5A5 mRNA abundance. In this study, expressions of SLC2A1, SLC2A3, HK2, and HK3 mRNA were higher in PTC patients with BRAF mutations, which might reflect excessive glucose influx required for cancer cell proliferation facilitated by SLC2A,20 a well-known prognostic marker of DTC.21 This study is the first to show an association between mRNA and genetic mutation-prognosis. Our data suggest that mRNA expression helps to characterize a patient's risk and to identify individuals with a poor response to therapy. A larger number of patients with long-term follow-up may also confirm the clinical use of mRNA expression, reinforcing the predictive value of clinicopathological outcomes/markers, such as age and tumor size, as well as molecular markers, such as BRAF mutations.
We demonstrated that the expression of SLC5, SLC2, and HK genes (associated with survival) was associated with BRAF and RAS mutations, a well-known, adverse prognostic factor in PTC.21 The BRAF gene encodes a serine/threonine kinase that belongs to the RAS-RAF-MEK-ERK-MAP kinase pathway, whose biological role is to mediate cellular responses to growth factors.12 Furthermore, we demonstrated that expression of SLC5A5, HK1, and HK3 mRNA was associated with PTC recurrence. Extranodal extension is also associated with poor prognosis in thyroid cancer.22 Our study is the first to show an association between mRNA expression and genetic mutation in cancer prognosis. Our data suggests that mRNA expression may help to determine patient risk and individuals with a poor response to therapy. Ward, et al.23 identified that patients with PTC who experienced early recurrence or metastasis show low expression levels of SLC5A5 mRNA in primary tumors. As expected, SLC2A2 and SLC2A3 mRNA, which are known to be associated with BRAF and RAS mutations, had unfavorable prognosis regarding OS. As lower mRNA expression of SLC5A5 reflects a poorer response to radioactive iodine therapy, it is reasonable that this population of patients have favorable prognosis in DFS. However, mRNA expression of SLC5A5 did not affect OS, as PTC is perceived to have a high survival rate, with a minority of patients showing recurrence or metastasis.24 A larger number of patients with long-term follow-up may also confirm the clinical use of mRNA expression, reinforcing the predictive value of well-recognized clinical and pathological predictors of outcome.
Despite a vast amount of genetic and epigenetic information, the absence of solid prospective studies on thyroid cancer and information on the relationships among clinical, pathological, and genetic factors makes it difficult to discern the prognostic role played by genetic mutations.5 The molecular characterization of thyroid cancer has begun to influence its diagnosis and treatment landscape. Gene expression analysis might also be clinically useful in the near future. In this study, we found evidence for the genetic basis of 18F-FDG PET in PTC patients with negative WBS with RAI and the prognostic value of SLC5A5 in PTC. Additionally, there is a demand for new drugs for PTC refractory to standard treatment with RAI, as the impact of tyrosine kinase inhibitors on survival is not satisfactory and their side effects are often fatal.12 In addition to prognosis, the aforementioned mutations and respective molecular pathways, as well as genetic and epigenetic alterations recently identified by TCGA,9 may serve as likely targets and areas of focus for personalized therapy. Furthermore, drugs inhibiting SLC2A-family genes might have great therapeutic potential by inducing starvation of tumor cells.25 In addition, SLC5A5 expression can be augmented by upregulation of both transcriptional and post-translational pathways. Some isoform-specific signal transduction pathways may play critical roles in tissue-specific SLC5A5 regulation. Delineation of such signaling pathways may lead to methods that will further enhance functional SLC5A5 expression in DTC, thus expanding the application of RAI to RAI-refractory PTC.26 We could not analyze the other important genes related to iodine metabolism due to lack of data. In addition, we could only analyze expressions of mRNAs, not those of proteins. Further studies are needed to investigate the expression levels of proteins between SLC2A family and SLC5A5.
In conclusion, expression of SLC5A5 mRNA was negatively correlated with SLC2A1. This finding provides a molecular basis for the management of PTC patients with negative WBS using 18F-FDG PET scans. In addition, higher SLC5A5 mRNA expression was associated with less frequent recurrence or metastasis, but not with deaths. Moreover, PTC patients with BRAF mutations had reduced SLC5A5 mRNA expression and higher expression of HK2 and HK3 mRNA, which might reflect a less-differentiated state of PTC.
Go to :
 XML Download