

 PDF
PDF ePub
ePub Citation
 Print
Print


INTRODUCTION
METHODS
Patients
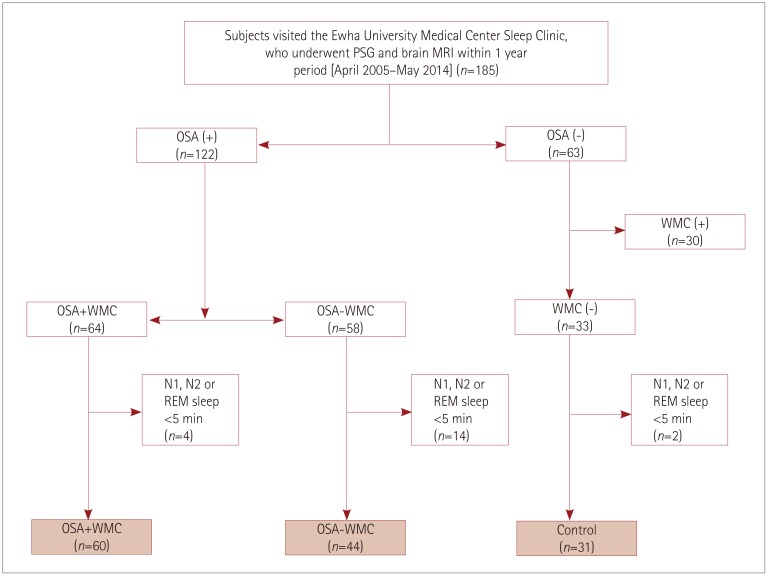 | Fig. 1Flow chart for the selection of the study subjects. Among the patients who visited the Sleep Center of Ewha University Medical Center and underwent overnight PSG between April 2005 and May 2014, 185 patients were selected who underwent brain MRI within 1 year before or after PSG. Sixty-four of the 122 OSA patients had WMC. Thirty-three of the subjects without OSA did not have WMC. Subjects were excluded from the heart-rate variability analysis if the artifact-free and arousal-free periods of their N1, N2, or REM sleep periods were shorter than 5 min on PSG. Finally 135 subjects were included in the current study: 60 were assigned to the OSA+WMC group, 44 to the OSA−WMC, and 31 to the control group. OSA: obstructive sleep apnea, OSA+WMC: obstructive sleep apnea with white-matter changes, OSA−WMC: obstructive sleep apnea without white-matter changes, PSG: polysomnography, REM: rapid-eye-movement, WMC: white-matter changes.
|
MRI protocol and assessment of white-matter changes
Polysomnography
Assessment of heart-rate variability
Statistical analysis
RESULTS
Demographic characteristics and polysomnography findings
Table 1
Demographic characteristics and PSG findings in control subjects, patients with OSA−WMC, and patients with OSA+WMC

p-values were calculated using the chi-square test for categorical variables and analysis of variance for continuous variables. Data are n (%) or mean±standard-deviation values.
*p<0.05 between control and OSA+WMC in post-hoc Tukey test, †p<0.05 between OSA−WMC and OSA+WMC in post-hoc Turkey test, ‡p<0.05 between control and OSA−WMC.
AHI: apnea-hypopnea index, AI: arousal index, BDI: Beck Depression Inventory, BMI: body mass index, ESS: excessive daytime sleepiness, HTN: hypertension, n/h: number per hour, NREM: non-rapid-eye-movement, OSA+WMC: obstructive sleep apnea with white-matter changes, OSA−WMC: obstructive sleep apnea without white-matter changes, PSG: polysomnography, RAI: respiratory arousal index, RDI: respiratory disturbance index, REM: rapid-eye-movement, SaO2: oxygen saturation.
![]()
Heart-rate variability findings
Table 2
Analysis of heart-rate variability in control, OSA−WMC, and OSA+WMC groups (selected indices with significant group differences)
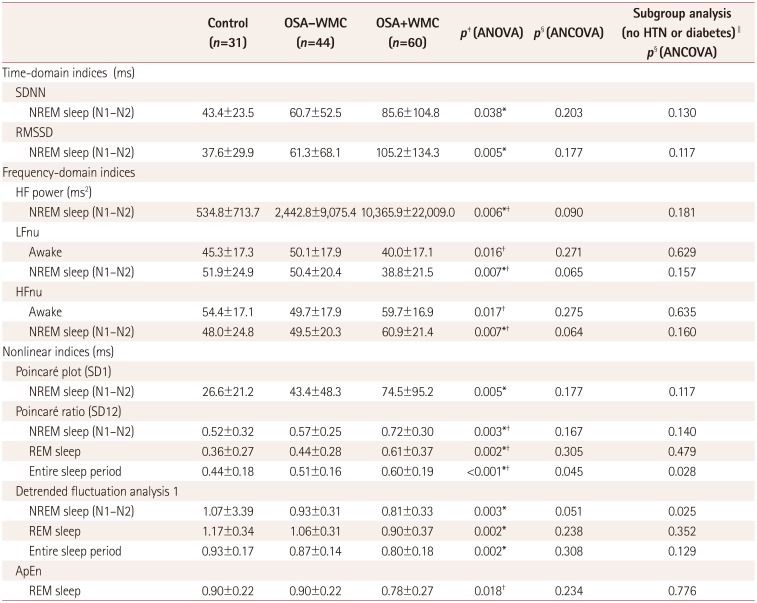
Data are n (%) or mean±standard-deviation values.
*p<0.05 between control vs. OSA+WMC in post-hoc Turkey test, †p<0.05 between OSA−WMC vs. OSA+WMC in post-hoc Tukey test, ‡p-values calculated using ANOVA, §p-values calculated using ANCOVA with age controlled as a covariate, ∥subgroup analysis was performed in subjects who had neither hypertension nor diabetes. There were 24, 33, and 18 subjects in the control, OSA−WMC group, and OSA+WMC group, respectively.
ApEn: approximate entropy, ANCOVA: analysis of covariance, ANOVA: analysis of variance, HF: high frequency, LF: low frequency, NREM: non-rapid-eye-movement, nu: normalized unit, OSA+WMC: obstructive sleep apnea with white-matter changes, OSA−WMC: obstructive sleep apnea without white-matter changes, REM: rapid-eye-movement, RMSSD: root mean square of successive differences, SDNN: standard-deviation of normal to normal RR intervals.
![]()
Subgroup analysis in subjects without hypertension or diabetes
Subgroup analysis in selected age groups
Table 3
Demographic characteristics and PSG findings in selected middle-aged subjects (age 45–64 years) from the OSA−WMC and OSA+WMC groups
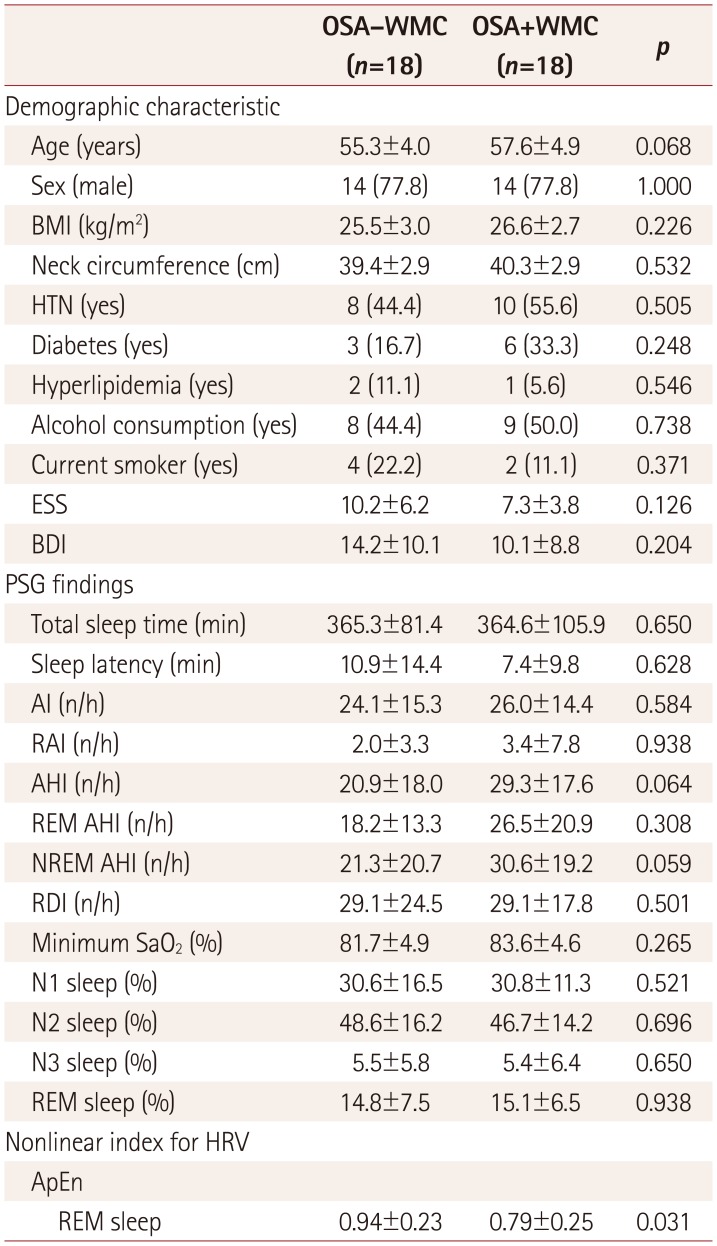
p-values were calculated using the chi-square test for categorical variables and the Mann-Whitney test for continuous variables. Data are n (%) or mean±standard-deviation values.
AI: arousal index, AHI: apnea-hypopnea index, ApEn: approximate entropy, BDI: Beck Depression Inventory, BMI: body mass index, ESS: excessive daytime sleepiness, HRV: heart-rate variability, HTN: hypertension, n/h: number per hour, NREM: non-rapid-eye-movement, OSA+WMC: obstructive sleep apnea with white-matter changes, OSA−WMC: obstructive sleep apnea without white-matter changes, PSG: polysomnography, RAI: respiratory arousal index, RDI: respiratory disturbance index, REM: rapid-eye-movement, SaO2: oxygen saturation.
![]()
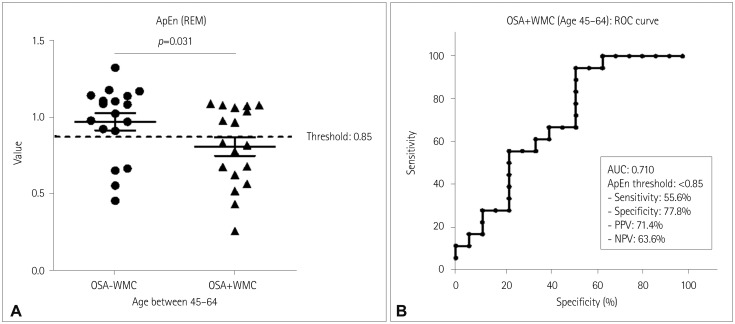 | Fig. 2ApEn values during REM sleep in middle-aged OSA patients (age 45–64 years). A: ApEn values during REM sleep of each subject in the OSA−WMC group (0.94±0.23, n=18) and OSA+WMC group (0.79±0.25, n=18) (p=0.031, Mann-Whitney test). B: ROC curve analysis was performed for diagnosing OSA+WMC among middle-aged OSA patients. The area under the curve was 0.71. With a cutoff of ApEn <0.85, the sensitivity, specificity, PPV, and NPV were 55.6, 77.8, 71.4, and 63.6%, respectively. ApEn: approximate entropy, NPV: negative predictive value, OSA: obstructive sleep apnea, OSA+WMC: obstructive sleep apnea with white-matter changes, OSA−WMC: obstructive sleep apnea without white-matter changes, PPV: positive predictive value, REM: rapid-eye-movement, ROC: receiver operating characteristics.
|
 XML Download