

 PDF
PDF ePub
ePub Citation
 Print
Print


INTRODUCTION
Atrial fibrillation (AF) is recognized as the most common cardiac arrhythmia globally.1) AF is associated with a significant increase in cardiovascular morbidity including stroke; thus, the healthcare and economic burden associated with AF is increasing driven by AF-related complications and treatment costs.2)3)4) Although the prevalence of AF is lower in the Asian population than that observed in non-Asian population, the prevalence and incidence of AF in Asians have shown a marked increase with advancing age.5)6) Additionally, the incidence and prevalence of AF have demonstrated a gradual increase over the last several years in the Korean population, leading to a consistent rise in AF-related medical costs and financial burden.7)8)
Although appropriate anticoagulation therapy could reduce the risk of stroke in patients with AF,9)10)11) those with asymptomatic AF tend to remain unidentified and untreated/undertreated with anticoagulation and might therefore present with stroke as an initial manifestation of AF.12)13) Appropriate screening for AF in at-risk populations and initiation of adequate oral anticoagulation (OAC) therapy based on stroke risk are both necessary to improve the outcomes of patients with AF.14) Regional and socioeconomic differences between patients could influence the screening and management of AF. Prior studies suggest that regional and socioeconomic differences affect the prevalence of AF and stroke, the prescription pattern of OAC, and the clinical outcomes.15)16)17)18)19)20) A few studies have reported an association between regional and socioeconomic differences and the prevalence of AF. Detailed assessment of the differences in the prevalence of AF and utilization of antithrombotic therapy for stroke prevention based on these 2 factors might aid in establishing appropriate healthcare strategies for the management of those diagnosed with AF. Therefore, we aimed to compare the prevalence of AF and antithrombotic therapy utilization in patients with AF based on geographical regions and income levels in the entire Korean population.
METHODS
Data source
Our analyses were based on the health care claim database provided by the National Health Insurance Service (NHIS) of Korea. We performed a cross-sectional study involving adults diagnosed with non-valvular AF based on the 2015 NHIS database. Data was obtained from all Koreans aged ≥20 years in 2015 (n=41,505,679). The NHIS system is a mandatory health insurance program that offers comprehensive medical care coverage to 97% of the Korean population. Of note, 3% of the population with the lowest income is covered by the Medical Aid program. This claim database includes demographic information, diagnoses, and prescription records. This study was exempted from review by the Seoul National University Hospital Institutional Review Board (approval number: 1607-056-775).
Regional and socioeconomic status (SES)
The entire Korean adult population was categorized based on regions and SES. The definition of urban, suburban, and rural regions in this study was made based on the administrative district of Korea. Korea is made up of 17 first-tier administrative divisions: 1 special city (Seoul), 6 metropolitan cities (Busan, Daegu, Incheon, Gwangju, Daejeon, and Ulsan), 1 special self-governing city (Sejong), and 9 provinces (Gyeonggi, Gangwon, Chungbuk, Chungnam, Jeonbuk, Jeonnam, Gyeongbuk, Gyeongnam, and Jeju). We had classified 8 cities (Seoul, Busan, Daegu, Incheon, Gwangju, Daejeon, Ulsan, and Sejong) into urban, and 9 provinces into suburban and rural area. SES was categorized based on the health insurance premiums paid, which directly reflect income levels of each individual. In Korea, health insurance premiums are determined by monthly income levels. We divided the population into 20 levels ranging from group 1 (lowest) to group 20 (highest) based on the amount of monthly health insurance premiums paid by individuals. On note, 3% of the total population with the lowest income level was categorized as Medical Aid beneficiaries.
Definition of AF and other comorbidities
The diagnoses in this study were confirmed using the International Classification of Disease, Tenth Revision, Clinical Modification (ICD-10-CM) codes. AF patients were defined as those with 1 or more diagnoses at the time of hospital discharge or 2 or more diagnoses at the outpatient clinic (ICD-10-CM codes, I480–I484, and I489).7) We excluded AF patients with a diagnosis of mitral stenosis (I50, I52, and I59) or the presence of mechanical heart valves (Z952–Z954) to limit the population to non-valvular AF patients. We identified the following comorbid conditions in patients using various diagnostic codes: hypertension, diabetes mellitus, heart failure, prior stroke/transient ischemic attack (TIA)/systemic thromboembolism (TE), prior myocardial infarction (MI), and peripheral artery disease (PAD). Supplementary Table 1 presents the definition of the comorbidities in detail. All definitions of AF and other comorbidities have already been validated by previous studies from the NHIS claim database.7)21)22)23)24)
Assessment of stroke risk and utilization of antithrombotic therapy
The stroke risk of patients was stratified based on the CHA2DS2-VASc score. The CHA2DS2-VASc score was calculated by assigning 1 point each for congestive heart failure, hypertension, age 65–74 years, diabetes mellitus, vascular disease (including prior MI and PAD) and female sex, and 2 points for prior stroke/TIA/TE and for age ≥75 years.14) In patients demonstrating a CHA2DS2-VASc score ≥2, we assessed prescription for the following drugs to determine the rate of utilization of antithrombotic therapy: aspirin, warfarin, and non-vitamin K antagonist anticoagulants (NOACs including dabigatran, rivaroxaban and apixaban).
Statistical analyses
Continuous variables are presented as means with standard deviation, and categorical variables as numbers and percentages. Comparison of continuous variables was performed using the independent t-test, and χ2 tests were used to evaluate differences in categorical variables. Statistical significance was identified using 2-tailed p values of <0.05 for all analyses. We stratified the data based on 17 geographical regions and 21 income levels. Additionally, we compared between urban and suburban/rural regions. The crude prevalence of AF and the demographic pattern as well as the patterns of comorbidities, and antithrombotic therapy prescriptions were assessed across the different regions and income levels. We suggested p value for interaction to evaluate the association effects between prevalence of AF and stroke/TIA/TE by generalized linear models. All statistical analyses were performed using the SAS version 9.3 software (SAS Institute, Cary, NC, USA) and the SPSS version 19.0 software (SPSS Inc., Chicago, IL, USA).
RESULTS
We identified 276,842 patients diagnosed with AF during 2015. The baseline characteristics including demographic data and comorbidities noted in the total study population have been described in our previous study.7) The prevalence of AF in the total adult population was observed to be 0.67% in 2015.
Regional prevalence of AF
The baseline characteristics based on region are presented in Table 1. The prevalence of AF in the 17 geographical regions of Korea that were included in this study is summarized in Figure 1. We noted a regional variation in prevalence, with the lowest prevalence observed in Ulsan (0.49% of 932,446) and the highest in Jeju (1.02% of 486,431) (Figure 1). There was no obvious trend associated with latitude, although the overall effect of region was statistically significant (p<0.001).
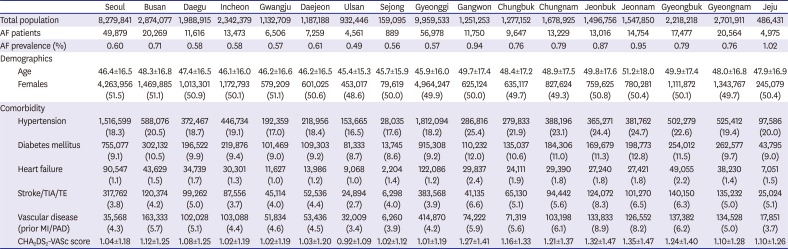
Table 1
Baseline characteristics based on region (urban regions)
Data are shown as mean±standard deviation or number (%).
AF = atrial fibrillation; MI = myocardial infarction; PAD = peripheral artery disease; SD = standard deviation; TE = systemic thromboembolism; TIA = transient ischemic attack.
![]()
Overall prevalence of AF in suburban/rural regions was significantly higher than that observed in urban regions (0.72% vs. 0.61%, respectively, p<0.001). The mean age of the population in suburban/rural regions was higher than that in urban regions (47.8±16.7 vs. 46.6±16.2, respectively, p<0.001), and a larger number of individuals aged ≥75 years was noted in the suburban/rural regions than in the urban regions (7.5% vs. 5.6%, respectively, p<0.001). Hypertension, diabetes mellitus, heart failure, and stroke/TIA/TE were all significantly more prevalent in suburban/rural regions (Table 2).
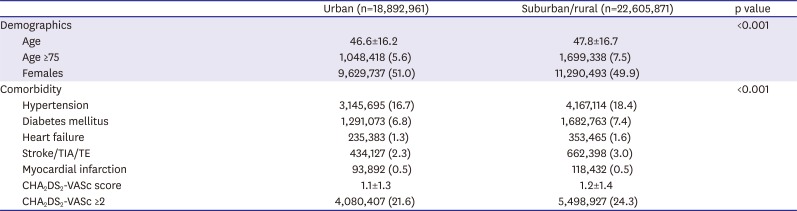
Table 2
Comparison of baseline characteristics between urban and suburban/rural regions
Data are shown as mean±standard deviation or number (%).
TE = systemic thromboembolism; TIA = transient ischemic attack.
![]()
Among the urban regions, Busan showed the highest prevalence of AF. The mean age and the CHA2DS2-VASc score were significantly higher compared to these parameters observed in other urban regions. Comorbidities such as hypertension, diabetes mellitus, and vascular disease were more prevalent in Busan than those noted in other urban regions. Among the suburban/rural regions studied, Jeonnam, Gangwon, and Jeonbuk showed a higher prevalence of AF than the other regions. Corresponding to the higher AF prevalence, patients in these regions were older and showed a greater prevalence of comorbidities and a higher CHA2DS2-VASc score. Although Jeju showed the highest prevalence of AF across the rural-urban regions, the prevalence of concomitant conditions predisposing to AF was not significantly higher in this region compared to other regions.
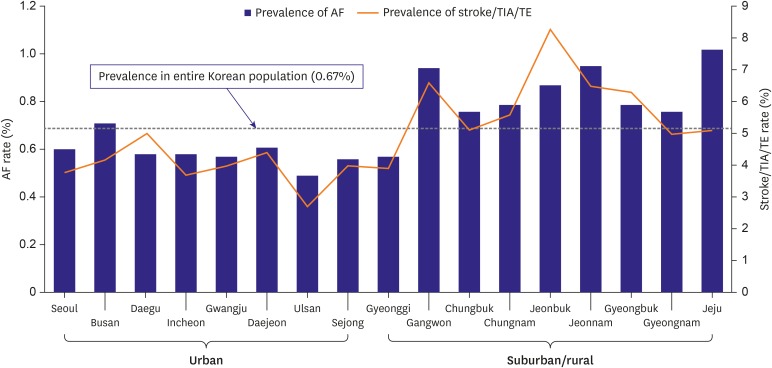
The prevalence of AF and stroke/TIA/TE in each region has been presented in Figure 2. The prevalence of stroke/TIA/TE essentially correlated with AF prevalence (p for interaction=0.05). Overall, the prevalence of stroke/TIA/TE in the suburban/rural regions was also significantly higher compared to that in the urban regions (3.0% vs. 2.3%, respectively, p<0.001).
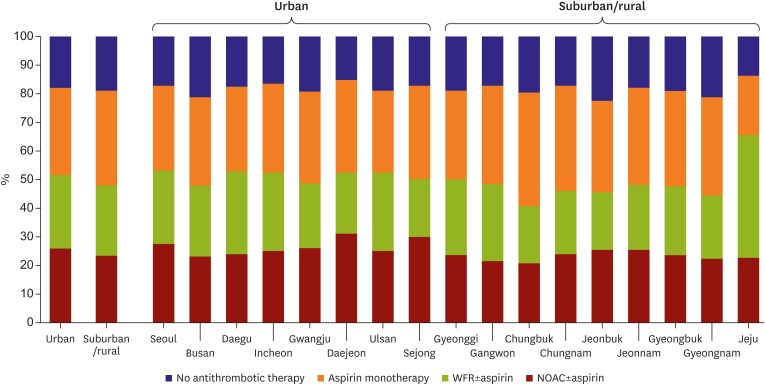
Regional patterns of utilization of antithrombotic therapy in patients with AF with a CHA2DS2-VASc score ≥2
Among the overall population with AF with a CHA2DS2-VASc score ≥2 (n=239,963, 86.7% of the total AF population), OAC was prescribed in 49.7% of patients, and aspirin was prescribed in 31.8% of patients. In patients treated with OAC, 49.9% of patients were received NOACs, and 50.1% received warfarin. Compared to urban regions, suburban/rural regions showed marginally lower OAC utilization (51.8% vs. 48.2%, respectively, p<0.001). As an alternative to utilization of OAC, no antithrombotic therapy (18.9% vs. 17.9%, respectively, p<0.001) and aspirin monotherapy (32.9% vs. 30.3%, respectively, p<0.001) were more common in patients in suburban/rural regions. Among the OAC used, NOACs were more commonly used in urban regions than in the suburban/rural regions (50.7% vs. 49.3%, respectively, p<0.001). The detailed regional patterns of antithrombotic therapy used are presented in Figure 3. Jeju showed the highest OAC utilization (65.6%) across the rural-urban regions, and warfarin accounted for approximately two-thirds of OAC prescriptions.
Prevalence of AF stratified by income levels
The relationship between income and the prevalence of AF was not linear as shown in Figure 4. An extremely low or markedly high income was significantly associated with a high prevalence of AF. Medical Aid beneficiaries showed the highest prevalence of AF (1.77%). From group 1 (lowest income group except Medical Aid beneficiaries) to group 7, prevalence of AF gradually decreased, from 0.76% to 0.44% (p for trend<0.001) and showed a continuous increase until group 20 (highest income group) from 0.44% to 1.06% (p for trend<0.001). Table 3 shows the baseline characteristics according to the income categories. The pattern of distribution of comorbidities including hypertension, diabetes mellitus, heart failure, and vascular disease corresponded to the pattern of prevalence of AF. The relationship between income levels and the prevalence of these comorbidities showed a J-shaped curve in all income groups. The relationship between income levels and the prevalence of stroke/TIA/TE showed a J-shaped curve, and it showed a significant correlation with the prevalence of AF (p for interaction=0.01) (Figure 4). After adjusting age, the risk of AF significantly associated with income levels (p for trend<0.001) and showed a J-shaped curve in age-adjusted odds ratio graph (Supplementary Figure 1).
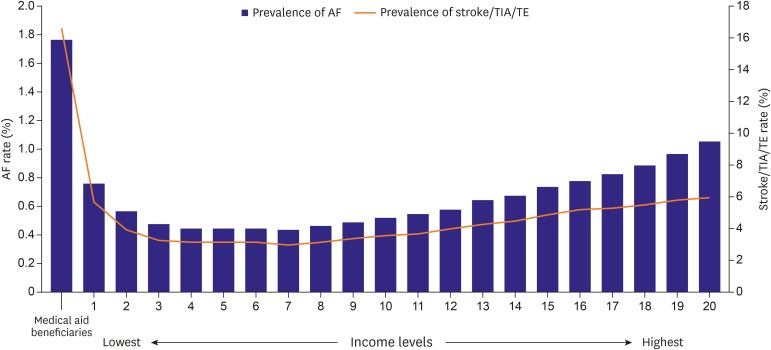
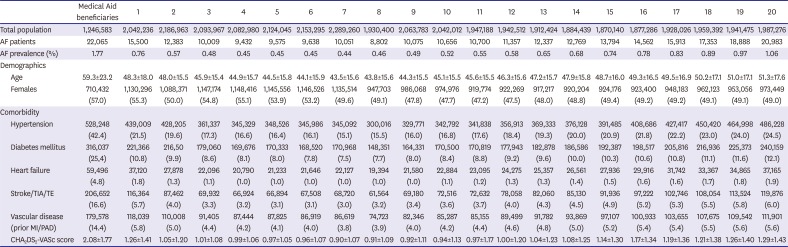
Figure 4
Prevalence of AF and stoke/TIA/TE based on income levels.
AF = atrial fibrillation; TE = systemic thromboembolism, TIA = transient ischemic attack.
![]()
Table 3
Baseline characteristics based on income levels
Data are shown as mean±standard deviation or number (%).
AF = atrial fibrillation; MI = myocardial infarction; PAD = peripheral artery disease; TE = systemic thromboembolism; TIA = transient ischemic attack.
![]()
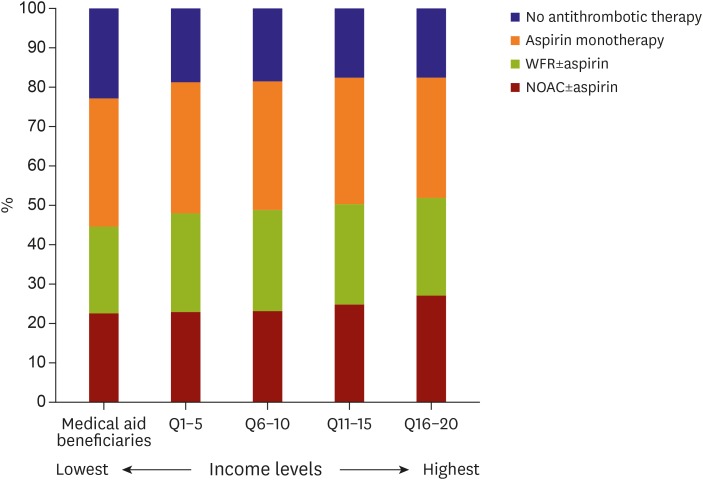
Patterns of antithrombotic therapy utilization based on income levels in patients with AF with a CHA2DS2-VASc score ≥2
The patterns of antithrombotic therapy utilization based on income levels are presented in Figure 5. The percentage of patients who did not use any antithrombotic therapy showed a negative correlation with income levels from the lowest to the highest income levels: 22.9%, 18.9%, 18.6%, 17.7% and 17.6%, respectively. In contrast, OAC use gradually increased from 44.5% to 51.9% in these same groups based on income levels. The rate of aspirin monotherapy utilization did not show a consistent change in pattern based on income levels; however, it was observed to be significantly lower in the highest income group. Among the Medical Aid beneficiaries, almost 50% of the patients received NOAC rather than warfarin for anticoagulation. Other than this population, NOAC tended to be more commonly prescribed in the higher income groups.
DISCUSSION
This is the first study to investigate the differences between the prevalence of AF and the utilization of antithrombotic therapy based on geographical regions and income levels among the entire Korean population. The main findings of this study are: 1) We demonstrated that there was a regional variation in AF prevalence. AF prevalence in suburban/rural regions was significant higher than that observed in urban regions, 2) suburban/rural regions showed lower OAC utilization than that observed in urban regions, 3) income levels and prevalence of AF showed a J-shaped association, and 4) OAC use gradually increased from the lowest to the highest income levels, and NOAC tended to be more commonly prescribed in the higher income groups.
The incidence and prevalence of AF have been rising in the Korean population.7) Despite the development of various strategies for effective management of AF, ischemic stroke-related hospital admissions among AF patients have not shown significant changes over recent decade.8) Identifying those at high risk of AF using an appropriate screening program for AF, and utilizing adequate antithrombotic therapy for stroke prevention are important factors to improve clinical outcomes. However, there is no a population-representative data reflecting regional and socioeconomic differences associated with the prevalence of AF and its management. In our study, we observed that individuals from the suburban/rural areas of the country showed a greater predisposition to the development of AF than those from urban areas. Our data suggest that the higher prevalence of AF observed in suburban/rural areas was secondary to an aging population in those areas and a higher prevalence of comorbidities related to AF development. Previous studies have reported a difference in the distribution of comorbidities such as hypertension, diabetes and other risk factors for AF and stroke between urban and rural areas.25)26) In our study, the suburban/rural population was observed to be older, and showed a higher prevalence of hypertension, diabetes, and heart failure compared to the urban population. The suburban/rural population also showed a higher prevalence of stroke/TIA/TE than that observed in the urban population. Although the etiology of stroke/TIA/TE was not fully categorized in this study, we observed that the prevalence of stroke/TIA/TE was essentially correlated with the prevalence of AF. Additionally, old age, hypertension, diabetes, heart failure, and MI were observed to be risk factors common to AF and stroke.14) Improvements in access to general healthcare facilities and utilization of adequate antithrombotic therapy in AF patient are important for stroke prevention, particularly in suburban/rural areas.
A large regional variation in OAC prescriptions has been observed worldwide.27) Our study also showed a regional difference in OAC prescriptions within a country. Suburban/rural areas showed lower OAC utilization compared to that observed in urban areas despite the comorbidities were more severe in patients in suburban/rural area. The disparities between the 2 geographical regions might be influenced by the accessibility to medical service and healthcare centers, the awareness of importance of OAC on stroke prevention in AF, and the level of income and education. Barrett et al. reported a significant regional variation in the management of AF among emergency departments in the US.16) The rate of hospitalization and electrical cardioversion was analyzed based on different regions in the US. Although this report did not include information pertaining to long-term outpatient practice and OAC prescriptions, it provided insights into the possible causes of regional variations such as differences in patients' underlying comorbidities, SES, and access to healthcare.16)
Previous reports have shown that a lower income level was associated with an overall higher incidence of AF.17) We observed a J-shaped relationship between income levels and the prevalence of AF, and risk factors known to be associated with AF such as old age and comorbidities predisposing to AF might mediate this association. After adjusting age, the risk of AF still significantly associated with income levels. Moreover, the relationship between the prevalence of stroke/TIA/TE and income levels showed a J-shaped curve, and these comorbidities showed a positive correlation with the prevalence of AF.
In our study, the overall rate of OAC prescription was 49.7%, comparable with data obtained from other Asian studies.27) Although recent guidelines recommend the use of OAC therapy in AF patients with a CHA2DS2-VASc score ≥2, these drugs have been generally underused for stroke prevention.11)28)29) Previous studies performed in a Korean population have reported that female sex, old age, and Medical Aid beneficiaries are common predictors for OAC underutilization.28)29) Several reports have discussed the role of SES in determining the choice of antithrombotic therapy for stroke prevention in AF patients.18)19) The Swedish stroke registry data shows that AF patients with a high level of education and income showed a positive association with higher levels of OAC prescription than those with primary school education or low income levels.18) In addition to the OAC prescription rate, the choice of OAC used for the management of AF also differed based on income levels.19) Patients with higher income levels were more likely to switch from warfarin to NOAC compared to those with lower income levels. However, after the addition of NOAC to the formulary, these differences were disappeared. In our study, the crude rate of OAC prescriptions based on income level showed a gradual and not sudden gradient. However, in light of the fact that patients showing a higher stroke risk more commonly belong to the lower income groups, more aggressive intervention is required to manage OAC underutilization in such patients.18)20)
This study had several limitations. First, we observed that the prevalence of comorbidities that predispose to AF such as old age, hypertension, diabetes mellitus and heart failure corresponded to the pattern of prevalence of AF. However, this was a cross-sectional study and we could not identify the causal relationship between the prevalence of comorbidities and AF. Although 1-year cross-sectional cohort could underestimate the total AF population, but active patients with AF could be included and analyzed in this study. Secondly, this study was based on information provided by the claim database and did not include the variables at both, an individual and a regional level, which could affect the prevalence of AF. This was particularly observed in Jeju, where the mean age and prevalence of other comorbidities did not match the significantly higher prevalence of AF. Thus, there could be some factors that remain unclear to date, such as genetic background, presence of obesity, personal habits, and/or the degree of alcohol consumption, and kidney function operating at an individual level, as well as environmental factors operating at a regional level that could explain the higher prevalence of AF in Jeju. Thirdly, the definition of urban, suburban, and rural regions in this study did not include population density, rural unit (proportion of agriculture and/or fishing), and level of urbanization. Although this definition does not represent the level of urbanization, we simplified the definition of regions to make it easier and more understandable. Lastly, we had classified patients based on the resident registration, not on the prescribed hospital. However, there is still possibility of difference between the address of resident registration and actual residence.
In conclusion, prevalence of AF and utilization of antithrombotic therapy showed a significant variation based on geographical regions and income levels. These data may provide further insights for more effective AF surveillance in the general population aimed at better primary stroke prevention strategies in patients diagnosed with AF.
 XML Download