

 PDF
PDF ePub
ePub Citation
 Print
Print


INTRODUCTION
Food allergy (FA) affects the daily lives of both children and parents.1 Symptoms usually occur immediately after accidental exposure to food involved in immunoglobulin E (IgE)-mediated food allergies. Although most reactions can be mild to moderate, they can sometimes be severe and life-threatening as in anaphylaxis. As an accepted curative treatment is not yet available, patients should avoid foods to which they are allergic. The responsibility of avoiding some foods in daily life may affect the quality of life (QoL) in varying degrees. The degree of influence can be measured by health-related quality of life (HRQL) scales.2
Although generic HRQL questionnaires can be applied to all patients, disease-specific questionnaires are more sensitive tools to measure the effect of the disease on patients' life. A few instruments assessing the HRQL have been developed for food-allergic children.34 Although school-aged children complete the questionnaires themselves, assessing the HRQL of infants and young children is difficult because of limitations in cognitive or language skills and low awareness of social difficulties about their disease. In early childhood, QoL can be measured in 2 ways: measuring parents' own QoL or measuring children's QoL from parents' perception. Parents are acutely aware of the restrictions and impact of FA on their children's everyday lives and therefore can provide a valid perspective on HRQL, on behalf of their children. To date, there is only 1 successfully validated scale assessing the food allergy-related quality of life (FARQL) of children below 12 years old from caregivers' perspective. Food Allergy QoL Questionnaire-Parent Form (FAQLQ-PF)5 has also been validated in several languages. Since 3 studies678 have been published so far, data on the FARQL of children from parents' perception aged 0–12 years are limited. As differences exist in the cultural and linguistic structures among populations, validation of previously developed scales according to the language and cultural features of the population is required.
This study was designed to validate and determine the reliability of the FAQLQ-PF in Turkish children and to assess the FARQL in children on this scale.
MATERIALS AND METHODS
Study population
Children between 0 and 12 years, followed-up for IgE-mediated FA for at least one month at the Pediatric Allergy Department, Hacettepe University, between June 2012 and 2014 were enrolled. Diagnosis of IgE-mediated FA was made for patients who fulfilled all of the following criteria: 1) food sIgE level ≥0.35 kU/L and/or a positive skin prick test with food (a wheal ≥3 mm compared with the negative control), 2) consistent and clear-cut history of the early (≤1 hour) and/or repeated symptoms associated with an IgE-mediated reaction upon the food allergen exposure, and 3) positive oral food challenge or a clear-cut history of anaphylaxis with food.9 Children with chronic illness or severe/uncontrolled allergic disease were excluded.
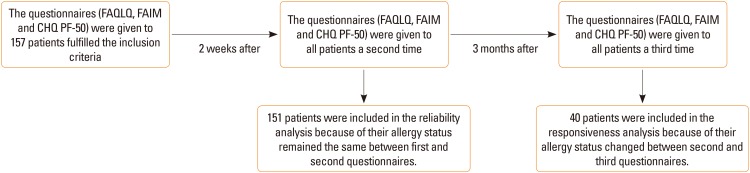
Turkish (T) FAQLQ-PF was given to parents 3 times: first at baseline, second at 2 weeks thereafter, and third at 3 months thereafter. Parents filled in the questionnaires in our department without any intervention by physicians (Figure).
Turkish Child Health Questionnaire-Parent Form 50 (CHQ-PF50), which had previously been validated and cross-culturally adapted to Turkish,10 was given to all parents at the same time with the T-FAQLQ-PF. This survey consists of 14 subscales and 50 items assessing the general QoL of children regardless of the underlying disease.
The clinical and laboratory characteristics of patients and the sociodemographics of parents were recorded. Information about the number and type of food allergies, previous allergic reactions and medications given was obtained from the parents at each visit.
Written informed consent was obtained from all parents. This study was approved by Hacettepe University local ethics committee (IRB No.: B.30.2.HAC.0.20.05.04/430).
T-FAQLQ-PF
The original questionnaire (FAQLQ-PF)5 includes 14 items for children aged <4 years; 26 items for children aged 4–6 years and 30 items for children aged 7–12 years. Each group has 3 subscales: emotional impact “EI” (6, 10, and 8 items), food anxiety “FA” (3, 7, and 9 items), and social and dietary limitations “SDL” (5, 9, and 13 items) for age groups <4, 4–6, and 7–12 years, respectively. The subscale score is calculated by the sum of the raw scores of each item and divided into the number of items. The summary score is calculated by the total scores of the subscales and then divided into 3. The range of summary scores is 0–6; the lower scores indicate the better QoL.
The English FAQLQ-PF was translated into Turkish according to the World Health Organization guidelines through the following steps: 1) Forward translation into Turkish was conducted by 2 independent native Turkish speakers who spoke fluent English. 2) The reconciled version was designed by 2 independent Turkish pediatricians fluent in English. 3) The final version was translated back into English by an independent bilingual translator whose mother tongue is English. The back-translated version was checked by an independent supervisor. 4) Cognitive debriefing, a pre-test face-to-face interview with parents representing the study population, was conducted on 10 parents for each age group. In this stage, no questions were misunderstood or misinterpreted by parents except a few ones. The final version was approved by the survey's copyright owner.
Food Allergy Independent Measure (FAIM), a FA specific questionnaire assessing both parents' and child's concerns about FA from the parents' perspective, is also given to all parents at each visit.
Reliability
The Cronbach's alpha value was measured to determine the internal consistency and reliability of the T-FAQLQ-PF for each age group and each subscale, respectively. The test-retest reliability was determined using the intra-class correlation (ICC) coefficient in the 2 questionnaires conducted 2 weeks apart on parents whose child's allergy status remained the same between the 2 visits. The ICC was also analyzed for each age group separately.
Construct validity
Construct validity was evaluated by the correlation of the T-FAQLQ-PF with the FAIM and CHQ-PF50.
Discriminant validity
Discriminant validity was assessed to determine the sensitivity of the T-FAQLQ-PF to detecting the difference between 2 groups of patients with different allergic statuses.
Responsiveness
The mean changes in the T-FAQLQ-PF scores were compared by an independent samples t test on patients with different allergy statuses between 2 consecutive visits. The patients were categorized into 2 groups according to the current FA status: no change (ongoing all types of food allergies) and change (partial or complete resolution of some/all types of food allergies).
QoL scores
After completing the validity and reliability process of the T-FAQLQ-PF questionnaire, total scores and subscale scores related to food anxiety, emotional impact, and social and dietary limitations were analyzed according to the patients' characteristics. The scores were also calculated separately according to the number and kind of food allergies by different age groups.
Statistical analysis
All data were analyzed using SPSS version 18.0 (SPSS Inc., Chicago, IL, USA). Non-normally distributed variables are presented as median and inter quartile ranges. Normally distributed variables were given as mean and standard errors of mean. For statistical comparison, Mann-Whitney or Kruskal-Wallis tests, where appropriate, was used. Paired samples t test was performed to compare the mean scores of the same groups in 2 consecutive surveys. The Jonckheere-Terpstra test was used to analyze the trend of the scores according to age group. A P value of <0.05 was considered statistically significant.
Cronbach's alpha was used to measure the internal consistency of the questionnaire and calculated separately for each subscale in each age group. A value above 0.70 was considered an acceptable coefficient for reliability analysis. ICC coefficients were calculated to measure the correlation of total scores between the 2 consecutive tests in which the patient's allergic status remains the same.
The scores of the T-FAQLQ-PF subscales with the FAIM and CHQ-PF50 subscales were compared respectively to assess construct validity. Linear regression analysis was performed to assess discriminant validity, which measures the individual effect of the variables on the overall score.
RESULTS
Study population
One hundred fifty-seven patients were enrolled in the study; 97 (61.8%) were aged <4, 35 (22.3%) were aged 4–6, and 25 (15.9%) were aged 7–12 years. The median duration of FA and follow-up were 2 years (0.8–5.1) and 7.2 months (2.6–17.9), respectively. Seventy-seven (49%) patients had multiple food allergies. Ninety-six (61.1%) patients experienced anaphylaxis with food, 60 (62.6%) had moderate/severe anaphylaxis. Among the patients, 70% had at least 1 concomitant allergic disease, such as asthma (31.2%), allergic rhinitis (11.5%) or atopic dermatitis (55.4%). The clinical and laboratory characteristics of patients at admission and first questionnaire are given in Table 1.
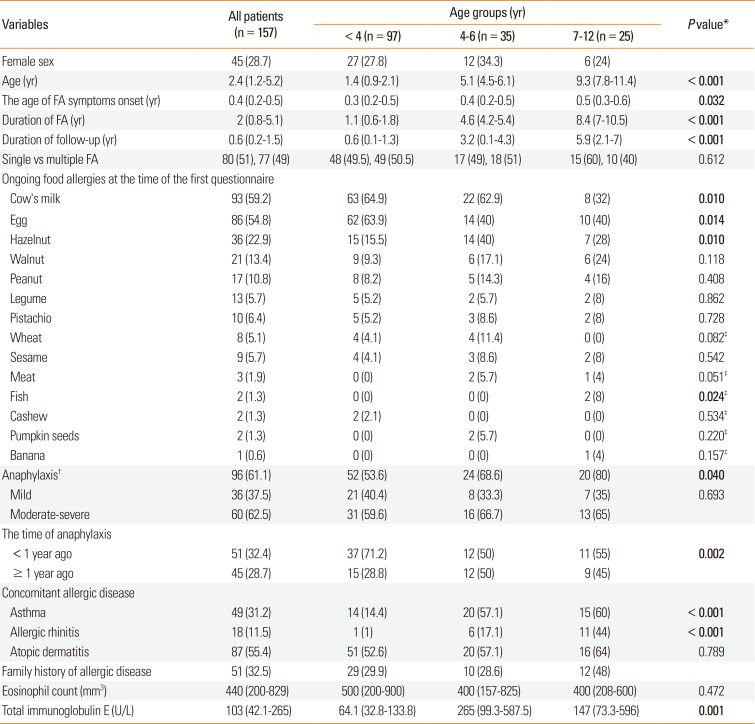
Table 1
Clinical and laboratory characteristics of patients according to the age groups
![]()
Cow's milk and egg allergies were found to be the most common food allergies in young children, and hazelnut and fish allergies were common in older children. The proportion of patients with concomitant asthma, allergic rhinitis, or anaphylaxis was significantly higher in patients aged >4 years than in those aged <4 years. Duration of FA and follow-up period were significantly higher in older patients.
Most of the questionnaires (79.6%) were filled in by the mothers. Sociodemographics of parents are given in Table 2. Educational level and employment status of parents were similar among the age groups of children (data not shown).
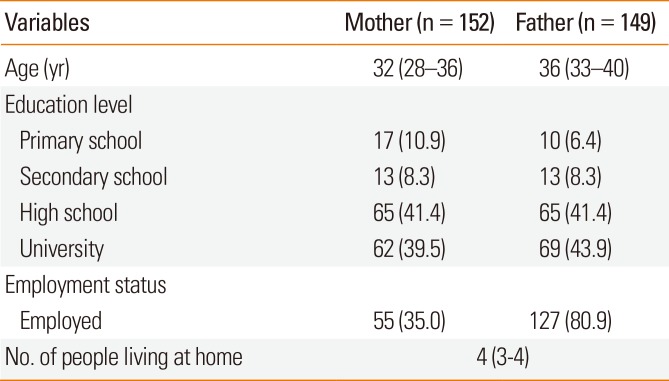
Table 2
Sociodemographic characteristics of parents
![]()
Reliability
One hundred fifty-one participants whose allergy status remained the same between the first and second questionnaires were included in reliability analysis. The Cronbach's alpha coefficient and ICC for test-retest reliability were >0.70 for age groups of children and for all subscales (Table 3).
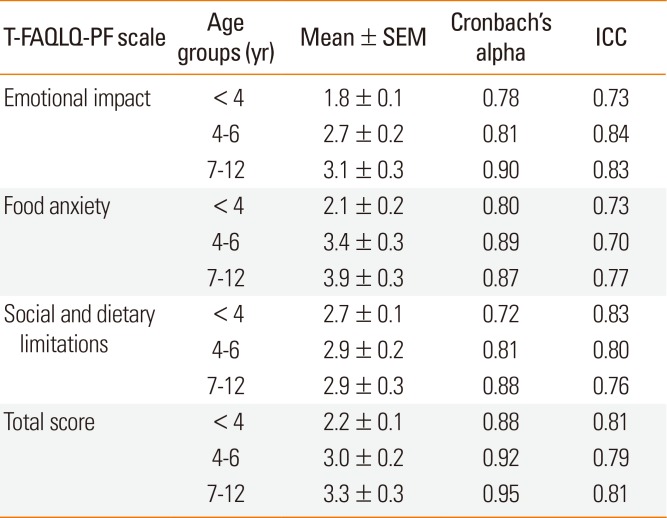
Table 3
Distribution of total and subscale scores and test-retest reliability results according to the age groups
![]()
Construct validity
A positive correlation was found between the T-FAQLQ-PF and FAIM subscales, and a negative correlation was observed between the T-FAQLQ-PF and CHQ-PF50 subscales (Supplementary Table 1). In terms of the questions of the FAIM or CHQ-PF50 surveys, a higher correlation was observed between questions about emotional situation, whereas a lower correlation was found between questions about physical health such as pain. The lowest correlation was found in the question related to the family's ability to get along with each other.
QoL scores
QoL scores shows significant correlations of T-FAQLQ-PF scores with age, cow's milk allergy, anaphylaxis, asthma and mothers' age and education.
Total and subscale scores were calculated according to the patients' characteristics in all 157 patients. The total mean scores were similar between sexes. However, total scores tended to increase with age (2.2±0.1, 3.0±0.2 and 3.3±0.3 for <4, 4–6 and 7–12 years, respectively, P<0.001 and P for trend<0.001) (Table 3). Similar findings were found for subscales EI and FA, but not in SDL (Table 4).
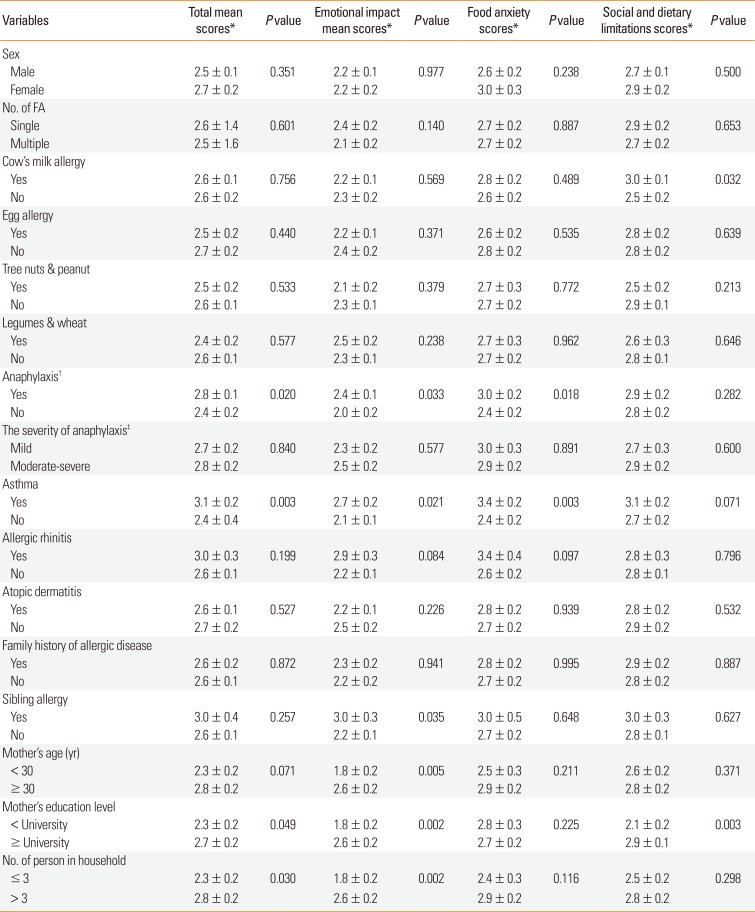
Table 4
Total and subscale mean scores of T-FAQLQ-PF according to the variables
![]()
Baseline total and subscale mean scores were similar between patients with a single FA and those with multiple food allergies. According to the food type, SDL subscale mean score was significantly higher in patients with cow's milk allergy than in those without (3.0±0.1 vs 2.5±0.2, P=0.03). However, this result is not observed in other subscales or total scores and in other food allergens (Table 4).
The mean of total scores was significantly higher in patients with anaphylaxis than in those without (2.8±0.1 vs 2.4±0.2, P=0.02) (Table 4). However, mean scores did not vary by the severity or time of anaphylaxis.
Although asthma was under control in all patients, total and subscale EI and FA scores were significantly higher in asthmatic patients than in non-asthmatics. Mean scores were similar between patients with atopic dermatitis or allergic rhinitis and those without.
The EI mean scores were significantly higher in patients whose mothers were >30 years than in those with younger mothers. The mean scores of EI and SDL subscales and total scores were also significantly higher in mothers who graduated from a university than in others. The mean scores were not affected by age, educational level, and employment status of fathers, and annual income. However, total mean scores and EI subscale mean scores were significantly higher in households comprising ≤3 persons than in those comprising >3 persons (Table 4).
The EI subscale scores were slightly worse when siblings have an allergic disease than when they do not (Table 4). However, the mean scores were not affected by parents' allergy.
Responsiveness showing significant T-FAQLQ-PF score change related with reactivity and tolerance status to the allergic foods
Forty patients were included in the responsiveness analysis because their allergy status had changed between 2 consecutive visits. These patients were observed whether they would tolerate food/food products between 2 visits. The mean total scores were significantly different between 2 consecutive surveys (3.0±0.2 and 2.6±0.2, respectively, P<0.001). In comparing the mean scores of each subscale between 2 consecutive questionnaires with the changing of patients' allergy status, the FA scores were found to be significantly different between the 2 surveys (3.3±0.3 and 2.7±0.3) (P<0.001). The mean scores of EI and SDL were not different between the 2 consecutive questionnaires.
DISCUSSION
The T-FAQLQ-PF is a valid and reliable survey to assess the FARQL in children aged between 0 and 12 years. FARQL deteriorated gradually as age increased and poor QoL was observed in the presence of anaphylaxis, asthma and cow's milk allergy. Other factors causing the poor life quality were found as sibling allergy, mother's age over 30 years, mother's high education level and lower number of person in household.
Limited data are available on FARQL in children aged <12 years. In comparing the total scores of this cohort with those obtained by other studies that used the same scales, FARQL seems to be better in our cohort (2.2, 3.0, and 3.3) than in the sample of DunnGalvin5 (3.6, 3.9, and 4.0 in Irish children; 3.4, 3.7, and 4.0 in American children), but worse in ours than in Wassenberg's cohort6 (1.7, 3.1, and 2.9) according to the age groups of <4, 4–6, and 7–12 years, respectively. These differences may be due to characteristic differences such as age distribution, type or number of food allergens, and disease severity in the cohorts, or the level of awareness across the general public and in food venues.11 Even if most characteristics are similar, disease perception may vary among different countries.
The QoL scores were significantly worse in children 7–12 years than in the younger ones in this cohort. Moreover, the total scores and FA and EI subscale scores, but not SDL subscale scores, tended to increase with age. This increase in impact as age increases has been found in a recent evaluation of norms in the US and Europe.12 In the cohort of DunnGalvin et al.,5 although the SDL scores appeared to be higher in children aged 6–12 than in the younger ones, no statistically significant difference was observed. However, in 2 different studies from France and Japan, QoL scores became worse in older age groups of children.68 The nutrient content of a child's daily diet is predominantly under the control of parents in early childhood, whereas older children can usually choose their own nutritional content or have easy access to different types of food as they grow. Therefore, avoiding foods may be difficult for older children, and this situation may be worrisome for parents or caregivers. We also observed a higher proportion of asthma and anaphylaxis as well as a longer duration of FA in older children than in younger ones. These features may also contribute to their poorer QoL. On the contrary, a recent study found that parental QoL would be better if the child was older.13 Parental thoughts on this issue and influences from their child's FA may vary in different populations.
The mean scores did not differ by sex in all age groups in our study. Although, high scores of the EI subscale were found in the parents of <6-year-old boys and 6-to 12-year-old girls in Irish and US children, respectively, a statistical significant difference was not observed.5 Similarly, no differences between sexes and QoL scores were found in other cohorts.68
Some previous studies showed that children with multiple food allergies have the worst QoL scores compared with those with a single FA.51415 Conversely, other studies found no differences in scores between single and multiple food allergies8 similar to ours. There were differences in the distribution of food allergens and age of children in the cohorts. Other factors such as the type of food allergen may be more important for patients' QoL than the number of food allergens.
Cow's milk and eggs were the most common food allergens in young children, and hazelnut and fish were more common in older children than in younger ones. In terms of the questionnaire scores according to the type of food allergen, significantly high scores were found in the SDL subscale but not in the other subscales in children with cow's milk allergy compared with those without. The mean scores were not different between patients with other food allergens and those without. In some cohorts, children with peanut allergy had significantly higher scores than others,516 whereas another study found no differences, although the proportion of peanut-allergic children was the same in their cohort.6 Another study found children with egg allergy had worse QoL than others.13 Nutritional habits may vary among different populations. In our country, peanut or soya is not often consumed or encountered in daily life. Therefore, parents and children can easily avoid these allergens, and their QoL may not be affected much by these allergens. However, dairy products and cow's milk are major components of children's nutrition in our country, and thus parents or caregivers often encounter these foods. They have to make a great effort to avoid these foods, thereby causing a significant increase in SDL scores. The effect of the same food allergen on QoL may vary in different societies because of the differences in cultural and nutritional behaviors among various populations.
Having anaphylaxis is expected to adversely affect the QoL of patients. In this study, almost 2 out of 3 children had anaphylaxis, and most of them had moderate to severe reactions. We also observed that the proportion of children with anaphylaxis was significantly higher in older children than in younger ones. The QoL scores were the worst in children with anaphylaxis in all age groups. However, the scores were not affected by the severity or time of anaphylaxis. Children with anaphylaxis were especially affected in the subscale scores of EI and FA, but not in the SDL scores. However, evidence of anaphylaxis can lessen the uncertainty and worry about potential reactions, particularly if the reaction is managed well. Similarly, high scores were found in children with severe reactions in some studies.68 Conversely, recent studies from Europe found that experiencing anaphylaxis does not affect QoL in either children or adults.1617 Awareness of anaphylaxis may vary in different populations. Although the degree of anaphylaxis is severe, factors such as carrying the adrenalin auto-injector every time may provide parents with confidence.
Even if asthma is under control, asthmatic patients have the worst QoL scores in this cohort. In previous studies, asthma, controlled or uncontrolled, is associated with poor life quality in food-allergic children.18 Struggling with more than 1 type of allergic diseases could affect QoL adversely. Moreover, QoL scores were worse if siblings had an allergy. Similar findings were found in another study showing high scores in children whose mothers had allergies. The presence of allergic diseases in family members seems to affect QoL.6
Interestingly, high scores were found in patients whose mothers were >30 years old and whose mothers graduated from a university. The QoL scores were not affected by age, educational level and employment status of fathers. In our country, mothers usually take care of their children's nutrition and treatment. Data on mother's age and educational level in FARQL are not available in the literature. One study showed a significant association between mother's age and monotony of diet in food-allergic children.19 As mother's age and educational level increase, awareness about the disease may also increase.
We confirm that this questionnaire is effective in differentiating 2 different allergy statuses. According to our results, starting the consumption of allergic foods seems to immediately affect the FA scores. Social or emotional effects seem to emerge in the later period.
There was a low but acceptable correlation between the T-FAQLQ-PF with the FAIM and the CHQ-PF50. The low correlation may be explained by the fact that CHQ-PF50 is not disease-specific and reflects the general health, especially the physical health of children such as pain or limitation of the movement. On the other hand, in terms of the questions about the emotional or anxiety situations, the correlation was high between the surveys.
In conclusion, the T-FAQLQ-PF is a valid, reliable and a sensitive tool to assess QoL in various allergic statuses. According to our results, FARQL deteriorates with age. Coexistent asthma, anaphylaxis, cow's milk allergy, sibling allergy and the increase in mother's age and education level affect QoL unfavorably. The FARQL may vary according to the different nutrition habits of distinct cultures. The questionnaires should be validated in different societies.
 XML Download