

 PDF
PDF ePub
ePub Citation
 Print
Print


INTRODUCTION
Biofluid lipidome is recently regarded as a source for potential diagnostic biomarkers [1]. Particularly, lipidomics showed a remarkable diversity of lipids in plasma [2]. Septic patients [34567891011] and experimental animals [12] have shown changes in some of the plasma lipids. However, a lipidomic study on extensive plasma lipids in sepsis has not yet been done. Cecal ligation and puncture (CLP) induces the polymicrobial peritonitis, and is regarded as a reliable animal model of sepsis [13]. Thus, in the present study, we examined changes of 147 plasma lipid species from 13 subgroups of lipids, i.e. fatty acid (FA), lysophosphatidic acid (LPA), lysophosphatidylcholine (LPC), lysophosphatidylethanolamine (LPE), phosphatidic acid (PA), phosphatidylcholine (PC), phosphatidylethanolamine (PE), phosphatidylinositol (PI), monoacylglyceride (MG), diacylglyceride (DG), triacylglyceride (TG), sphingomyelin (SM), and ceramide (Cer), in CLP-induced murine sepsis.
We previously reported the therapeutic effects of LPC administration in experimental sepsis [14] and the CLP-induced alteration of LPC-related metabolic parameters in the plasma [15]. Although LPC administration in experimental sepsis was found to decrease inflammatory cytokines and to enhance bacterial clearance [14], we hypothesized that LPC administration may also affect plasma lipid changes in CLP mice. Thus, the effects of LPC and its precursor, LPA having similar beneficial actions against sepsis (unpublished observation), on the sepsis-induced plasma lipid changes were also examined.
Among the 147 plasma lipid species analyzed in this study, levels of 110 species were changed in the CLP; 40 species were increased, and 70 species were decreased. LPC and LPA treatment affected 14 lipid species of 7 subgroups, and 25 lipid species of 9 subgroups, respectively.
METHODS
Animals
Male ICR mice at the age of 5 weeks (26–28 g body weight) were used. The procedures for animal experiments were approved by the Animal Experimentation Committee at Hallym University.
CLP operation, and LPC or LPA injection
CLP was performed as described previously [1314]. Briefly, after pentobarbital anesthesia, two through-and-through punctures with a 21-G needle were made at the ligated cecum. For sham operation, punctures were omitted. At 24 h after CLP or sham operation, 100 µl of plasma was prepared from blood obtained from retro-orbital plexus. No lethality was observed up to 24 h post-CLP. 18: 0 LPC or 18:0 LPA (10 mg/kg, Avanti Polar Lipids, Alabaster, AL) was administered subcutaneously at 2 h and 14 h post-CLP.
Lipid metabolite analysis
Plasma samples were thawed to room temperature, and extraction was performed using chloroform:methanol mixture (2:1, v/v) as modified by Folch et al. [16]. Serum lipid extracts were diluted with isopropanol:acetonitrile:water mixture (2:1:1, v/v/v), and injection was used for UPLC/Q-TOF MS. LC-MS was performed on a quadruple time-of-flight MS/MS system (impact HD UHR-QTOF system, Bruker Daltonick, Bremen, Germany) combined with a UPLC system (Waters, Milford, MA). Separations were performed on an Acquity UPLC BEH C18 column (2.1×100 mm with 1.7-µm particles; Waters). The binary gradient system comprised 10 mM ammonium acetate in acetonitrile:water (4:6, v/v) and 10 mM ammonium acetate in acetonitrile:isopropanol (1:9, v/v). The flow rate was maintained at 0.35 ml/min for 20 min. The mass spectrometer was operated in the electrospray ionization-positive and -negative modes, and the mass range was set at m/z 100–1500.
All MS data, including retention times, m/z, and ion intensities, were extracted by the Progenesis QI software (Warters, Milford, MA) incorporated within the instrument, and the resulting data were assembled into a matrix. Ion intensity was normalized with the internal standard using 1-(10Z-heptadecenoyl)-sn-glycero-3-phosphocholine, 1-heptadecanoyl-2-(9Z-tetradecenoyl)-snglycero-3-phosphocholine, and 1,3(d5)-diheptadecanoyl-2-(10Z-heptadecenoyl)-glycerol. The means of duplicate samples and <20% RSD of QC were utilized in the statistical analysis. Metabolites were identified using the LipidMap (www.lipidmaps.org) and Human Metabolome databases (www.hmdb.ca) and confirmed using standard samples (Avanti Polar Lipids) based on retention time, mass spectra, and precursor ion of MS/MS spectra.
Statistical analysis
Statistical analysis was performed with Statistical Package for the Social Sciences software, version 15.0 (SPSS 15.0; SPSS Inc., Chicago, IL). The Mann–Whitney U-test (non-parametric t-test) and the Wilcoxon rank-sum test were conducted for the between-group comparisons, and p-value <0.05 was considered to be statistically significant. A multivariate statistical analysis to pattern analysis was performed using SIMCA-P+ software, version 12.0 (Umetrics, Umeå, Sweden). Cross-validation with seven cross-validation groups was used throughout the analysis to determine the number of principal components. A partial least-squares discriminant analysis (PLS-DA) was used as classification methods to model the discrimination by visualizing the score plot.
RESULTS
Pattern analysis and identification of lipid metabolites
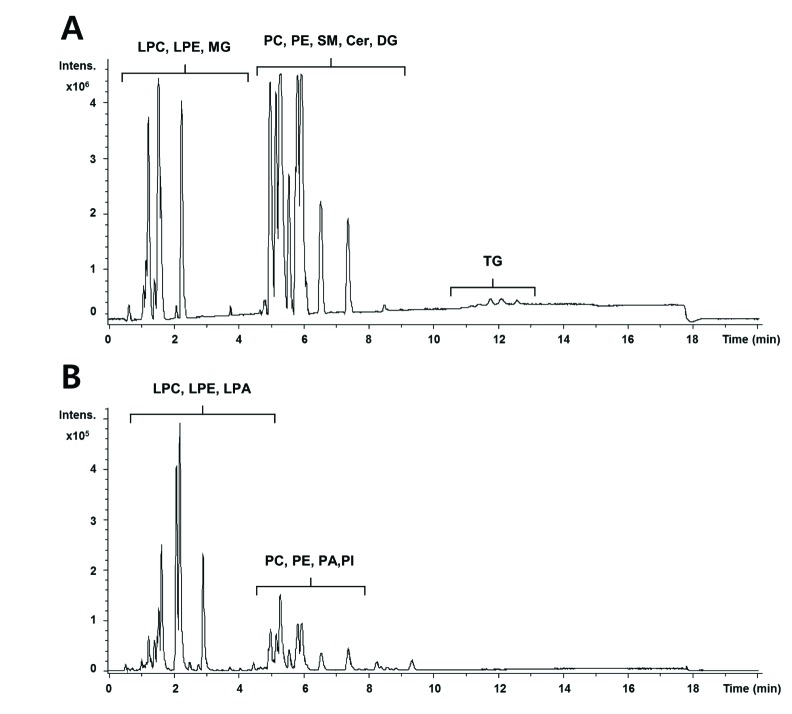
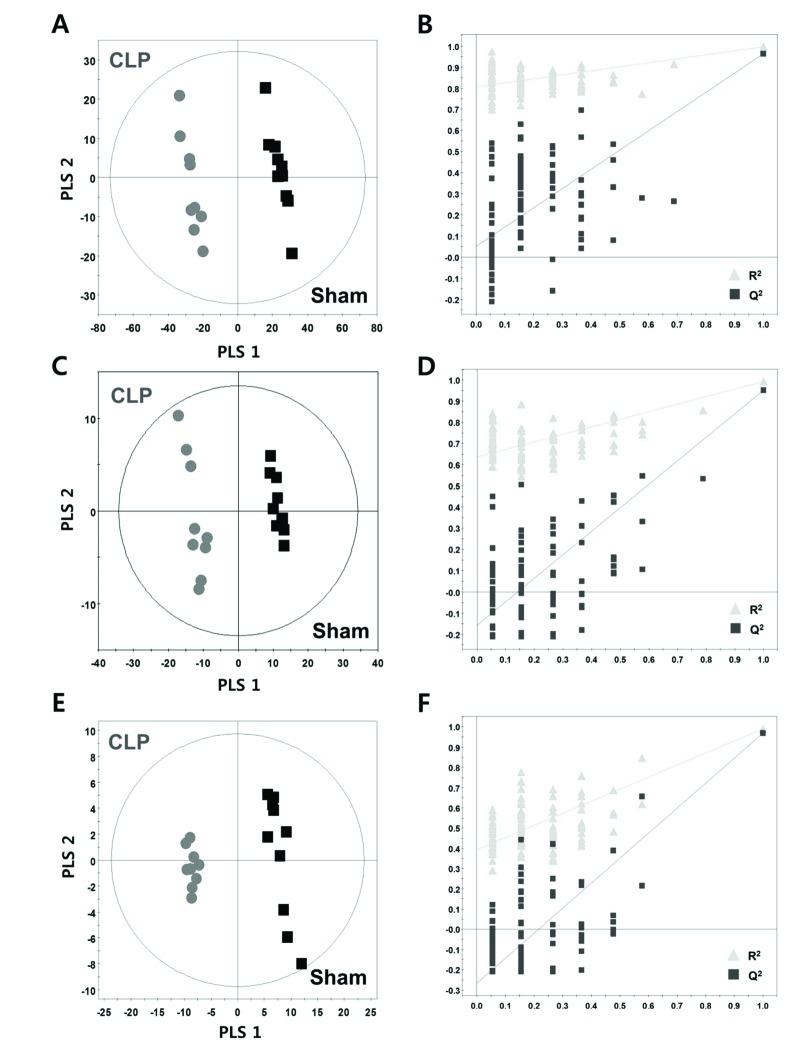
The base peak intensity (BPI) chromatograms obtained from an analysis in positive and negative ionization mode are presented in Fig. 1. We obtained a total of 3591 and 1725 aligned spectral features in UPLC/Q-TOF positive and negative modes, respectively. In global lipidomic profiling, the PLS-DA model showed a clear separation between the CLP and sham mice in both the positive (R2Y=0.996, Q2=0.963) (Fig. 2A) and negative ionization mode (R2Y=0.991, Q2=0.951) (Fig. 2C). The permutation test with a permutation number of 100 was performed and indicated R2 intercept value of 0.796 and 0.639 and Q2 intercept value of 0.053 and −0.146 in positive and negative mode, respectively (Figs. 2B and D).
We annotated 147 lipid metabolites from 13 lipid classes including FA, LPC, LPE, LPA, PC, PE, PI, PA, MG, DG, TG, SM, and Cer in the positive and negative ionization mode. In targeted lipidomic profiling, the PLS-DA model showed a clear separation between the CLP and sham mice (R2Y=0.989, Q2=0.970) (Fig. 2E) and a permutation plot showed high predictability values (R2 intercept= 0.417, Q2 intercept=−0.247) (Fig. 2F).
CLP-induced changes in plasma lipid metabolites
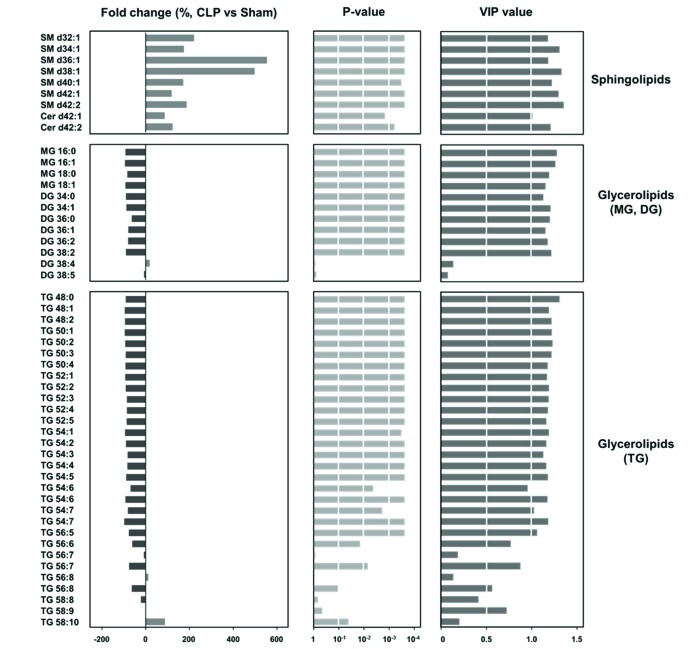
To investigate the significant differences according to lipid classes and acyl chain components of lipid species, we performed the statistical analysis (p<0.05 and variable importance of projection [VIP] of >1). Among lipid classes, sphingolipids (SM and Cer) and glycerolipids (MG, DG, and TG) showed remarkable difference between sham and CLP mice (Fig. 3). The species of SM and Cer had significantly higher levels in CLP mice than sham mice, and particularly SM d36:1 and d38:1 had remarkably high levels in CLP mice (>400%). The species of MG, DG, and TG showed significantly lower levels in CLP mice than sham mice, except DG containing carbon number 38 and double bond number 4 and 5 and TG containing carbon number 56 and 58 and double bond number more than 6 (TG 56:7, 56:8, 58:8, 58:9, and 58:10).
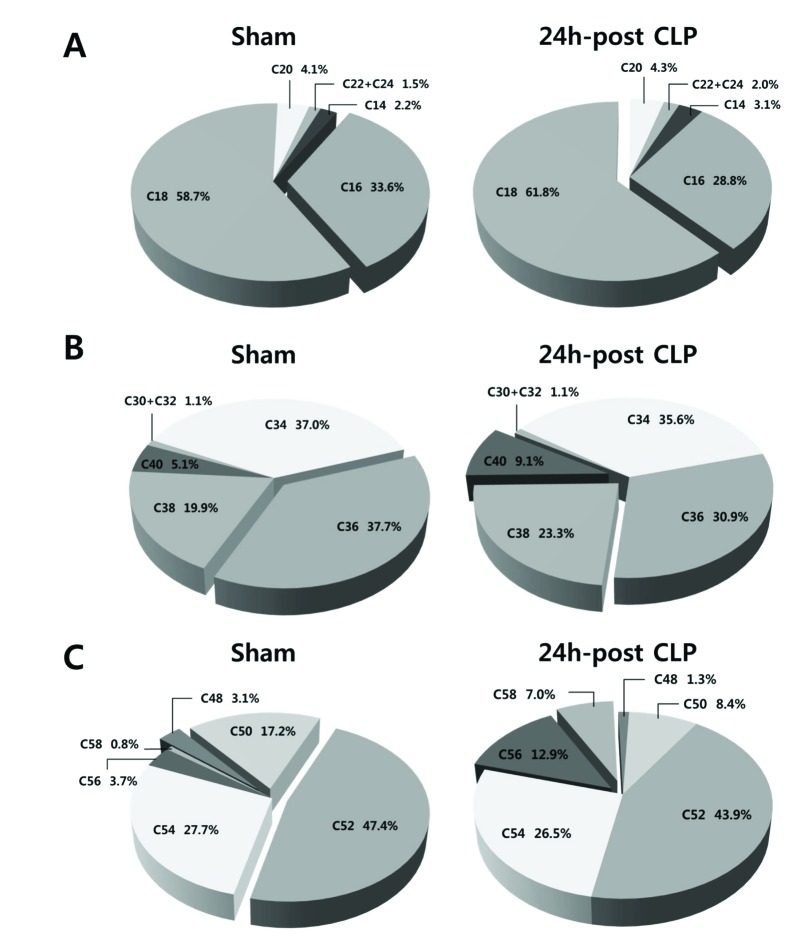
In addition, we compared compositions of FA, PC, and TG according to carbon number of acyl chain (Fig. 4). Sham and CLP mice showed different composition by containing carbon number of acyl chain; the CLP group showed higher composition of long chain acyl component compared with sham mice.
Effect of LPC or LPA on lipid metabolites in CLP
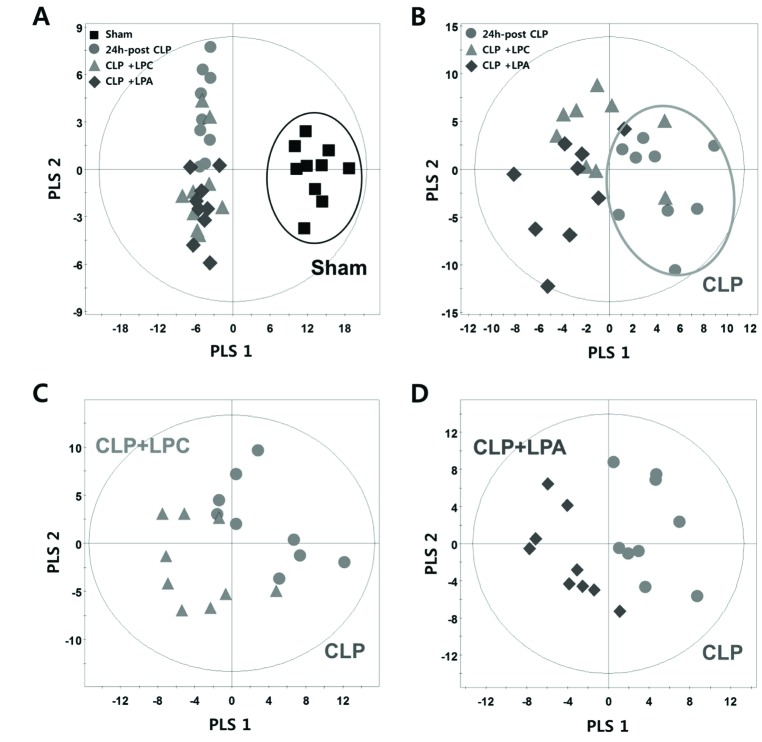
To investigate the effect of LPC or LPA on lipid metabolites in CLP, we performed the pattern analysis using the PLS-DA model and Mann–Whitney U-test. In pattern analysis based on target analysis data, the sham group and CLP groups (CLP, CLP+LPC, and CLP+LPA) were clearly classified (Fig. 5A). Furthermore, the difference pattern was observed between CLP and LPC/LPA treatment groups (CLP+LPC, and CLP+LPA) (Fig. 5B). The difference patterns between each lysophospholipid (LPC or LPA) were also observed (Figs. 5C and D).
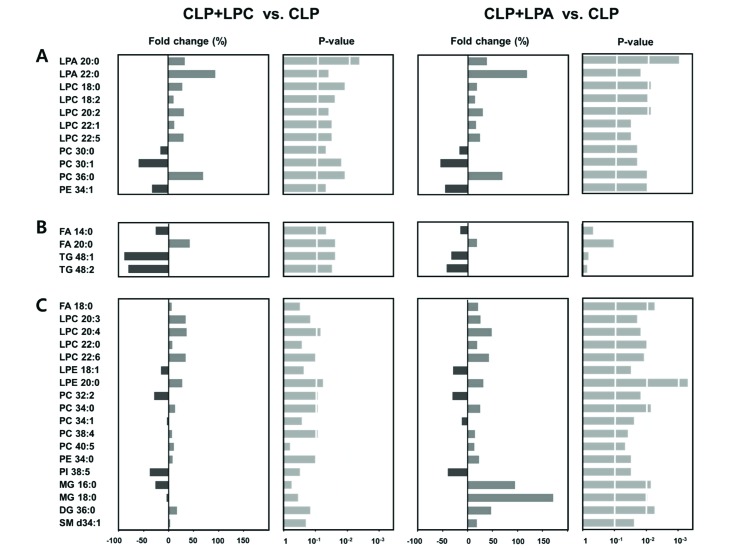
The LPC or LPA treatment groups showed common alteration of LPA 20:0 and 22:0, LPC 18:0, 18:2, 20:2, 22:1, and 22:5, PC 30:0, 30:1, and 36:0 and PE 34:1 (Fig. 6A). The levels of LPA 20:0 and 22:0, LPC 18:0, 18:2, 20:2, 22:1, and 22:5, and PC 36:0 were significantly increased in LPC or LPA treatment groups when compared with the non-treatment group (CLP group), whereas the levels of PC 30:0 and 30:1 and PE 34:1 were significantly decreased in LPC or LPA treatment groups. The elevated levels of FA 20:0 and the reduced levels of FA 14:0 and TG 48:1 and 48:2 were shown in LPC-treated group, but not in LPA-treated one (Fig. 6B). On the contrary, the elevated levels of FA 18:0, LPC 20:3, 20:4, 22:0, and 22:6, LPE 20:0, PC 34:0, 38:4, and 40:5, PE 34:0, MG 16:0 and 18:0, DG 36:0, and SM d34:1 and the reduced levels of LPE 18:1, PC 32:2 and 34:1, and PI 38:5 were shown only in the LPA-treated group (Fig. 6C).
Significant changes of glycerolipids by CLP
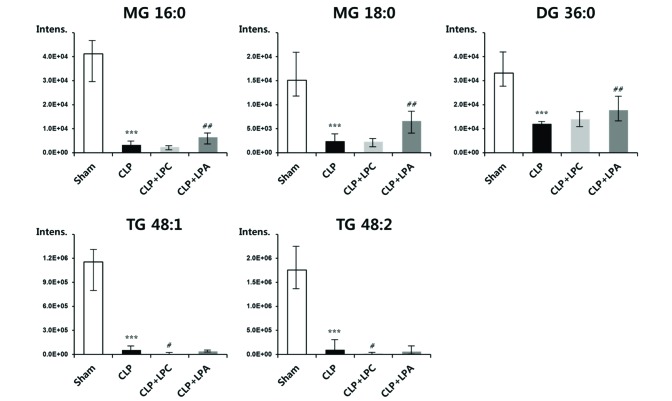
Among significant changes of lipid metabolites by sepsis with or without LPA/LPC treatment, changes of glycerolipids including MG, DG, and TG were most prominent (Fig. 7). The glycerolipids levels were dramatically reduced about 90% in CLP group compared with sham group. By the LPA treatment in CLP mice, the species of MG and DG showed significantly increased levels; particularly, the levels of MG 16:0 and 18:0 and DG 36:0 were elevated by 94%, 171%, and 47% compared with CLP group, respectively. By the LPC treatment in CLP mice, the species of TG showed significantly decreased levels; particularly, the levels of TG 48:1 and 48:2 were decreased by 88% and 80% compared with CLP group, respectively.
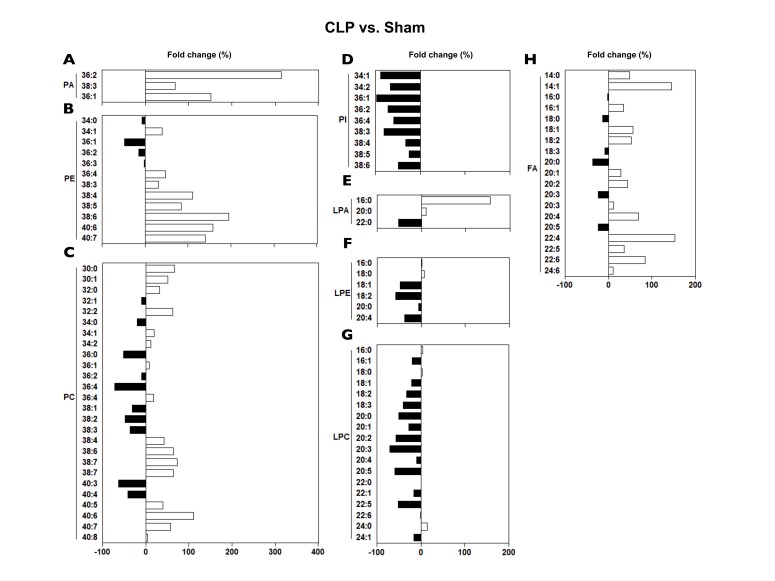
Phospholipids (PA, PC, PE, and PI) showed diverse changes in CLP; PAs and PEs mostly increased, while PCs either increased or decreased depending on the PC species, and all the PIs decreased (Fig. 8). Lysophospholipids (LPA, LPC, and LPE) also revealed diverse changes in CLP; LPAs showed varied changes, while LPCs and LPEs more likely decreased in CLP (Fig. 8). FAs mostly increased (Fig. 8).
DISCUSSION
In sepsis patients, alterations in the levels of various plasma lipids has been reported [34567891011]. In the present study, all the 13 lipid subgroups showed significant changes at least in some individual lipid species at day 1 in CLP. Our study of plasma lipid changes in murine sepsis is largely compatible with those in human septic patients, while some findings are inconsistent.
Levels of plasma LPCs have been repeatedly observed to be decreased in sepsis patients [3810]. In sepsis patients at day 1, levels of plasma LPC 16:0, 18:0, 18:1, 18:2 were shown to be markedly reduced [3]. In a similar vein, decrease in plasma LPC 16:1 at day 1 was also reported in non-survivors compared with survivors in sepsis patients [10]. In the present study, plasma levels of LPC 16:0 and 18:0 were not changed, while plasma levels of LPC 18:1 and 18:2 were reduced (21–33%) (Fig. 8). One possible mechanism for the decrease in plasma LPC levels in septic patients was suggested to be the enhanced conversion to LPA [3]. Recently, we reported that LPC-related metabolic parameters in plasma (i.e., PC, LPA, secretory phospholipase A2, lecithin:cholesterol acyltransferase, acyl-CoA:lysophosphatidylcholine acyltransferase, and autotaxin, and albumin) in CLP mice are altered, suggesting the contribution of all those parameters to the decrease in plasma LPC in CLP mice [15]. In that study, plasma levels of both total PC and total LPA were increased, suggesting that conversion from PC to LPC is decreased, whereas that from LPC to LPA is increased [15]. However, in the present study where we measured each species of PC, LPC and LPA, the co-relationship among those three phospholipids was not so evident due to the variance among the species of the lipids (Fig. 8).
Decrease in LPEs 18:1, 18:2, and 20:4 was observed in CLP (Fig. 8). Interestingly, decrease in LPE 20:4 in non-survived vs survived septic patients was noted [9].
Recently, a lipidomic study in septic patients showed a significant increase in plasma PCs 32:0, 34:1, 34:2, 36:1 [6]. We similarly observed a modestly significant increase (12–32%) in plasma PCs 32:0, 34:1, 34:2, 38:4, and 38:6 in CLP mice, while changes in PC 36:1 were not significant (Fig. 8). Decrease in plasma PC 38:4, 38:6 at day 1 was reported in non-survivors compared with survivors in sepsis patients [10]. Thus, increase in plasma PC 38:4, 38:6 at day 1 in CLP could be beneficial for survival in sepsis.
In sepsis patients at day 1, levels of plasma Cer 23:0, 24:0 were shown to be markedly reduced, while Cer 16:0, 18:0, 20:0, 22:1, and 24:1 significantly increased [3]. The increase in plasma Cer in sepsis was ascribed to the increase in the serum levels of secretary sphingomyelinase activity in the systemic inflammation [317]. In the present study, plasma levels of Cer 24:1 (d42:2, d18:1/24:1) and SM d40:1 (d18:0/22:1(OH)) were markedly increased (Fig. 3). A recent lipidomic study in septic patients showed a significant increase in plasma SM d40:1, d40:2 [6]. SMs consistently increased in CLP, the increases in SM 36:1 and 38:1 being most prominent, more than 500% increase (Fig. 3). These findings illustrate the similarity in sepsis-induced plasma lipid changes between humans and mice.
The increase in plasma FAs in sepsis was observed both in experimental septic animals and septic patients [511]. It was partly ascribed to the increased liberation of FAs from adipose tissue induced by the rise in plasma catecholamines in sepsis [5]. Previously, serum FAs levels from 12 h post-CLP rats were shown to be either decreased (FAs 18:0, 18:1, and 18:2) or increased (FAs 18:3, 22:5, and 22:6) especially in non-survivors [12]. Largely in a similar vein, plasma FA levels from 24 h post-CLP mice were also shown to be either decreased (FAs 18:0, 20:0, and 20:5) or increased (FAs 14:1, 18:1, 18:2, 20:2, 20:4, 22:4, and 22:6) (Fig. 8). A slight discrepancy between each study could be resulted from the differences in the sampling time, species, or severity of sepsis.
Lipopolysaccharide was reported to increase intracellular levels of PA [18]. However, the changes in plasma levels of PA in sepsis has not been reported. We observed more than 300% increase in PA 36:2 in plasma in CLP (Fig. 8). We also firstly observed a consistent decrease in the plasma levels of all the PIs in CLP.
Plasma TG was reported to be increased at day 1 of septic patients [11]. However, the decrease in plasma TG was found in this study (Fig. 3). It is to be noted that as one of the principal early symptoms of CLP at 24 h post-CLP is a profound decrease in food intake, at least part of the changes in the plasma lipids observed in CLP in this study could be resulted from the fasting effect. Plasma lipid profile in the 24 h-fasted mice shows a decrease in TGs and FAs, with no change in phospholipids [19]. Thus, a substantial portion of the decrease in TGs (Figs. 3 and 7) and possibly parts of the decrease in MGs and DGs (Figs. 3 and 7) could be due to CLP-induced decrease in food intake.
Both LPC and LPA treatment affected a wide range of lipid species quite similarly (Fig. 6). However, the influence exerted by LPA treatment on the plasma lipid levels was more profound than that by LPC treatment, suggesting that LPA either directly or indirectly affects a wider range of lipids than LPC. Furthermore, a possibility is raised that at least part of the antiseptic effects of LPC [14] is mediated by LPA. However, it is uncertain whether the changes in plasma lipids induced by LPA or LPC treatment, at least in part, contribute to the beneficial effects of these lysophospholipids against CLP-induced sepsis [14].
Collectively, the extensive plasma lipidomics study in the CLP led to the observation that the levels of a vast range of plasma lipids are altered. Apart from confirming previously reported findings in sepsis, we newly found the alteration of some lipids in the plasma in CLP mice, i.e. PA, and PI. The specific mechanisms for CLP-induced changes in the levels of each plasma lipid observed in this study remain to be fully clarified. The findings of the present study could be useful for the development of reliable biomarkers of sepsis which are much needed for early diagnosis and prediction of prognosis [20212223].
 XML Download