

 PDF
PDF ePub
ePub Citation
 Print
Print


INTRODUCTION
Patients evaluated for liver transplantation (LT) undergo extensive pre-transplant work up to determine candidacy to ensure optimal outcomes and judicious use of donor organs. Cardiac evaluation is an integral part of this work up and includes modalities such as cardiac stress testing and transthoracic echocardiography (TTE) to assess for valvular and structural disease, intra-cardiac shunt and pulmonary hypertension (PH).1) Patients with elevated pulmonary pressures and presence of more than mild tricuspid regurgitation (TR) were shown to have increased morbidity, graft failure and mortality after LT.2) Post-operative mortality in patients with portopulmonary hypertension (PoPH) was as high as 36% in a multicenter study.3)
Right heart catheterization (RHC) is the gold standard for diagnosis of PH, which is defined as mean pulmonary artery systolic pressure (mPAP) > 25 mmHg.1) Severity of PH is graded as mild (mPAP 25-35 mmHg), moderate (35-45 mmHg), and severe (> 45 mmHg).4) Since RHC is an invasive procedure (1.1% morbidity and 0.055% mortality),5) TTE functions as a screening tool to identify patients with high pulmonary artery systolic pressures.
Echo pulmonary artery systolic pressure (ePASP) is estimated by calculating trans-tricuspid pressure gradient during systole (measuring the velocity of TR jet and calculating pressure by the modified Bernoulli equation), to which an estimate of right atrial pressure is added. Relationship between ePASP and PASP obtained by RHC (cPASP) has been studied previously in general population and has shown strong positive correlation.6) The correlation between these modalities in patients with liver disease is less strong. Liver disease is a state of fluid overload with rapid shifts in intravascular volume due to diuresis or large volume paracentesis. In prior studies, the correlation between TTE and RHC derived pulmonary pressures showed weak correlation.7-9) In addition, institutional differences in estimating right atrial pressure and sometimes in determining where to trace peak velocity in a suboptimal TR jet were not accounted for in prior studies since a control group of non-liver disease patients was not available for comparison. In view of these differences, different centers use different cutoffs to trigger need for cardiac catheterization.
We designed the current study to assess the accuracy of an institutional protocol where ePASP > 35 mmHg triggered referral to RHC prior to LT and also assessed the correlation between ePASP and cPASP in patients with and without severe liver disease.
METHODS
All patients who underwent outpatient RHC between January 2014 and September 2016 were identified in this retrospective study. Inpatients were excluded since they are more likely to receive intravenous diuretics or have concurrent illness which may influence intracardiac and pulmonary pressures. Of these, patients who underwent TTE within 3 months before or after the RHC were included in the study. The study group consisted of patients undergoing evaluation for LT while other indications formed the control group. Exclusion criteria included - patients in whom ePASP could not be estimated due to inadequate TR signal from TTE.
Our institutional practice for evaluation of patients being evaluated for liver transplant undergo a transthoracic echo with estimation of ePASP; RHC is performed if ePASP is more than 35 mmHg to confirm diagnosis and assess severity of PH. Patients in the control group were referred for cardiac catheterization based on disease specific clinical indications. Baseline clinical characteristics and lab work were obtained at the time of presentation for RHC.
Right heart catheterization
RHC was performed either the antecubital brachial vein or the femoral veins using 7Fr Swan-Ganz catheter under fluoroscopy guidance in the cardiac catheterization laboratory. The catheter was advanced in a standard fashion and pulmonary pressures were measured at end expiration after making sure there was no damping. Measurements were averaged over 5 cardiac cycles in case of atrial fibrillation and 3 cycles in sinus rhythm.
Transthoracic echocardiogram
TTE was performed in standard fashion with continuous wave Doppler (CWD) interrogation of tricuspid valve in at least two windows (parasternal right ventricular [RV] inflow view and RV focused apical 4 chamber view) using commercially available systems (Vivid E9, General Electric, Waukesha, WI, USA and Epiq Q, Phillips Healthcare, Bothell, WA, USA). Agitated saline was administered in most echocardiograms to evaluate for suspected shunts in cirrhotic patients. When TR jet was faint, the Doppler signal was enhanced using ultrasound contrast agents.
TTEs were reviewed by an experienced observer and ePASP (RV systolic pressure) was measured using the highest TR velocity recorded in any single view (ePASP = 4V2 + estimated right atrial pressure).10-12) RV systolic pressure was calculated using signals that were complete; incomplete signals or those contaminated by artifact where the peak velocity could not ascertained were excluded. Right atrial pressure was estimated based on inferior vena cava (IVC) size and response to sniff as recommended by the American Society of Echocardiography guidelines (IVC size < 2.1 cm and > 50% decrease with sniff = 3 mmHg; IVC > 2.1 cm and > 50% decrease with sniff or IVC < 2.1 cm with > 50% decrease with sniff but with additional parameters of increased right atrial pressure = 8 mmHg; and IVC > 2.1 cm and < 50% decrease with sniff = 15 mmHg).13) Measurements were averaged over 5 cardiac cycles in atrial fibrillation and 3 cycles in sinus rhythm. Mean pulmonary artery pressure was derived using the equation (mPAP = [0.61 × ePASP] + 2) proposed by Chemla et al.14)
Statistical analysis
Descriptive statistics were presented using mean (SD) for continuous variables and number (%) for categorical variables. Categorical variables were compared using Chi-square test and continuous variables by student's T test and Mann-Whitney U test. Correlation between ePASP and cPASP was assessed using Spearman's rank correlation test due to non-normalized distribution of data. Differences in the strength of correlation between study and control groups were analyzed using Fisher's z transform test. Agreement between ePASP and cPASP were assessed using Bland Altman analysis with predefined accuracy as 95% limits of agreement ± 2SD.
Receiver operating characteristic curves were constructed to assess the optimal cutoff of ePASP that has the best sensitivity and specificity for diagnosis of PH (defined as mean pulmonary artery pressure > 25 mmHg derived by RHC) in LT and control group. Data collection and statistical analysis was performed using Microsoft Excel and MedCalc Version 15.10.0 (MedCalc Software BVBA, Ostend, Belgium).
RESULTS
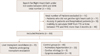
Initial search identified 155 patients; 80 patients met inclusion criteria (Figure 1). The study group consisted of 31 patients while 49 patients were included in the control group (33 workup of PH, 5 pre-cardiac surgery and 11 unexplained dyspnea).
Baseline clinical characteristics are presented in Table 1. Patients in the LT group had lower body mass index and significantly lower incidence of coronary artery disease, congestive heart failure, chronic kidney disease and obstructive lung disease. Left ventricular ejection fraction was significantly higher in LT group (62% ± 3% vs. 58% ± 5%, p = 0.002) while, diastolic dysfunction was less common (9.7% vs 28.6%, p < 0.001), data presented in Table 2. More than mild TR was less prevalent in LT (56% vs. 86%, p < 0.001). There was no significant difference in B-type natriuretic peptide (BNP) between the two groups. There was no significant difference in duration between TTE and RHC in LT compared with control group (median 37 days, interquartile range 8.5-63.5 days vs 13 days, interquartile range 4.25-56; p = 0.081). There was very poor correlation between right atrial pressures estimated by TTE and RHC in LT (r = 0.08) and control group (r = 0.17), likely due to this temporal difference. Data from RHC is presented in Table 3.
Table 1
Demographic data
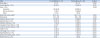
Data are expressed as mean ± standard deviation.
BNP: B-type natriuretic peptide, CKD: chronic kidney disease, COPD: chronic obstructive pulmonary disease, LT: liver transplant.
![]()
Table 2
Echocardiography data

Data are expressed as mean ± standard deviation.
LT: liver transplant, LV: left ventricular, PA: pulmonary artery.
![]()
Table 3
Right heart catheterization data
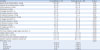
Data are expressed as mean ± standard deviation.
BP: blood pressure, BSA: body surface area, LT: liver transplant, PA: pulmonary arterial, PCWP: pulmonary capillary wedge pressure, PH: pulmonary hypertension, RA: right atrial, RHC: right heart catheterization, RV: right ventricular.
![]()
PH was present in 55% of LT vs 88% of control group (p < 0.001). In LT, 35.5% had mild PH, 19.4% had moderate PH and none had severe PH while 24.5% had mild PH 34.7% moderate PH and 28.6% severe PH in control group. There was modest correlation between ePASP and cPASP (r = 0.58, p = 0.006) in LT (Figure 2A) compared with control group where the correlation was stronger (r = 0.74, p < 0.001) (Figure 2B). However, the difference in correlation in these two groups was not statistically significant (z = -1.2, p = 0.231) likely due to the small sample size. Bland-Altman plot analysis revealed a bias of 5.9 mmHg with 95% limits of agreement ranging from +33.6 to -21.7 mmHg in LT group (Figure 3A). Bland-Altman plot analysis of control group revealed a bias of -0.1 mmHg with 95% limits of agreement ranging from +0.1 to -30.4 mmHg (Figure 3B)
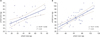 | Figure 2(A) cPASP vs. ePASP in liver transplant candidates shows modest correlation (r = 0.58, p = 0.006). (B) cPASP vs. ePASP in control group shows stronger correlation (r = 0.74, p < 0.001). cPASP: pulmonary artery systolic pressure measured during right heart catheterization, ePASP: pulmonary artery systolic pressure derived from transthoracic echocardiography.
|
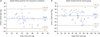 | Figure 3(A) Bland Altman plot analysis of liver transplant candidates reveals bias for ePASP-cPASP of 5.9 mmHg with 95% limits of agreement ranging from +33.6 to -21.7 mmHg. (B) Bland Altman plot analysis of control group, revealing bias for ePASP-cPASP of -0.1 mmHg with 95% limits of agreement ranging from +30.1 and -30.4 mmHg. cPASP: pulmonary artery systolic pressure measured during right heart catheterization, ePASP: pulmonary artery systolic pressure derived from transthoracic echocardiography.
|
Analysis of receiver operating curves demonstrated that ePASP cut-off > 47 mmHg was only 59% sensitive and 78% specific in LT group (area under curve = 0.7, positive predictive value [PPV] = 73.3%, negative predictive value [NPV] = 61%) (Figure 4), whereas a cutoff > 43 mmHg performed well in the control group (91% sensitive, 100% specific; area under curve = 0.97; PPV = 100%, NPV = 60%).
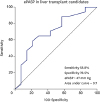 | Figure 4ROC analysis in liver transplant candidates demonstrate that ePASP cut-off > 47 mmHg was only 59% sensitive and 78% specific; area under curve = 0.7, positive predictive value = 73.3%, negative predictive value = 61%. ePASP: pulmonary artery systolic pressure derived from transthoracic echocardiography, ROC: receiver operating characteristic.
|
DISCUSSION
In this study, ePASP showed only modest correlation with cPASP in patients referred for LT while it performed better in patients without liver disease. While an ePASP > 43 mmHg was 100% specific in patients without liver disease, an ePASP > 47 mmHg was only 78% specific in LT candidates. This stresses the importance of using different cutoffs in patients with liver disease to avoid unnecessary RHC. Routine use of RHC in pre-transplant workup is hindered by its cost and invasive nature. By virtue of low cost and non-invasive nature, TTE is often used as a screening tool. However, the current study (along with prior studies) underscores the importance of using higher cutoffs for patients with liver disease.
Post-operative morbidity and mortality are higher in patients with elevated pulmonary arterial pressures who undergo liver transplant surgery.2),3) Presence of PoPH confers a worse prognosis in patients in liver disease.15) Arterial hyperdynamic circulation, increased volume and venous pressure, pulmonary artery vasoconstriction and neuro-hormonal activation are responsible for the development of PoPH in patients with liver cirrhosis.16) In addition, graft survival is lower in the presence of PoPH.17) Accurate assessment of pulmonary pressures is thus crucial in the liver transplant workup. Available data suggest that patients with mild PH (mPAP 25-35 mmHg) can safely undergo liver transplant surgery.18) In cases of moderate to severe PH (mPAP > 35 mmHg), surgery can be considered in those with a decrease in mPAP to less than 35 mmHg in response to vasodilator therapy.18) A functioning liver graft decreases pulmonary pressures in such patients and is the treatment of choice for elevated pulmonary pressures.19),20) In general, transplant surgery is avoided in those with mPAP > 50 mmHg due to the very high mortality.21)
Prior studies of the evaluation of TTE derived PASP were hindered by the absence of a control group. Derivation of PASP by echo depends on parallel alignment of CWD with the jet of TR and standardized assessment of right atrial pressures. This can vary to some extent between laboratories based on sonographer skill and differences in interpretation. In the current study, correlation was poor in patients with liver disease compared to a control group even when echoes were performed within the same time period and by the same team of sonographers and interpreting physicians.
Prior studies have proposed different cut offs in patients with liver disease but suffered from various limitations.9),22-25) Kim et al.23) reported an ePASP cutoff of 50 mmHg as an accurate screening test for moderate to severe PH in cirrhotic patients with 97% sensitivity and 77% specificity. However, the study only included patients with ePASP > 50 mmHg in study group and the control group consisted of those with ePASP < 50 mmHg. In addition, RHC was performed at the beginning of the transplant procedure. Colle et al.24) reported PPV and NPV of 59% and 100% respectively with an ePASP cutoff > 30 mmHg. A higher cut-off (> 50 mmHg) resulted in PPV and NPV of 37.5% and 91.9% respectively.8) In a recent study, an ePASP > 38 mmHg was 100% sensitive and 82% specific for diagnosis of PH.22) However, the study had two major limitations - patients with ePASP < 30 mmHg had RHC performed under general anesthesia as part of LT and the temporal difference between echo and RHC was not specified. None of these studies reported a control group of patients without liver disease to serve as an institutional control.
ePASP may overestimate pulmonary pressures due to multiple factors in patients with liver disease. Fluctuations in fluid status are common either in response to diuretics or large volume paracentesis. In the current study, all patients in LT were on diuretics. Echocardiography is usually the first test performed (often when the patient is inpatient) while RHC is likely to be performed after hemodynamics have been stabilized. Temporal separation between the echo and RHC can thus contribute to the discrepancy. This is supported by the poor correlation in the current study between right atrial pressures derived from TTE and RHC in both groups. In addition, most studies correlating ePASP and cPASP were performed in patients with left sided heart disease. In a systematic review, correlation between ePASP and cPASP was stronger in those with left sided heart disease compared with right sided heart disease (0.60 ± 0.21 vs. 0.83 ± 0.08, p = 0.006).25)
There are several limitations to this study. This was a single center, retrospective study with temporal separation of up to 3 months between TTE and RHC. Though this temporal separation did not appear to significantly affect the strength of correlation in a prior study of patients with pulmonary arterial hypertension,26) very poor correlation between right atrial pressures in the current study suggests that future studies in this area should include patients with both modalities performed on the same day The LT group only included patients with ePASP > 35 mmHg while patients in control group had a wider range of ePASP values. We included only RHCs performed as an outpatient since the correlation between ePASP and cPASP was modestly better in the outpatient setting in a previous study (correlation co-efficient = 0.59 vs 0.52).27)
Conclusions
Compared with other disease states, ePASP correlates modestly with cPASP in patients with liver disease. A higher ePASP cutoff should be used to screen for PH in patients with liver disease. A multi-center prospective study with simultaneous TTE and RHC measurements is required to determine the best cut-off in this population.
 XML Download