

 PDF
PDF ePub
ePub Citation
 Print
Print


INTRODUCTION
METHODS
Study design and patients
Ethical considerations
Procedures
Outcomes
Statistical analysis
RESULTS
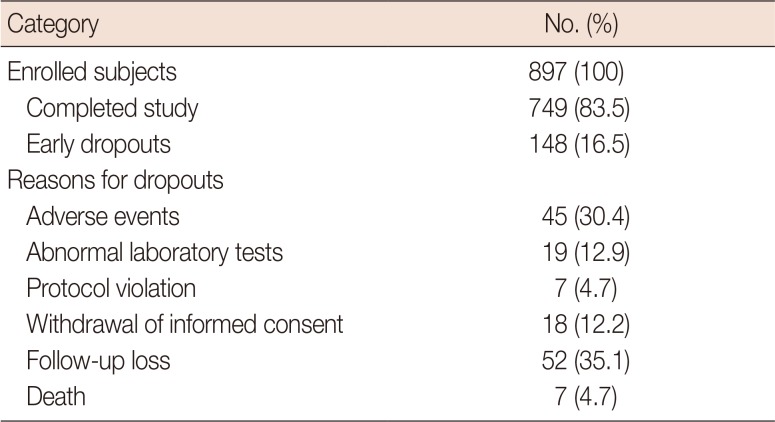
Table 1
Distribution of study subjects in the intention-to-treat population
![]()
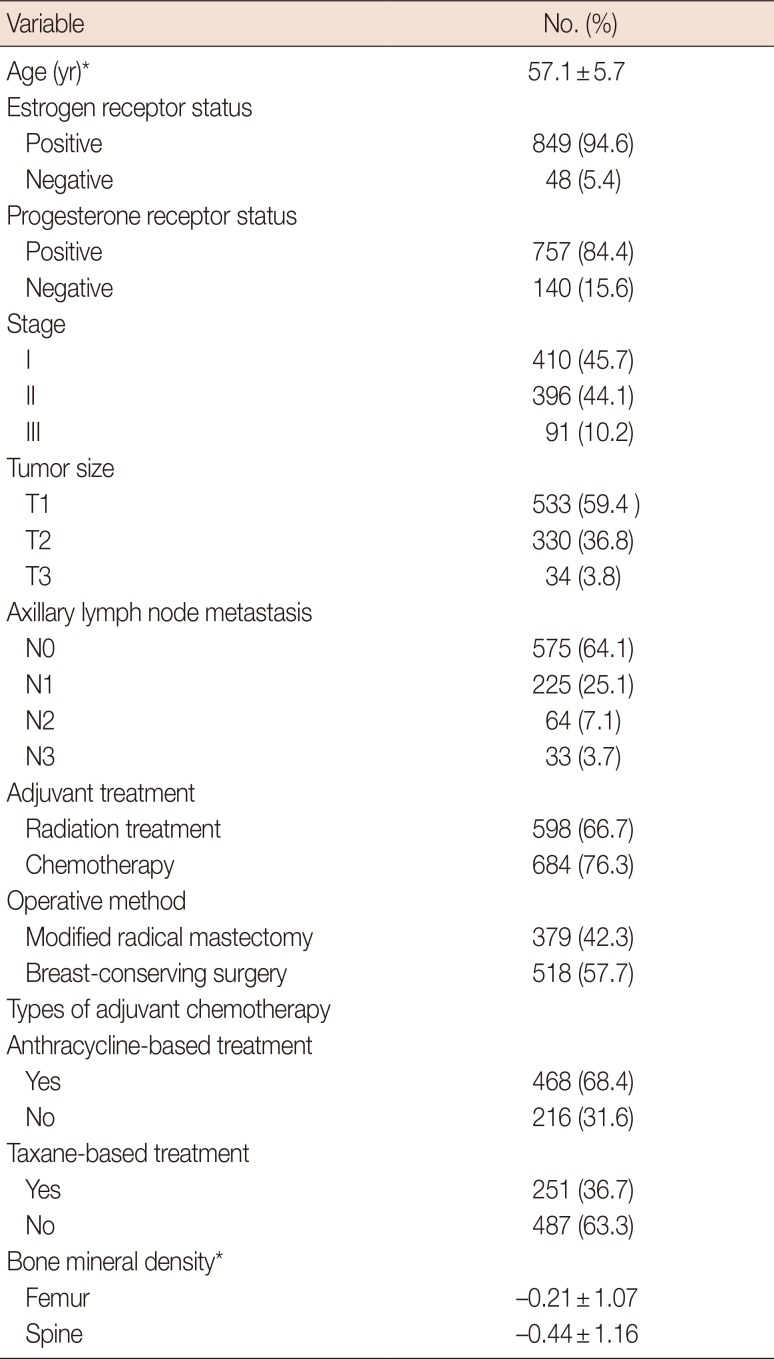
Table 2
Demographic characteristics of the study subjects (n=897)
![]()
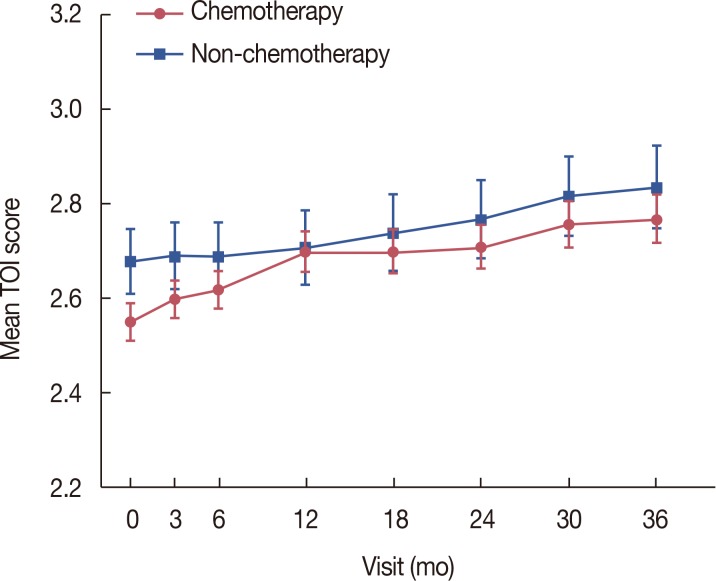
Table 3
Changes in the mean TOI score over the study period in the intention-to-treat population
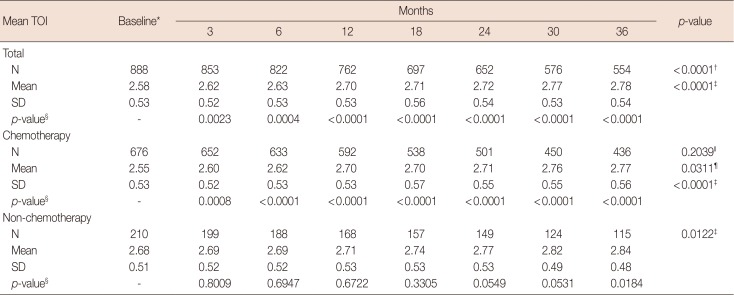
TOI=trial outcome index; SD=standard deviation.
*p=0.0025 using Student t-test for equality of mean baseline TOI scores between the chemotherapy and non-chemotherapy groups; †For equality of mean TOI scores across visits using the generalized estimating equation (GEE); ‡For a linear trend test of mean TOI scores across visits using GEE analysis; §For comparisons of mean TOI score changes between baseline and each follow-up visit using contrasts within the GEE; ∥For an interaction effect between the chemotherapy/non-chemotherapy group and visits using the GEE; ¶Overall equality of mean TOI scores between the chemotherapy and non-chemotherapy groups using the GEE.
![]()
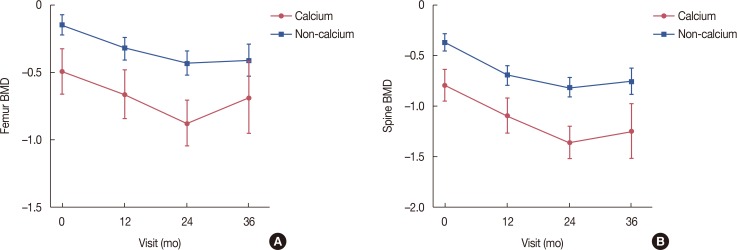 | Figure 2Changes in bone mineral density (BMD) compared to baseline with or without calcium medication during letrozole treatment. (A) Femur BMD. (B) Spine BMD.
|
Table 4
Changes in femur/spine BMD compared to the baseline in the intention-to-treat population during letrozole treatment
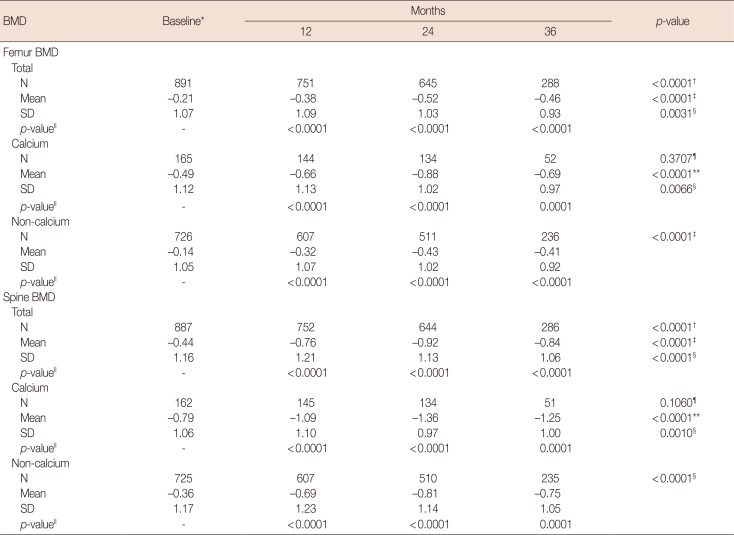
BMD=bone mineral density; SD=standard deviation.
*p=0.0001 for equality of mean baseline femur/spine BMD between the calcium and non-calcium groups using the Student t-test; †For equality of mean femur/spine BMD across visits using the generalized estimating equation (GEE); ‡For a linear trend test of mean femur/spine BMD across visits using GEE analysis; §For a quadratic trend test of mean femur/spine BMD across visits using GEE analysis; ∥For comparisons of mean femur/spine BMD changes between baseline and each follow-up visit using contrasts within the GEE; ¶For an interaction effect between the calcium/non-calcium group and visits using the GEE; **For overall equality of mean femur/spine BMD between the calcium and non-calcium groups using the GEE.
![]()
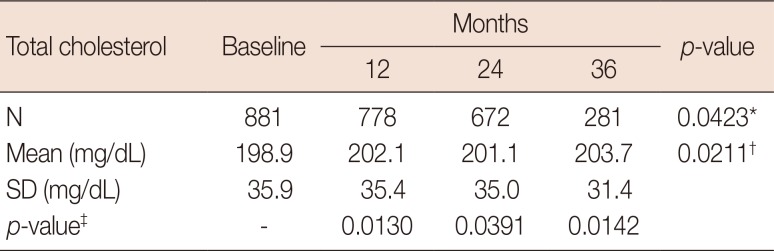
Table 5
Changes of total cholesterol from baseline during letrozole treatment with intention-to-treat population
| Total cholesterol | Baseline | Months | p-value | ||
|---|---|---|---|---|---|
| 12 | 24 | 36 | |||
| N | 881 | 778 | 672 | 281 | 0.0423* |
| Mean (mg/dL) | 198.9 | 202.1 | 201.1 | 203.7 | 0.0211† |
| SD (mg/dL) | 35.9 | 35.4 | 35 | 31.4 | |
| p-value‡ | - | 0.0130 | 0.0391 | 0.0142 |
SD=standard deviation.
*For an equality of mean total cholesterol across visits using generalized estimating equation (GEE); †For a linear trend test of mean total cholesterol across visits within GEE analysis; ‡For comparisons of mean total cholesterol change from baseline to each of following visits using contrasts within GEE.
![]()
 XML Download