Journal List > J Breast Cancer > v.21(2) > 1096864

Kim, Choi, Ryu, Lee, Yu, Kim, Nam, and Lee: Prognostic Validation of the American Joint Committee on Cancer 8th Staging System in 24,014 Korean Patients with Breast Cancer

Abstract

Purpose

The American Joint Committee on Cancer (AJCC) recently released the breast cancer staging system, 8th edition, which included additional four biologic factors. However, there has been no external validation of the prognostic value of the new stages with different population-based databases.

Methods

To validate the prognostic value of the new staging system in the Asian population, with a focus on Korean patients with breast cancer, we performed a retrospective study with data from the Korean Breast Cancer Society that included 24,014 patients with invasive ductal or lobular carcinoma who underwent surgery between January 2009 and January 2012 in Korea. The proportional differences were evaluated between the anatomic staging system (AJCC 7th edition) and the prognostic staging system (AJCC 8th edition, December 2017 published version). Comparisons of overall survival (OS) and disease-free survival (DFS) with Kaplan-Meier graphs and hazard ratios were also performed.

Results

Our analysis included 24,014 patients (median age, 50 years; range, 20–91 years). Stage I, II, and III disease accounted for 47.6%, 43.5%, and 8.9%, respectively, of anatomic stages and 61.8%, 27.6%, and 10.8%, respectively, of clinical prognostic stages. A total of 6,272 cases (26.1%) were upstaged, 4,656 (19.4%) were downstaged, and 13,086 (54.5%) remained unchanged. OS and DFS decreased in the order from prognostic stages IA to IIIC but did not change among the anatomic stage groups.

Conclusion

Our data suggests that the prognostic staging system provides superior prognostic value to the anatomic staging system in Korean patients with breast cancer.

INTRODUCTION

Breast cancer is the most frequently occurring malignancy worldwide and is the second-leading cause of cancer-related deaths in females [1]. Cancer staging is an important tool for physicians because it helps in predicting disease progression and in making therapeutic decisions [2].
Since the 1st edition of the American Joint Committee on Cancer (AJCC) staging manual was published in 1977, the AJCC has considered anatomic information, including that of the primary tumor (T), regional lymph nodes (N), and distant metastases (M), as fundamental for cancer staging [3]. These three anatomic factors comprise the TNM staging system, which provides an evaluation of tumor burden [4]. The TNM staging system has become the most widely used and authoritative cancer staging system in the world, has undergone several revisions, and has been tested for decades in clinical practice [5].
The AJCC released the 8th edition of their cancer staging manual, which included additional four biologic factors, namely tumor grade, estrogen receptor (ER), progesterone receptor (PR) expression, and human epidermal growth factor receptor 2 (HER2) expression, to the anatomic staging system, thereby forming a novel prognostic staging system [6]. The first issue of the 8th edition had missing data, which limited prognostic stage assessments, and the second issue contains supplements and no instances of uncategorized cases [7].
External validation of the prognostic value of these new stages across different population-based databases would confirm the effectiveness of this system. Therefore, we analyzed the prognostic value of the anatomic staging system (AJCC 7th edition) and the prognostic staging system (revised AJCC 8th edition) using data from the Korean Breast Cancer Society (KBSC).

METHODS

Study population

We performed a retrospective analysis of 49,248 patients who underwent surgery between January 2009 and January 2012 in Korea. Data from the KBCS were used. Patients with stage 0 cancer, stage IV cancer, and insufficient data were excluded, but those who were yp stage 0 (carcinoma in situ after neoadjuvant chemotherapy but initially invasive cancer) were included. Patients with invasive ductal or lobular and other (mucinous, medullary, and tubular) carcinomas were included, and patients who were treated with additional endocrine and/or systemic chemotherapy and were followed up for >5 years were included. After application of these criteria, 24,014 patients were eligible for the analysis. This study adhered to the tenets of the Declaration of Helsinki. Because no personal information was contained in the KBCS data that were analyzed, this study was exempted from approval by the Institutional Review Board of the Samsung Medical Center in Seoul, Korea.

Data analysis

Anatomic and prognostic staging were evaluated according to the 7th and 8th editions of the AJCC staging manual, respectively [68]. Data were analyzed using SPSS software version 19.0 (IBM Corp., Armonk, USA). Disease-free survival (DFS) was calculated from the day of surgery to the day of ipsilateral locoregional relapse or distant metastasis or censored at the last follow-up. Overall survival (OS) was calculated from the day of surgery to the censored day owing to any cause. The Kaplan-Meier method and log-rank test were used to calculate the 5-year DFS or OS. A Cox proportional hazards model was constructed, and hazard ratios with corresponding 95% confidence intervals were calculated. p-values of <0.05 were considered statistically significant.

RESULTS

Patient characteristics

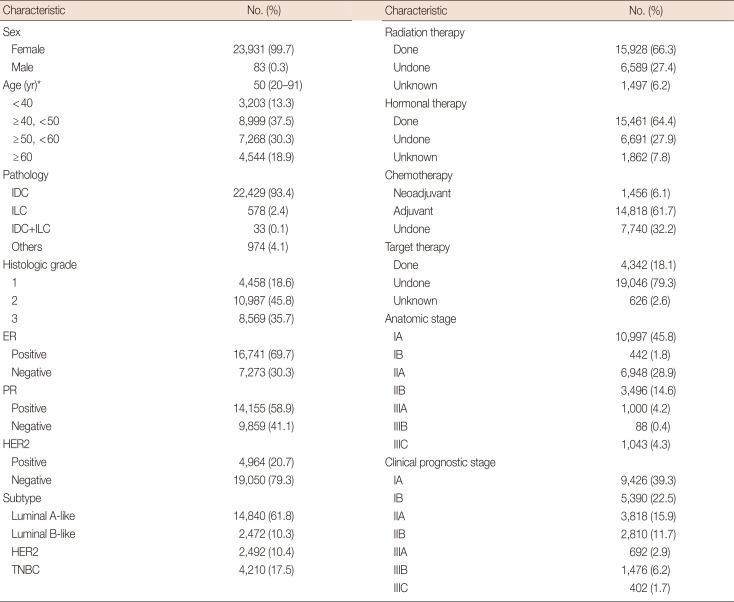
Data of 24,014 patients were used in the analysis. Table 1 shows the baseline characteristics of the included patients and their distributions according to the 7th and revised 8th editions of the AJCC manual. The majority of patients were women, and the median age was 50 years. Invasive ductal carcinoma was found in 93.4% of patients, and the majority of tumors were histologic grade 2, ER-positive, PR-positive, and HER2-negative. Regarding the subtype, 61.8% of the tumors were luminal A-like subtype, and all other types were evenly distributed. The luminal B-like subtype was considered ER-positive and HER2-positive. We could not adopt the HER2-negative luminal B definition of the 2013 St. Gallen Consensus Conference [8] owing to incomplete Ki-67 data. The majority of patients were treated with radiotherapy, hormonal therapy, and adjuvant chemotherapy, and only 18.1% of patients were treated with targeted therapy.
By the anatomic staging system, 45.8% of the tumors were stage IA, and by the clinical prognostic staging system, 39.3% of the tumors were stage IA. Conversely, by the anatomic staging system, 1.8% of the tumors were stage IB, and by the prognostic staging system, 22.5% of the tumors were stage IB. The percentages of stage IA, IIA, IIB, IIIA, and IIIC tumors were lower after the prognostic stage classification than after the anatomic stage classification. Moreover, the distributions of IB and IIIB tumors increased according to the prognostic stage classification compared with the anatomic stage classification.

Differences between results of the anatomic and prognostic staging system

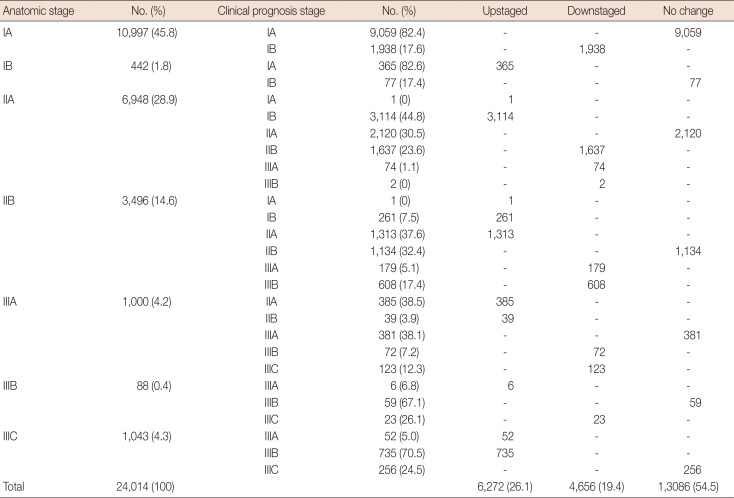
Table 2 shows the distribution of clinical prognostic stages in each anatomic stage. A total of 6,272 patients (26.1%) were upstaged, 4,656 (19.4%) were downstaged, and 13,086 (54.5%) cases remained unchanged. Anatomic stage IA had the highest percentage of patients who remained unchanged (82.4%); however, group IB had the greatest frequency of upstaging (82.6%) and group IIIB had the greatest frequency of downstaging (26.1%).

Survival outcomes

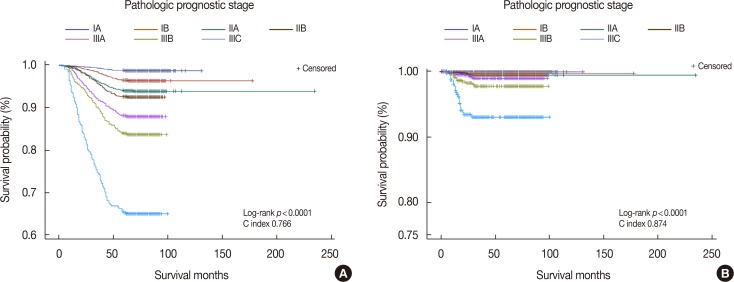
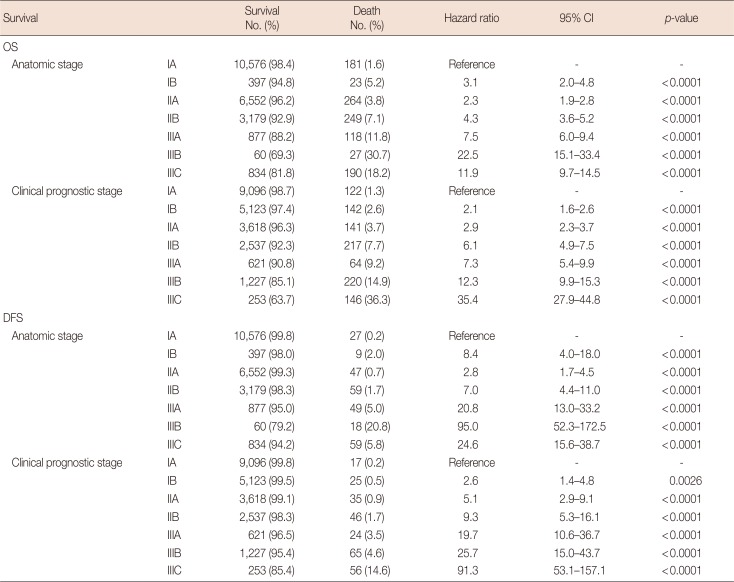
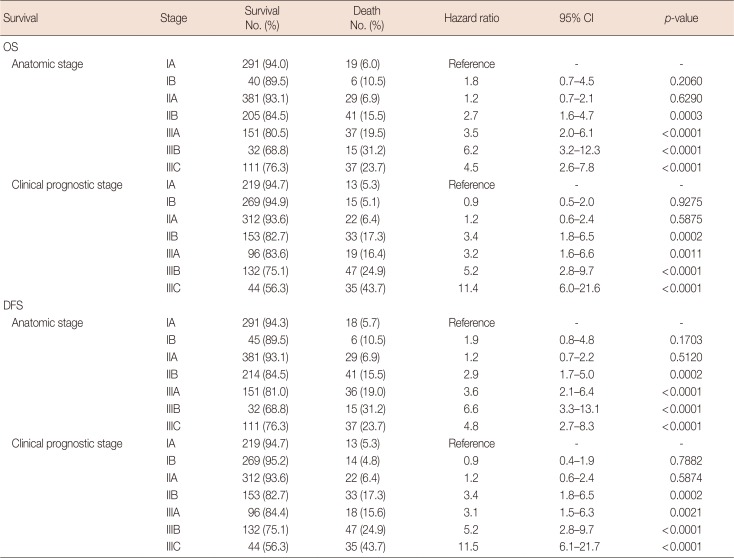
OS and DFS were compared according to the 7th and 8th AJCC staging systems. In the anatomic stage group, patients with IIA tumors showed higher survival rates than those with IB tumors, and patients with IIIC tumors showed higher survival rates than those with IIIB tumors (Figure 1A and 1B). In the clinical prognostic stage group, OS and DFS decreased by stage, from stage IA to IIIC (Figure 1C and 1D). The C-index according to OS and DFS was higher in the clinical prognostic stage group than in the anatomic stage group. We next determined the hazard ratio of 5-year OS and DFS for each stage using stage IA as the calculation reference (Table 3). The hazard ratio of OS and DFS increased with stage, from IA to IIIC, in the clinical prognostic stage group but not in the anatomic stage group. We also analyzed the hazard ratio of 5-year OS and DFS among patients who were treated with neoadjuvant chemotherapy (Table 4). The hazard ratio did not show a statistical difference between the anatomic and clinical prognostic stage groups in the IIA cohort.

Pathologic prognostic stage

According to revised 8th AJCC manual, the prognostic stage is divided into clinical and pathologic stages. The clinical prognostic stage applies to the classification of all patients, but the pathologic prognostic stage does not apply to patients who are treated with systemic or radiation, prior to surgical resection [7]. Therefore, we performed a Kaplan-Meier analysis of the pathologic prognostic stage and exempted patients who were treated with neoadjuvant chemotherapy (Figure 2). The C index was higher for DFS than for OS, but the disparity in each stage was clearer for OS than for DFS.
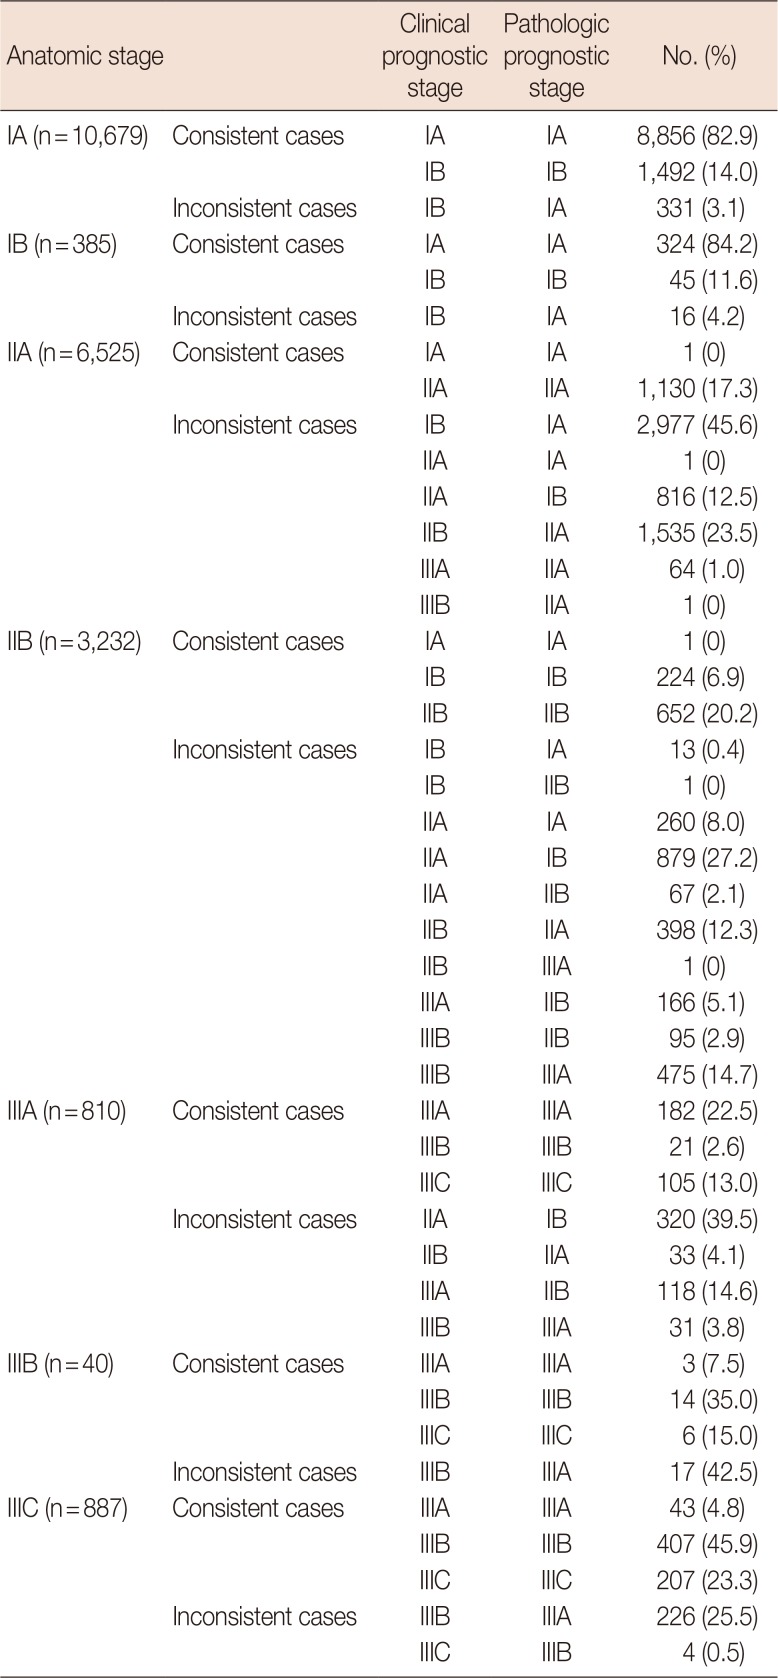
In addition, we analyzed the distributional discrepancies between the clinical and pathologic prognostic stages according to each anatomic stage (Table 5). We observed some consistent cases in addition to inconsistent cases. For patients classified as anatomic stage IA, 96.9% were consistent and 3.1% were inconsistent between the clinical and pathologic prognostic stages. However, anatomic stage IIA showed the highest inconsistency rate (82.7%) among the anatomic stages. There was a greater tendency for upstaging in the pathologic prognostic stage classification than in the clinical prognostic stage classifications across each anatomic stage, with a few exceptions. For anatomic stage IIB, the clinical prognostic stage IB was downstaged to pathologic prognostic stage IIB (one patient) and clinical prognostic stage IIB to pathologic prognostic stage IIIA (one patient). Moreover, 67 patients were downstaged to pathologic prognostic stage IIB from clinical prognostic stage IIA.

DISCUSSION

The 7th AJCC staging system is used worldwide because anatomy is a key prognostic factor for cancer, and anatomic-based staging will remain critically important in the future [9]. However, our evolving knowledge of breast cancer biology and the increasing number of valid prognostic biomarkers generated the need for a new prognostic staging of the 8th AJCC staging system [6]. Significant differences have been observed in the treatment responses and long-term outcomes of different breast cancer subtypes [101112]. ER, PR, and HER2 are pivotal factors used to identify breast cancer subtypes [1314], and these factors are also important for determining the prognostic stage.
Although several studies have validated the 8th edition of the AJCC staging system in patients with breast cancer [151617], the prognostic value of this system has not been transnationally validated across a large number of patients. Our study performed a transnational validation of >20,000 patients. Furthermore, our data validated the revised 8th edition of the AJCC staging system. Previous studies have analyzed data using the first issue of the 8th AJCC staging system, which had missing data [18], and thus raised questions about their validity.
Compared with the anatomic stage, the clinical prognostic stage was upstaged for 26.1% of patients and downstaged for 19.4%. This result differs from those of previous studies. For instance, Weiss et al. [16] reported that the prognostic staging system was upstaged for 29.5% of patients and downstaged for 28.1%. In addition, Winchester [19] reported a near-equal split between patients who were upstaged (20.0%) and those who were downstaged (20.6%). Possible explanations for these discrepancies include ethnic differences or differences in the distributions of each anatomic stage. In our study, 1.8% of patients were anatomic stage IB, whereas only 0.4% were anatomic stage IIIB. Patients of anatomic stage IB and IIIB showed lower survival rates than those of anatomic stage IIA and IIIC, respectively, in the Kaplan-Meier plot, but such differences were not observed in the clinical prognostic stage. This was because the number of patients who were anatomic stage IB and IIIB was small, and the clinical prognostic stage provides a more accurate prognostic value than the anatomic stage.
A previous study with a large number of American patients showed that the prognostic stage provided a more accurate prognostic value than the anatomic stage, although they analyzed data only for DFS [16]. In our results, both OS and DFS showed statistical significance, but OS presented clearer differences than DFS at each stage. In addition, the hazard ratios of OS and DFS were statistically meaningful in all patients, regardless of the anatomic and prognostic stages. However, the hazard ratio did not show statistical differences in anatomic and prognostic stage IIA among patients who were treated with neoadjuvant chemotherapy. The tumor response after neoadjuvant chemotherapy should strongly correlate with patient survival [20], and the combination of tumor size and nodal status after neoadjuvant treatment is a prognosticator [21]. Therefore, we hypothesize that the lack of statistical differences in stage IIA hazard ratio does not mean no importance but suggests no survival differences among patients with stage IA, IB, and IIA tumors after neoadjuvant chemotherapy. Implementation of the 8th AJCC staging system for patients treated with neoadjuvant chemotherapy needs additional validation, especially for those in stage IIA.
Unlike the first issue of the 8th AJCC staging system, the second issue contains information related to the pathologic prognostic stage. This could be useful in a developing country, where systemic or radiation therapy is not widely used. However, the difference between the pathologic and clinical prognostic stages remains unknown. The percentage of inconsistencies between the pathologic and clinical prognostic stages was the highest in patients of anatomic stage IIA (82.7%) and the lowest in those of stage IA (3.1%) (Table 5). The question remains whether such inconsistencies represent a changeable prognosis group according to additional systemic or radiation therapies, and thus, additional investigations into these discrepancies are needed.
One limitation of our study is that we did not have Oncotype Dx™ data. As stated in the 8th AJCC staging system, any patient with T1–2, N0, M0, ER-positive, and HER2-negative statuses and an Oncotype Dx™ score of ≤10 belongs to prognostic stage IA. Additional validation with Oncotype Dx™ data is needed. Another limitation is that our study did not have access to additional large patient cohorts. We initially collected data of 113,485 patients from the KBSC from April 1990 to January 2012. However, we only used the data collected after 2009 when the accurate measurement of the HER2 status was possible. Moreover, the number of patients remarkably decreased after the implementation of our exclusion criteria. Although the number of patients decreased, the reliability of our study increased.
In conclusion, our data suggest that the prognostic staging system provides superior prognostic value over the anatomic staging system in Korean patients with breast cancer.

Notes

This research was supported by the Basic Science Research Program through the National Research Foundation of Korea funded by the Ministry of Education (2015R1D1A1A01057585); by a grant from the Korea Health Technology R&D Project through the Korea Health Industry Development Institute, funded by the Ministry of Health & Welfare of the Republic of Korea (HI14C3418); and by a National Research Foundation of Korea grant funded by the Korean government (Ministry of Science, ICT and Future Planning) (2016R1A5A2945889).

CONFLICT OF INTEREST: The authors declare that they have no competing interests.

References

1. Siegel RL, Miller KD, Jemal A. Cancer statistics, 2016. CA Cancer J Clin. 2016; 66:7–30. PMID: 26742998.
crossref
2. Zhou B, Xu L, Ye J, Xin L, Duan X, Liu Y. The prognostic value of the 8th edition of the American Joint Committee on Cancer (AJCC) staging system in HER2-enriched subtype breast cancer, a retrospective analysis. Anticancer Res. 2017; 37:4615–4621. PMID: 28739761.
3. Singletary SE, Connolly JL. Breast cancer staging: working with the sixth edition of the AJCC cancer staging manual. CA Cancer J Clin. 2006; 56:37–47. PMID: 16449185.
crossref
4. Sobin LH, Gospodarowicz MK, Wittekind C. TNM Classification of Malignant Tumours. 7th ed. Chichester: John Wiley & Sons;2011.
5. Giuliano AE, Connolly JL, Edge SB, Mittendorf EA, Rugo HS, Solin LJ, et al. Breast cancer: major changes in the American Joint Committee on Cancer eighth edition cancer staging manual. CA Cancer J Clin. 2017; 67:290–303. PMID: 28294295.
6. Amin MB, Greene FL, Edge SB, Compton CC, Gershenwald JE, Brookland RK, et al. The eighth edition AJCC cancer staging manual: continuing to build a bridge from a population-based to a more “personalized” approach to cancer staging. CA Cancer J Clin. 2017; 67:93–99. PMID: 28094848.
crossref
7. American Joint Committee on Cancer. Cancer staging manual: updated breast chapter for 8th edition. Accessed July 1st, 2017. https://cancerstaging.org/references-tools/deskreferences/Pages/Breast-Cancer-Staging.aspx.
8. Laesser C, Beritelli P. St. Gallen consensus on destination management. J Destin Mark Manag. 2013; 2:46–49.
crossref
9. Edge SB, Compton CC. The American Joint Committee on Cancer: the 7th edition of the AJCC cancer staging manual and the future of TNM. Ann Surg Oncol. 2010; 17:1471–1474. PMID: 20180029.
crossref
10. Park YH, Lee SJ, Cho EY, Choi YL, Lee JE, Nam SJ, et al. Clinical relevance of TNM staging system according to breast cancer subtypes. Ann Oncol. 2011; 22:1554–1560. PMID: 21242587.
crossref
11. Caudle AS, Yu TK, Tucker SL, Bedrosian I, Litton JK, Gonzalez-Angulo AM, et al. Local-regional control according to surrogate markers of breast cancer subtypes and response to neoadjuvant chemotherapy in breast cancer patients undergoing breast conserving therapy. Breast Cancer Res. 2012; 14:R83. PMID: 22621334.
crossref
12. Mazouni C, Rimareix F, Mathieu MC, Uzan C, Bourgier C, André F, et al. Outcome in breast molecular subtypes according to nodal status and surgical procedures. Am J Surg. 2013; 205:662–667. PMID: 23312273.
crossref
13. Harris L, Fritsche H, Mennel R, Norton L, Ravdin P, Taube S, et al. American Society of Clinical Oncology 2007 update of recommendations for the use of tumor markers in breast cancer. J Clin Oncol. 2007; 25:5287–5312. PMID: 17954709.
crossref
14. Arvold ND, Taghian AG, Niemierko A, Abi Raad RF, Sreedhara M, Nguyen PL, et al. Age, breast cancer subtype approximation, and local recurrence after breast-conserving therapy. J Clin Oncol. 2011; 29:3885–3891. PMID: 21900114.
crossref
15. Hu H, Wei W, Yi X, Xin L, Liu Y. A retrospective analysis of clinical utility of AJCC 8th edition cancer staging system for breast cancer. World J Oncol. 2017; 8:71–75. PMID: 29147438.
crossref
16. Weiss A, Mac Gregor MC, Lichtensztajn D, Yi M, Clarke CA, Giordano SH, et al. Validation of the AJCC 8th edition prognostic stage in breast cancer. J Clin Oncol. 2017; 35(15 Suppl):e23186.
crossref
17. Abdel-Rahman O. Assessment of the prognostic and discriminating value of the novel bioscore system for breast cancer: a SEER database analysis. Breast Cancer Res Treat. 2017; 164:231–236. PMID: 28417332.
crossref
18. Lee SB, Sohn G, Kim J, Chung IY, Lee JW, Kim HJ, et al. A retrospective prognostic evaluation analysis using the 8th edition of the American Joint Committee on Cancer staging system for breast cancer. Breast Cancer Res Treat. 2018; 169:257–266. PMID: 29388016.
crossref
19. Winchester DJ. Important changes made in the AJCC Cancer Staging Manual, Eighth Edition. Bulletin of the American College of Surgeons;Accessed July 1st, 2017. http://bulletin.facs.org/2017/01/important-changes-made-in-the-ajcc-cancer-staging-manual-eighth-edition/.
20. Feldman LD, Hortobagyi GN, Buzdar AU, Ames FC, Blumenschein GR. Pathological assessment of response to induction chemotherapy in breast cancer. Cancer Res. 1986; 46:2578–2581. PMID: 3697997.
21. Carey LA, Metzger R, Dees EC, Collichio F, Sartor CI, Ollila DW, et al. American Joint Committee on Cancer tumor-node-metastasis stage after neoadjuvant chemotherapy and breast cancer outcome. J Natl Cancer Inst. 2005; 97:1137–1142. PMID: 16077072.
crossref
Figure 1

Kaplan-Meier survival curves. (A) Overall survival according to anatomic stage, (B) disease-free survival according to anatomic stage, (C) overall survival accoding to clinical prognostic stage, (D) disease-free survival according to clinical prognostic stage.

jbc-21-173-g001
Figure 2

Kaplan-Meier survival curves by pathologic prognostic stage in breast cancer patients excepting neoadjuvant chemotherapy treated patients. (A) Overall survival curve, (B) disease-free survival curve.

jbc-21-173-g002
Table 1

Baseline characteristics of included 24,014 patients in the study

jbc-21-173-i001
Characteristic No. (%) Characteristic No. (%)
Sex Radiation therapy
 Female 23,931 (99.7)  Done 15,928 (66.3)
 Male 83 (0.3)  Undone 6,589 (27.4)
Age (yr)* 50 (20–91)  Unknown 1,497 (6.2)
 < 40 3,203 (13.3) Hormonal therapy
 ≥ 40, < 50 8,999 (37.5)  Done 15,461 (64.4)
 ≥ 50, < 60 7,268 (30.3)  Undone 6,691 (27.9)
 ≥ 60 4,544 (18.9)  Unknown 1,862 (7.8)
Pathology Chemotherapy
 IDC 22,429 (93.4)  Neoadjuvant 1,456 (6.1)
 ILC 578 (2.4)  Adjuvant 14,818 (61.7)
 IDC+ILC 33 (0.1)  Undone 7,740 (32.2)
 Others 974 (4.1) Target therapy
Histologic grade  Done 4,342 (18.1)
 1 4,458 (18.6)  Undone 19,046 (79.3)
 2 10,987 (45.8)  Unknown 626 (2.6)
 3 8,569 (35.7) Anatomic stage
ER  IA 10,997 (45.8)
 Positive 16,741 (69.7)  IB 442 (1.8)
 Negative 7,273 (30.3)  IIA 6,948 (28.9)
PR  IIB 3,496 (14.6)
 Positive 14,155 (58.9)  IIIA 1,000 (4.2)
 Negative 9,859 (41.1)  IIIB 88 (0.4)
HER2  IIIC 1,043 (4.3)
 Positive 4,964 (20.7) Clinical prognostic stage
 Negative 19,050 (79.3)  IA 9,426 (39.3)
Subtype  IB 5,390 (22.5)
 Luminal A-like 14,840 (61.8)  IIA 3,818 (15.9)
 Luminal B-like 2,472 (10.3)  IIB 2,810 (11.7)
 HER2 2,492 (10.4)  IIIA 692 (2.9)
 TNBC 4,210 (17.5)  IIIB 1,476 (6.2)
 IIIC 402 (1.7)

IDC=invasive ductal carcinoma; ILC=invasive lobular carcinoma; ER=estrogen receptor; PR=progesterone receptor; HER2=human epidermal growth factor receptor 2; TNBC=triple-negative breast cancer.

*Median (range).

Table 2

The distribution of prognostic stage according to each anatomic stage

jbc-21-173-i002
Anatomic stage No. (%) Clinical prognosis stage No. (%) Upstaged Downstaged No change
IA 10,997 (45.8) IA 9,059 (82.4) - - 9,059
IB 1,938 (17.6) - 1,938 -
IB 442 (1.8) IA 365 (82.6) 365 - -
IB 77 (17.4) - - 77
IIA 6,948 (28.9) IA 1 (0) 1 - -
IB 3,114 (44.8) 3,114 - -
IIA 2,120 (30.5) - - 2,120
IIB 1,637 (23.6) - 1,637 -
IIIA 74 (1.1) - 74 -
IIIB 2 (0) - 2 -
IIB 3,496 (14.6) IA 1 (0) 1 - -
IB 261 (7.5) 261 - -
IIA 1,313 (37.6) 1,313 - -
IIB 1,134 (32.4) - - 1,134
IIIA 179 (5.1) - 179 -
IIIB 608 (17.4) - 608 -
IIIA 1,000 (4.2) IIA 385 (38.5) 385 - -
IIB 39 (3.9) 39 - -
IIIA 381 (38.1) - - 381
IIIB 72 (7.2) - 72 -
IIIC 123 (12.3) - 123 -
IIIB 88 (0.4) IIIA 6 (6.8) 6 - -
IIIB 59 (67.1) - - 59
IIIC 23 (26.1) - 23 -
IIIC 1,043 (4.3) IIIA 52 (5.0) 52 - -
IIIB 735 (70.5) 735 - -
IIIC 256 (24.5) - - 256
Total 24,014 (100) 6,272 (26.1) 4,656 (19.4) 1,3086 (54.5)
Table 3

Results of proportional hazard Cox regression in 5 years OS and DFS among all patients

jbc-21-173-i003
Survival Survival No. (%) Death No. (%) Hazard ratio 95% CI p-value
OS
 Anatomic stage IA 10,576 (98.4) 181 (1.6) Reference - -
IB 397 (94.8) 23 (5.2) 3.1 2.0–4.8 < 0.0001
IIA 6,552 (96.2) 264 (3.8) 2.3 1.9–2.8 < 0.0001
IIB 3,179 (92.9) 249 (7.1) 4.3 3.6–5.2 < 0.0001
IIIA 877 (88.2) 118 (11.8) 7.5 6.0–9.4 < 0.0001
IIIB 60 (69.3) 27 (30.7) 22.5 15.1–33.4 < 0.0001
IIIC 834 (81.8) 190 (18.2) 11.9 9.7–14.5 < 0.0001
 Clinical prognostic stage IA 9,096 (98.7) 122 (1.3) Reference - -
IB 5,123 (97.4) 142 (2.6) 2.1 1.6–2.6 < 0.0001
IIA 3,618 (96.3) 141 (3.7) 2.9 2.3–3.7 < 0.0001
IIB 2,537 (92.3) 217 (7.7) 6.1 4.9–7.5 < 0.0001
IIIA 621 (90.8) 64 (9.2) 7.3 5.4–9.9 < 0.0001
IIIB 1,227 (85.1) 220 (14.9) 12.3 9.9–15.3 < 0.0001
IIIC 253 (63.7) 146 (36.3) 35.4 27.9–44.8 < 0.0001
DFS
 Anatomic stage IA 10,576 (99.8) 27 (0.2) Reference - -
IB 397 (98.0) 9 (2.0) 8.4 4.0–18.0 < 0.0001
IIA 6,552 (99.3) 47 (0.7) 2.8 1.7–4.5 < 0.0001
IIB 3,179 (98.3) 59 (1.7) 7.0 4.4–11.0 < 0.0001
IIIA 877 (95.0) 49 (5.0) 20.8 13.0–33.2 < 0.0001
IIIB 60 (79.2) 18 (20.8) 95.0 52.3–172.5 < 0.0001
IIIC 834 (94.2) 59 (5.8) 24.6 15.6–38.7 < 0.0001
 Clinical prognostic stage IA 9,096 (99.8) 17 (0.2) Reference - -
IB 5,123 (99.5) 25 (0.5) 2.6 1.4–4.8 0.0026
IIA 3,618 (99.1) 35 (0.9) 5.1 2.9–9.1 < 0.0001
IIB 2,537 (98.3) 46 (1.7) 9.3 5.3–16.1 < 0.0001
IIIA 621 (96.5) 24 (3.5) 19.7 10.6–36.7 < 0.0001
IIIB 1,227 (95.4) 65 (4.6) 25.7 15.0–43.7 < 0.0001
IIIC 253 (85.4) 56 (14.6) 91.3 53.1–157.1 < 0.0001

OS=overall survival; DFS=disease-free survival; CI=confidence interval.

Table 4

Results of proportional hazard Cox regression in 5 years OS and DFS among patients treated with neoadjuvant chemotherapy

jbc-21-173-i004
Survival Stage Survival No. (%) Death No. (%) Hazard ratio 95% CI p-value
OS
 Anatomic stage IA 291 (94.0) 19 (6.0) Reference - -
IB 40 (89.5) 6 (10.5) 1.8 0.7–4.5 0.2060
IIA 381 (93.1) 29 (6.9) 1.2 0.7–2.1 0.6290
IIB 205 (84.5) 41 (15.5) 2.7 1.6–4.7 0.0003
IIIA 151 (80.5) 37 (19.5) 3.5 2.0–6.1 < 0.0001
IIIB 32 (68.8) 15 (31.2) 6.2 3.2–12.3 < 0.0001
IIIC 111 (76.3) 37 (23.7) 4.5 2.6–7.8 < 0.0001
 Clinical prognostic stage IA 219 (94.7) 13 (5.3) Reference - -
IB 269 (94.9) 15 (5.1) 0.9 0.5–2.0 0.9275
IIA 312 (93.6) 22 (6.4) 1.2 0.6–2.4 0.5875
IIB 153 (82.7) 33 (17.3) 3.4 1.8–6.5 0.0002
IIIA 96 (83.6) 19 (16.4) 3.2 1.6–6.6 0.0011
IIIB 132 (75.1) 47 (24.9) 5.2 2.8–9.7 < 0.0001
IIIC 44 (56.3) 35 (43.7) 11.4 6.0–21.6 < 0.0001
DFS
 Anatomic stage IA 291 (94.3) 18 (5.7) Reference - -
IB 45 (89.5) 6 (10.5) 1.9 0.8–4.8 0.1703
IIA 381 (93.1) 29 (6.9) 1.2 0.7–2.2 0.5120
IIB 214 (84.5) 41 (15.5) 2.9 1.7–5.0 0.0002
IIIA 151 (81.0) 36 (19.0) 3.6 2.1–6.4 < 0.0001
IIIB 32 (68.8) 15 (31.2) 6.6 3.3–13.1 < 0.0001
IIIC 111 (76.3) 37 (23.7) 4.8 2.7–8.3 < 0.0001
 Clinical prognostic stage IA 219 (94.7) 13 (5.3) Reference - -
IB 269 (95.2) 14 (4.8) 0.9 0.4–1.9 0.7882
IIA 312 (93.6) 22 (6.4) 1.2 0.6–2.4 0.5874
IIB 153 (82.7) 33 (17.3) 3.4 1.8–6.5 0.0002
IIIA 96 (84.4) 18 (15.6) 3.1 1.5–6.3 0.0021
IIIB 132 (75.1) 47 (24.9) 5.2 2.8–9.7 < 0.0001
IIIC 44 (56.3) 35 (43.7) 11.5 6.1–21.7 < 0.0001

OS=overall survival; DFS=disease-free survival; CI=confidence interval.

Table 5

The distributional comparison between clinical prognostic and pathologic prognostic stage among patients treated without neoadjuvant chemotherapy

jbc-21-173-i005
Anatomic stage Clinical prognostic stage Pathologic prognostic stage No. (%)
IA (n = 10,679) Consistent cases IA IA 8,856 (82.9)
IB IB 1,492 (14.0)
Inconsistent cases IB IA 331 (3.1)
IB (n = 385) Consistent cases IA IA 324 (84.2)
IB IB 45 (11.6)
Inconsistent cases IB IA 16 (4.2)
IIA (n = 6,525) Consistent cases IA IA 1 (0)
IIA IIA 1,130 (17.3)
Inconsistent cases IB IA 2,977 (45.6)
IIA IA 1 (0)
IIA IB 816 (12.5)
IIB IIA 1,535 (23.5)
IIIA IIA 64 (1.0)
IIIB IIA 1 (0)
IIB (n = 3,232) Consistent cases IA IA 1 (0)
IB IB 224 (6.9)
IIB IIB 652 (20.2)
Inconsistent cases IB IA 13 (0.4)
IB IIB 1 (0)
IIA IA 260 (8.0)
IIA IB 879 (27.2)
IIA IIB 67 (2.1)
IIB IIA 398 (12.3)
IIB IIIA 1 (0)
IIIA IIB 166 (5.1)
IIIB IIB 95 (2.9)
IIIB IIIA 475 (14.7)
IIIA (n = 810) Consistent cases IIIA IIIA 182 (22.5)
IIIB IIIB 21 (2.6)
IIIC IIIC 105 (13.0)
Inconsistent cases IIA IB 320 (39.5)
IIB IIA 33 (4.1)
IIIA IIB 118 (14.6)
IIIB IIIA 31 (3.8)
IIIB (n = 40) Consistent cases IIIA IIIA 3 (7.5)
IIIB IIIB 14 (35.0)
IIIC IIIC 6 (15.0)
Inconsistent cases IIIB IIIA 17 (42.5)
IIIC (n = 887) Consistent cases IIIA IIIA 43 (4.8)
IIIB IIIB 407 (45.9)
IIIC IIIC 207 (23.3)
Inconsistent cases IIIB IIIA 226 (25.5)
IIIC IIIB 4 (0.5)
TOOLS
Similar articles