

 PDF
PDF ePub
ePub Citation
 Print
Print


INTRODUCTION
Globally, breast cancer is one of the most frequently diagnosed cancers, and it is responsible for most cancer-related deaths in women [1]. Many patients initially present with disease at late stages because they do not have any obvious symptoms. Neoadjuvant chemotherapy is indicated for women with either locally advanced or inoperable breast cancer. This approach aims to provide more surgical choices, improve patient survival outcomes, and provide information regarding tumor response [2]. Many chemotherapy regimens have been adopted in the preoperative setting, but not all patients benefit from these treatments. Thus, it is necessary to estimate the risk of relapse or death and the benefits of systemic treatment, which could identify patients who would benefit from chemotherapy, thereby reducing treatment costs.
Both microRNAs (miRNAs) and long non-coding RNAs (lncRNAs) regulate various physiological and pathological processes such as cell proliferation, differentiation, apoptosis, and drug sensitivity [3]. Several miRNAs and lncRNAs, including let-7a and H19, provide prognostic information for many cancers [45]. LncRNA H19 is highly expressed in most human cancers, including breast cancer, colorectal cancer, and hepatocellular carcinoma. In addition, high expression of H19 attenuates cell apoptosis in response to chemotherapy. Vennin et al. [6] reported that H19 noncoding RNA-derived miRNA-675 could downregulate proto-oncogene proteins and casitas b-lineage lymphoma b, which may strengthen the tumorigenesis and metastasis of breast cancer cells. Moreover, in estrogen receptor α-positive breast cancer, H19 confers chemoresistance by silencing the pro-apoptotic gene BCL2 interacting killer [7]. Furthermore, Peng et al. [8] found that H19 could sponge let-7 by acting as a competing endogenous RNA and upregulate the expression of the core pluripotency factor LIN28, a let-7 target. Additionally, H19, let-7, and transcriptional factor LIN28 form a double-negative feedback loop which is of great importance in the maintenance of breast cancer stem cells [8]. Recently, Kallen et al. [9] also reported that H19 acts lncRNAs act as a molecular sponge for the let-7a family of miRNAs. Our previous study using clinical samples and in vitro cell lines demonstrated that in breast cancer tumor tissues, low expression of let-7a is related to epirubicin resistance [10]. Considering these findings, we hypothesized that the combination of let-7 and H19 has a prognostic value in predicting chemotherapy response and disease outcomes in breast cancer.
Thus, we conducted a retrospective cohort study to examine the prognostic value of the combined H19 and let-7a signature in predicting the chemotherapy response and prognosis of breast cancer patients who received epirubicin-based neoadjuvant chemotherapy. Additionally, we investigated the expression levels and the functions of H19 in breast cancer cell lines in vitro.
METHODS
Patients selection and evaluation
We performed quantitative real-time polymerase chain reaction (qRT-PCR) on tissues from 79 breast cancer patients' snap-frozen core needle biopsies taken before any treatment at the Breast Tumor Center, Sun Yat-sen Memorial Hospital, Sun Yat-sen University between January 2013 and December 2014. Each case was pathologically confirmed as invasive ductal breast cancer, and epirubicin plus cyclophosphamide every 3 weeks for four cycles (EC) or EC followed by weekly paclitaxel for 12 weeks was administered, and trastuzumab was combined with chemotherapy for her-2 positive cases based on the National Comprehensive Cancer Network (NCCN) guide-lines. This study was approved by the Ethics Committee of Sun Yat-sen Memorial Hospital (2016-SYS-KY-LB-118). All participants provided written informed consent. Each procedure of this study was in accordance with the ethical standards set by the institutional research committee and the 1964 Helsinki Declaration and its amendments. All patients underwent breast surgery 1 month after the last neoadjuvant chemotherapy. We evaluated the clinical chemotherapeutic response by measuring the tumor size before and after treatment based on the Response Evaluation Criteria in Solid Tumors (version 1.1). Responses were categorized as follows: (a) complete response (CR), the disappearance of all known diseases; (b) partial response (PR), tumor size decreased by more than 30.0%; (c) stable disease (SD), tumor size increased by less than 20.0% or decreased by less than 30.0%; and (d) progressive disease (PD), new lesions appeared or tumor size increased by more than 20.0%. In this study, we defined CR and PR as responders and SD and PD as nonresponders. The subsequent treatment after surgery was conducted according to the NCCN guidelines.
RNA isolation and qRT-PCR assay
We used TRIzol (Invitrogen, Carlsbad, USA) and the RNeasy mini kit (Qiagen, Valencia, USA) to extract the total RNA from snap-frozen core needle biopsies of breast cancer patients according to the manufacturer's instructions. The expression levels of let-7a and H19 were detected using qRT-PCR using TaqMan Universal PCR master mix (Applied Biosystems Inc., Foster City, USA) according to the manufacturers' instructions. We used the TaqMan Reverse Transcription Kit (Applied Biosystems Inc.) to reverse transcribe each sample into a total of 1 µg of RNA. Each PCR amplification was performed in a final volume of 10 µL using the CFX384 Real-Time PCR Detection System (Bio-Rad, Hercules, USA). Amplifications were initiated via denaturation for 10 minutes at 95℃ followed by 40 cycles at 95℃ for 15 seconds and 60℃ for 60 seconds. Each reaction was performed in triplicate. U6 RNA and glyceraldehyde-3-phosphate dehydrogenase RNA was used as respective internal controls to normalize the expression levels of miRNA and lncRNA. The data were analyzed by using the comparative cycle threshold method, and the fold difference in expression was normalized against the sample with the lowest expression level.
Cell culture and treatment
We obtained the MDA-MB-231 cell line from the American Type Culture Collection and cultured the cells in RPMI-1640 medium supplemented with 10.0% fetal bovine serum (FBS). A paclitaxel-resistant MDA-MB-231 cell line (MDA-MB-231p) was maintained in RPMI-1640 medium without phenol red (Life Technologies, Carlsbad, USA) supplemented with 5.0% charcoal-stripped FBS (HyClone, Logan, USA) and 50 nM paclitaxel. Cell transfection with miRNA mimics (GenePharma, Shanghai, China) was performed by using Lipofectamine (Invitrogen) as previously described [10].
Cell viability and apoptosis
A 3-(4,5-dimethylthiazol-2-yl)-2,5-diphenyltetrazolium bromide (MTT) assay was used to measure cell viability. In brief, the cells were plated in triplicate at a density of 15,000 cells per well in a 96-well plate and incubated for 24 hours at 37℃, after which various concentrations of paclitaxel were added and the plates were incubated for a further 48 hours. Cell viability was assayed by adding 0.1 mg/mL MTT solution, incubating the plates for 3 hours, and measuring the absorbance at 490 nm using a 96-well plate reader. Flow cytometry was used to measure cell apoptosis. In brief, the cells were treated with paclitaxel for 24 hours, collected, and then washed twice. A total of 1×10⁵ cells were diluted with 500 µL of 1× assay buffer, followed by the addition of 5 µL Annexin V-fluorescein isothiocyanate (FITC) and 10 µL propidium iodide (PI). After a 5-minute incubation period, we immediately analyzed the samples on a Beckman Coulter EPICS-XL MCL flow cytometer (Beckman Coulter Inc., Brea, USA). The fluorescence of FITC and PI was detected using 530 nM and 585 nM bandpass filters, respectively. Approximately 10,000 cells were collected for each sample. All these tests were performed in triplicate.
Statistical analysis
We defined overall survival (OS) as the time from initial diagnosis to the time of death related to any cause or to the time of the most recent follow-up. We defined progression-free survival (PFS) as the time from initial diagnosis to the time of the first sign of disease progression or death from any cause. Our final follow-up was on December 31, 2016. We assessed the relationship between the clinical characteristics and either miRNA or lncRNA expression using Student t-test, chi-square test, or Fisher exact test, as appropriate. To further assess let-7a and H19, a risk score formula was developed based on a linear combination of the let-7a and H19 expression levels weighted by the regression coefficient derived from the univariate Cox regression analysis. In addition, a bioinformatics tool, X-tile [11], was used to determine the cutoff value for let-7a, H19, and the risk score. We used the Kaplan-Meier method and log-rank test to estimate OS and PFS, and we calculated hazard ratios (HRs) by using an adjusted multivariate Cox regression analysis. To identify whether the expression of let-7a and H19 was associated with OS and PFS, we conducted univariate Cox regression analysis and identified significant differences (p<0.05) in let-7a and H19 expressions. We constructed a signature that contains these two indices using the risk score method and analyzed its significance as an indicator of survival outcomes. Later, we conducted multivariate Cox regression analysis by using a forward stepwise approach to test whether let-7a, H19, or their combined signature was an independent prognostic factor for OS and PFS. H19 expression, let-7a expression, and treatment response were considered as covariates. Receiver operating characteristic (ROC) curves were applied to compare the specificity and sensitivity of let-7a, H19, and the combined signature for the prediction of survival. All statistical analyses were conducted by using SPSS version 20.0 (IBM, Armonk, USA) with two-tailed tests, and significance was defined as a p-value of <0.05.
RESULTS
Neoadjuvant chemotherapeutic resistance and levels of let-7a and H19
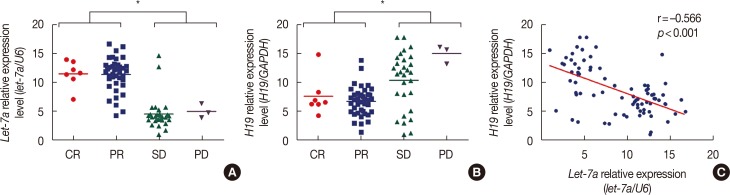
To study the relationship between the expression levels of let-7a and H19 and the chemotherapy response, we detected the expression levels of RNA via qRT-PCR using fresh frozen breast cancer tissues from 79 patients who received epirubicin-based neoadjuvant chemotherapy. Among the 79 patients, CR and PR were achieved by seven and 40 patients, respectively, while SD and PD were achieved by 29 and three patients, respectively. In the responders, the average relative expression levels of let-7a and H19 were 11.30 (range, 1.74–16.88) and 6.34 (range, 1.20–13.45), respectively, while in the nonresponders, they were 4.49 (range, 0.66–14.54) and 12.42 (range, 1.24–18.00), respectively. Consistent with our previous study, we observed that lower let-7a levels were associated with an inferior treatment response (p<0.001). We also identified that the nonresponders had higher H19 expression levels (p<0.001) (Figure 1A and 1B). In addition, Pearson r correlation analyses indicated that let-7a expression was negatively associated with H19 expression (r=–0.566, p<0.001) (Figure 1C).
H19 is associated with drug-resistance in breast cancer cells
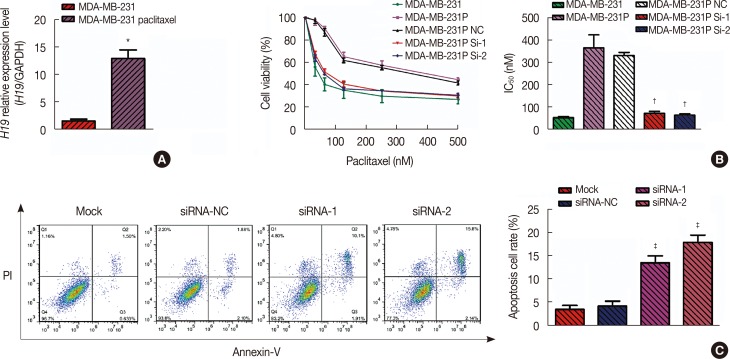
Our previous study reported the restoration of chemosensitivity after inducing let-7a expression [10]. Thus, in this study, we primarily focused on the function of H19. We compared the H19 expression levels in MDA-MB-231 and MDA-MB-231p cell lines using qRT-PCR. We observed that MDA-MB-231 cells rarely expressed H19, while the mean expression level of H19 in the paclitaxel-resistant cells was 13.04-fold higher than in the non-resistant MDA-MB-231 cell line (p=0.002) (Figure 2A).
To determine whether changes in H19 expression impact the drug response, we knocked down H19 using small interfering RNA (siRNA) and measured drug sensitivity using the MTT assay. The half maximal inhibitory concentration (IC50) values of paclitaxel in the MDA-MB-231 cell line and the paclitaxel-resistant cell line were 53.83±4.16 nM and 372.20±59.81 nM, respectively. After knockdown of H19 in MDA-MB-231p cells with siRNA-1 or siRNA-2, the IC50 values were 74.44±8.40 nM (p=0.008) and 65.45±6.44 nM (p=0.007), respectively. These data suggest that siRNA-mediated knockdown of H19 in both drug-resistant cell lines restored sensitivity to paclitaxel (Figure 2B).
Next, we explored whether the observed drug resistance was associated with impaired apoptosis. Based on the externalization of phosphatidylserine as a known hallmark of apoptosis, we conducted flow cytometric analyses of cells treated with Annexin V-FITC to detect the levels of drug-induced apoptosis in these cell lines. After 24 hours of paclitaxel treatment, the apoptosis rate of MDA-MB-231p cells was only 3.5%±0.9%. However, the two siRNA-transfected cell lines exhibited apoptosis rates of 13.8%±1.5% (p=0.004) and 18.2%±1.6% (p=0.001). Therefore, these results may indicate that H19 regulates drug resistance by impairing apoptosis (Figure 2C).
H19 and let-7a have prognostic value in breast cancer patients treated with neoadjuvant chemotherapy
To investigate the long-term prognostic value of let-7a and H19, we analyzed the patients' follow-up data and found that let-7a and H19 levels were associated with OS and PFS. Thus, we derived a formula to calculate the risk score for each patient based on the expression levels of let-7a and H19 weighted by regression coefficients as follows:
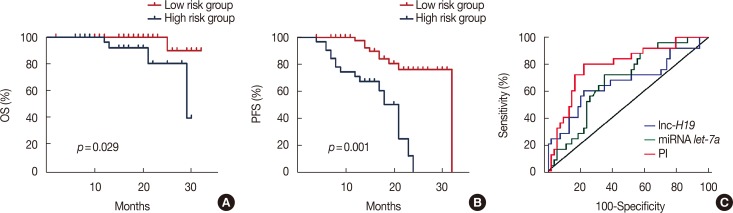
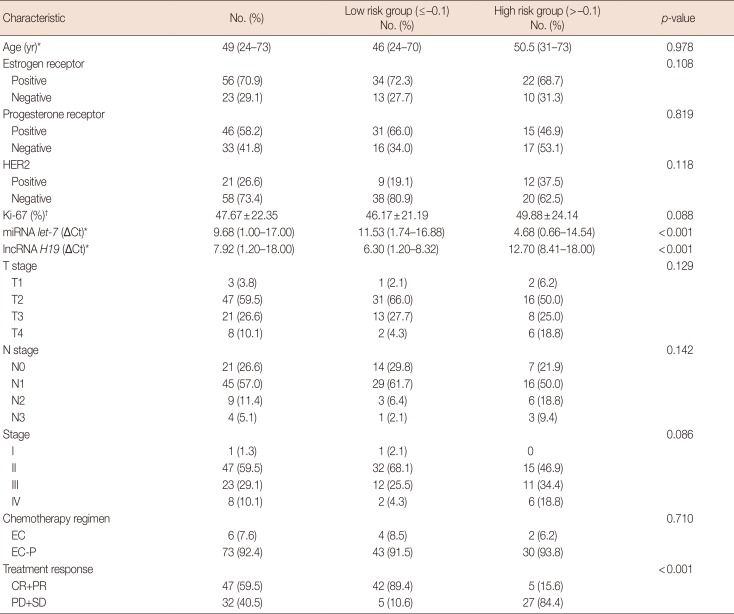
Using the biostatistical tool X-tile, we set –0.1 as the optimal cutoff level for the risk score to assess survival. Thus, the cohort was divided into high-risk (>–0.1, n=32) and low-risk (≤–0.1, n=47) groups according to the risk score. These two groups' clinicopathological characteristics are listed in Table 1. The clinical characteristics, including age, estrogen receptor, progesterone receptor, human epidermal growth factor receptor 2 (HER2), Ki-67, and stage, and chemotherapy regimens were comparable between the two groups. The median follow-up period of the entire cohort was 18 months (range, 4–32 months). At the time of the final follow-up, 25 patients suffered from disease relapse. We found that a risk score <–0.1 was significantly associated with a higher overall response rate (89.4% vs. 15.6%, p<0.001). The median OS and PFS in the high-risk group were 16 months (range, 4–29 months) and 14 months (range, 4–24 months), respectively, whereas the median OS and PFS in the low-risk group were 20 months (range, 7–32 months) and 18 months (range, 7–32 months), respectively (Figure 3A).
We also used X-tile to determine the cutoff values for H19 and let-7a; both were included in the multivariate model as dichotomized variables. The cutoff values for these two indices were 7.10 and 11.30, respectively. The average values of H19 and let-7a were 5.99±0.33 and 11.54±0.44 (p<0.001), respectively, in the low-risk group and 12.35±0.62 and 4.64±0.40 (p<0.001), respectively, in the high-risk group.
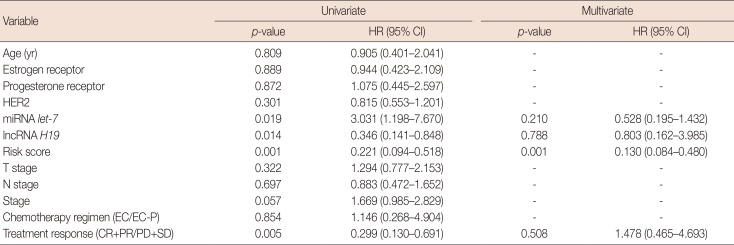
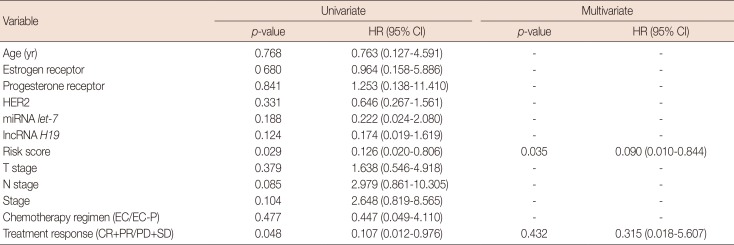
Based on the univariate analysis, the risk score, the expression levels of let-7a and H19, and the treatment response were significant predictors of PFS (Table 2), but only the risk score and the treatment response were significant predictors of OS (Table 3). A risk score >–0.1 was associated with significantly inferior survival (PFS: HR, 0.221, 95% confidence interval [CI], 0.094−0.518, p=0.001; OS: HR, 0.126, 95% CI, 0.020−0.806, p=0.029). Neither tumor stage nor chemotherapy regimen displayed a significant prognostic impact. In the multivariate analysis, a risk score >–0.1 was observed to be an independent predictor of both PFS and OS (PFS: HR, 0.130, 95% CI, 0.084−0.480, p=0.001; OS: HR, 0.090, 95% CI, 0.010−0.844, p=0.035). Other analyzed factors displayed no significant prognostic impact on either OS or PFS. As let-7a and H19 levels were independent prognostic indices of PFS, we compared the areas under the ROC curve for the risk score and the let-7a and H19 expression levels. The risk score showed a relatively higher area under the curve (AUC) value (0.790; 95% CI, 0.684−0.874) than the let-7a level (0.683; 95% CI, 0.568−0.783) and the H19 level (0.667; 95% CI, 0.552−0.769) (Figure 3B and 3C).
DISCUSSION
Although randomized clinical trials have not shown significant differences in long-term outcomes regarding whether chemotherapy is administered before or after surgery, neoadjuvant chemotherapy improves surgical outcomes and provides important prognostic information on treatment responses [812]. Many gene-based qRT-PCR assays of RNA isolated from embedded breast cancer tissue samples can be used to predict prognoses, including survival, recurrence, or treatment responses. In our previous study, we reported that in primary breast cancer, low levels of let-7a were associated with chemoresistance [10]. In this study, we focused on the combined prognostic value of let-7a and H19 expression. Consistent with basic research showing that the imprinted H19 may antagonize let-7a, we observed that H19 expression is negatively correlated with let-7a expression and that lower expression of let-7a and higher expression of H19 are associated with neoadjuvant chemotherapeutic resistance in breast cancer patients. In addition, paclitaxel-resistant breast cancer cell lines highly expressed H19, and knockdown of H19 expression restored their respective chemosensitivity. Furthermore, we developed a signature that could predict the survival of patients receiving neoadjuvant chemotherapy, and ROC analysis suggested that the signature has greater survival-predicting ability than H19 or let-7a expression alone.
The H19 gene is a highly conserved gene cluster that regulates embryonal development and growth [13]. In humans, H19 expression is strongly induced during embryogenesis and is downregulated after birth except in skeletal and heart muscle [14]. The overexpression of H19 in either tumor tissues or serum predicted poor prognosis among patients with colorectal cancer, non-small-cell lung cancer, gastric cancer, esophageal squamous cell carcinoma, or other malignancies [15161718]. However, let-7 miRNAs have been postulated to function as tumor suppressors by silencing RAS and HMGA2. Iorio et al. [19] reported that let-7 was rarely expressed in breast tumors compared with normal breast tissue based on microarray analysis. In addition, Kallen et al. [9] demonstrated that the conserved, imprinted H19 binds to let-7 and inhibits its function, thus acting as a molecular sponge. However, few clinical studies have explored the relationship between H19 and let-7a expression levels and their prognostic value, and it remains unknown whether H19 or let-7a levels could accurately predict the short- and long-term outcomes of primary breast cancer patients who receive neoadjuvant chemotherapy. Therefore, as far as we know, this is the first study to focus on this issue and construct a combined signature.
This study has some limitations that should be acknowledged. First, this was a retrospective single-center study. Thus, no independent cohorts were evaluated to prove the prognostic value of this signature. Second, the optimal cutoff value for the combined signature demands external validation. Third, we analyzed only pretreatment biopsy specimens, and it remains unclear whether chemotherapy influences the expression of H19 and let-7a and whether dynamic changes in the combined signature can predict prognosis. Therefore, future prospective clinical trials and larger cohorts should emphasize and clarify the value of the combined signature, and further studies should include more homogeneous patients.
In summary, a risk score cutoff value of –0.1 was adopted to predict the short- and long-term outcomes of primary breast cancer patients who received neoadjuvant chemotherapy. Both the univariate and multivariate analyses showed that a risk score >–0.1 was related to poor treatment responses, OS, and PFS. TNM staging and HER2 tumor status partially contributed to an estimate of absolute benefits expected from systemic neoadjuvant chemotherapy, but the stratification was conducted primarily using anatomical and pathological information. Conversely, our signature could highlight the biological characteristics of breast cancer and provide unique information independent of TNM staging and HER2 status. In addition, measuring H19 and let-7a levels in patients using qRT-PCR might be a convenient and clinically available procedure. Furthermore, we observed that the combined signature had a higher AUC value than either H19 or let-7a expression alone. Thus, it is reasonable to conclude that the combined signature is a superior predictor of survival.
 XML Download