

 PDF
PDF ePub
ePub Citation
 Print
Print


INTRODUCTION
Breast cancer is the most frequently diagnosed cancer and has become the leading cause of cancer-related death in females worldwide [1]. Current treatments are largely determined based on the status of the estrogen receptor (ER), progesterone receptor (PR), and human epidermal growth factor receptor 2 (HER2) [2], or by clinicopathologic variables such as tumor size, tumor grade, and lymph node status [3]. Although these parameters guide the therapeutic decision-making process, the need remains for the development of new biomarkers and therapeutic strategies to combat breast cancer [456]. Therefore, the identification of novel biomarkers and a better understanding of their clinical significance would be beneficial for both the prognosis and therapy of breast cancer.
Epigenetics are independent of the sequence events that physically affect the condensing of chromatin and genes expression [7]. Acetylation is one of the significant epigenetic markers associated with histones in the enhancers and promoters of genes, leading to chromatin remodeling and regulation of gene expression [8]. The level of genome acetylation is regulated through the engagement expression and activity of histone deacetylases (HDAC), as well as histone acetyltransferases [9]. HDAC3, a member of class I HDACs, is overexpressed in the majority of carcinomas [1011], and is one of the most frequently upregulated genes in cancer [12]. However, the expression and function of HDAC3 in breast cancer remains unclear. Müller et al. [13] revealed that HDAC3 is significantly higher in less differentiated breast cancer, as well as in cancer with negative hormone receptor status. In contrast, Krusche et al. [14] observed a significant correlation between increased expression of HDAC3 and hormone receptor-positive tumors. Seo et al. [15] observed no significant association between hormone receptor status and the expression of HDAC3. These conflicting results have been the impetus for our further research aimed at illustrating the expression and function of HDAC3 in breast cancer.
MicroRNA-31 (miR-31) is a pleiotropically acting microRNA (miRNA) that has been implicated in cancer since it has been shown to inhibit invasion and metastasis of breast cancer and other cancer types including ovarian cancer [16] and gastric cancer [17]. The expression of miR-31 inversely correlates with metastasis in human breast cancer patients, and overexpression of this miRNA inhibits breast cancer metastasis [18]. However, to date, the mechanism of regulation of this miRNA in breast cancer is yet to be elucidated.
In the current study, we examined the expression of HDAC3 and its subcellular localization in clinical breast cancer specimens. The correlation between HDAC3 and clinicopathologic parameters of breast cancer was also investigated. Furthermore, we illustrated the biological function and underlying mechanism of HDAC3 in breast cancer. The functional involvement of HDAC3 was related in part to the repression of miR-31 transcription via decreased histone H3 acetylation at lysine K9 (H3K9ac) levels of the miR-31 promoter.
Go to : 
METHODS
Ethics statement
Written consent was obtained from all subjects study recruitment and prior to the start of any experiments. This study was approved by the Research Ethics Committee of Suining Central Hospital, Sichuan Province, China (ethics approval number: 2017018).
Clinical samples
A total of 123 paraffin-embedded breast cancer tissue specimens and paired adjacent normal tissue specimens were collected by the Department of Pathology, Suining Central Hospital, Sichuan Province, between January 2002 and December 2015. All tumor samples were confirmed to contain more than 80% tumor cells using histological examination of sequential sections by pathologists. In addition, fresh breast cancer tissue samples and adjacent noncancerous control tissues were obtained by surgical resection from 15 patients of the Department of General Surgery, Suining Central Hospital, Sichuan Province.
Immunohistochemical staining
The paraffin-embedded sections were deparaffinized with xylene, followed by rehydration using a graded series of ethanol, and then stained with anti-HDAC3 antibody (ab7030; Abcam, Cambridge, USA) diluted 1:500. Sections were subsequently incubated for 1 hour with biotinylated IgG as a secondary antibody and then for 30 minutes with horseradish peroxidase (HRP)-conjugated streptavidin. Colorimetric reaction products were visualized using 3,3′-diaminobenzidine as a chromogen. All sections were counterstained with hematoxylin.
Immunohistochemical evaluation
All immunostained sections were randomly evaluated by three independent pathologists (J.H., L.Y., and Q.L.) in a blinded manner. The numbers of positive-staining and negative-staining cells from five microscopic fields at high power were counted per slide. The percentage of positive cells was scored as previously described [19]. Briefly, no positive cells received a score of 0, ≤10% positive cells received a score of 1, 10%–50% positive cells received a score of 2, and >50% positive cells received a score of 3. The staining intensity was also scored as follows: no staining=0, faint staining=1, moderate staining=2, and dark staining=3. A comprehensive score was calculated as the staining percentage×the staining intensity. Overall HDAC3 expression was classified as low expression with a score ≤6 and high expression with a score >6.
Cell culture
Human breast cancer cell-lines T47D, MCF-7, MDA-MB-231, and MDA-MB-468, along with the cell line of normal epithelial breast cells MCF10A were obtained from the Shanghai Cell Bank (Shanghai, China) and cultured using the recommended media supplemented with 10% fetal bovine serum (Gibco, New York, USA). All the cell lines had been tested and authenticated by the Shanghai Cell Bank.
Plasmids, small interfering RNAs, and the overexpression vector
The miR-31 inhibitor, control miRNAs, HDAC3 control, HDAC3 small interfering RNA, and the overexpression vector were all purchased from GeneChem (Shanghai, China). The cell transfections were carried out using Lipofectamine 2000 (Invitrogen, Carlsbad, USA) according to manufacturer's instructions.
Real-time reverse transcription polymerase chain reaction
Total RNA extraction and the real-time reverse transcription polymerase chain reaction (RT-PCR) analysis were performed using the manufacturer's instructions (Takara Bio Inc., Shiga, Japan). For detection of miR-31, the primers of miR-31 used in the reaction were 5′-TAATACTGCCTGGTAATGATGA-3′ and 5′-GTCGTATCCAGTGCAGGGTCCGAGGTATTCGCACTGGATACGACAGCTAT-3′ And U6 snRNA (5′-GCGCGTCGTGAAGCGTTC-3′, 5′-GTGCAGG GTCCGA GGT-3′) was used as an internal control. For detecting the messenger RNA (mRNA) of HDAC3, the sense primer sequence of HDAC3 was 5′-ACGTGGGCAACTTCC ACTAC-3′ and the reverse primer sequence of HDAC3 was 5′-GACTCTTGGTGAAGCCTTGC-3′. The mRNA from the β-actin gene was used as a control. The forward primer sequence of β-actin was 5′-CATTAAGGAGAAGCTGTGCT-3′, and the reverse primer sequence was 5′-GTTGAAGGTAGTT TCGTGGA-3′.
Western blotting analysis
Total protein samples were extracted, and the concentrations were determined using a bicinchoninic acid protein assay kit purchased from Beyotime Biotechnology (Haimen, China). Sample lysates were separated by sodium dodecyl sulfate- polyacrylamide gel electrophoresis and transferred onto a polyvinylidene fluoride membrane. The membrane was incubated with antibodies specific for HDAC3 (ab7030; Abcam) diluted 1:1,000 or β-actin (Santa Cruz Biotechnology, Santa Cruz, USA) diluted 1:5,000 at 4℃ overnight, followed by incubation with the appropriate HRP-conjugated secondary antibodies.
MTT assay
Cell proliferation was analyzed using tetrazolium salt 3-(4,5-dimethylthiazol-2-yl)-2, 5-diphenyltetrazolium bromide (MTT). Briefly, 3,000 cells from each group were plated in 96-well plates in 100 µL 1,640 medium. For analysis, 20 µL of MTT substrate was added to each well and the plates were incubated for an additional 4 hours at 37℃ with 5% CO2. The medium was removed, and the cells were solubilized in 150 µL dimethylsulfoxide. The colorimetric analysis was performed at a wavelength of 492 nm.
Glucose-uptake, lactate, adenosine triphosphate, and lactate dehydrogenase assays
The Lactate Dehydrogenase Activity Assay Kit (Sigma, St. Louis, USA), Lactate Assay Kit (Sigma), Colorimetric Glucose Assay Kit (BioVision, Milpitas, USA), and a firefly luciferase-based adenosine triphosphate (ATP) assay kit (Beyotime Biotechnology) were used to determine glucose uptake, lactate production, ATP production, and lactate dehydrogenase (LDH) activity, respectively, according to the manufacturer's protocols.
Immunofluorescence assay
MCF7 cell were cultured in complete medium for 48 hours and fixed in 4% paraformaldehyde for 10 minutes at room temperature. The cells were permeabilized with phosphate-buffered saline (PBS) containing 0.2% Triton-X100 for 5 minutes at room temperature, washed three times in PBS containing Triton-X100 and blocked with 5% bovine serum albumin for 30 minutes at room temperature. The cells were incubated with antibody against HDAC3 (ab7030; Abcam) diluted 1:200, overnight at 4℃. After washing, the cells were labeled with secondary antibody, followed by examination under a fluorescence microscope (Nikon Corp., Tokyo, Japan). The nuclear dye 4′,6-diamidino-2-phenylindole (DAPI) was purchased from Sigma-Aldrich (Darmstadt, Germany) and was incubated with the immunostained cells at room temperature for 10 minutes at the concentration of 1 µg/mL.
Chromatin immunoprecipitation
Chromatin immunoprecipitation (ChIP) was performed using the Upstate Biotechnology ChIP kit (Upstate Biotechnology, Lake Placid, USA). Briefly, tissues were fixed in 1% formaldehyde and the cell lysates were sheared by sonication in 1% sodium dodecyl sulfate lysis buffer to generate chromatin fragments with an average of 200 to 1,000 bp. The chromatin was then immunoprecipitated overnight at 4℃ with antibodies specific to HDAC3 (Abcam), H3K9ac (Millipore, Billerica, USA), or an equivalent amount of an isotype control IgG (Santa Cruz Biotechnology). Protein-DNA-antibody complexes were precipitated with protein A-agarose beads for 2 hours at 4℃. Input DNA and levels of DNA in the complex were analyzed by RT-PCR to quantitate enrichment. Primers used were as described previously [20]. The sequences were 5′-CAATTTTGGCCCAGGAGATA-3′ for the forward primer and 5′-TTTCCGGGGACCTCTAGTTT-3′ for the reverse primer.
Statistical analysis
All statistical analyses were performed using SPSS version 13.0 (SPSS Inc., Chicago, USA). Data are expressed as means±standard error of the mean. The statistical correlation of data between groups was analyzed by one-way analysis of variance and Student t-test as appropriate. The chi-square test was used to analyze the correlation between the clinicopathological characteristics and HDAC3 expression. Overall survival (OS) was estimated using the Kaplan-Meier method and compared using the log-rank test. Significant variables were further analyzed by multivariate analysis to test for independent prognosis. p-values of <0.05 were considered statistically significant.
Go to :
RESULTS
The level of HDAC3 expression was upregulated in breast cancer
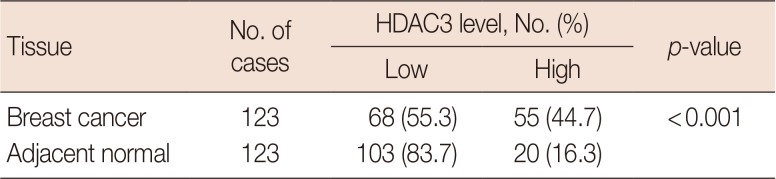
The mRNA expression levels of HDAC3 in breast cancer tissue of 15 fresh specimens and their paired normal samples were quantitated using RT-PCR. Twelve of the breast cancer samples (80%, 12/15) showed a ≥2-fold increase in HDAC3 mRNA levels compared to levels in the paired adjacent nontumor tissues (Figure 1A). The expression of HDAC3 protein in breast cancer tissue, evaluated using immunohistochemical staining, was primarily localized in the cell nucleus, as shown in Figure 1B. Of the 123 paraffin-embedded tumor-tissue samples, 55 (44.7%) demonstrated high HDAC3 expression, whereas only 20 (16.3%) had high expression in adjacent nontumor tissues (p<0.001) (Table 1, Figure 1B). Immunofluorescence analysis confirmed that HDAC3 expression was primarily localized to the cell nucleus in the MCF-7 cell line (Figure 1C). Furthermore, the four breast cancer cell lines T47D, MDA-MB-231, MDA-MB-468, and MCF-7 exhibited higher expression levels of HDAC3 mRNA (p=0.003) (Figure 1D) and protein (p=0.004) (Figure 1E) than levels observed in normal epithelial breast MCF10A cells. These results suggest that HDAC3 expression is upregulated in breast cancer.
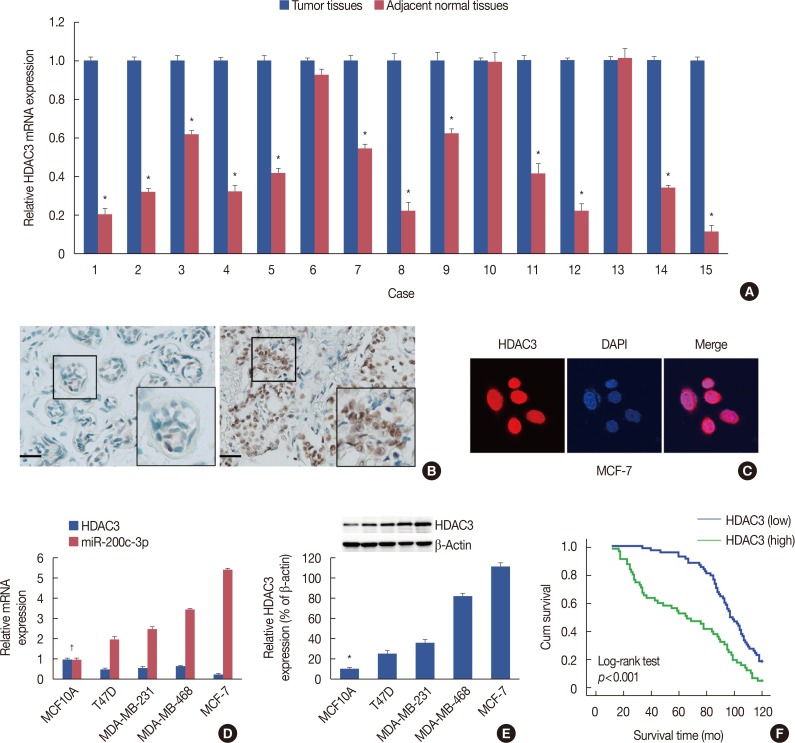 | Figure 1Histone deacetylases-3 (HDAC3) expression in breast cancer. (A) Real-time reverse transcription polymerase chain reaction (RT-PCR) was performed to analyze of messenger RNA (mRNA) expression of HDAC3 in breast cancer tissue of 15 fresh specimens and their paired normal samples. (B) Representative figures of HDAC3 protein expression in adjacent normal tissue (left) and breast cancer tissue (right) using immunohistochemical staining (immunohistochemistry for HDAC3, ×200). (C) Immunofluorescence showed that HDAC3 expression was mainly localized in the cell nucleus in MCF7 cell line. (D) RT-PCR was employed to analyze of mRNA expression of HDAC3 in breast cancer cell lines and normal epithelial breast MCF10A cells. (E) Western blotting analysis of HDAC3 protein expression in breast cancer cell lines and normal epithelial breast MCF10A cells. (F) Association between HDAC3 expression and the prognosis of breast cancer patients.DAPI=4′,6-diamidino-2-phenylindole. *p<0.05; †p<0.05 vs. MCF10A.
|
Correlation between HDAC3 expression and clinicopathological characteristics of breast cancer
The correlation between HDAC3 expression and clinicopathological characteristics of breast cancer were further evaluated. Based on immunohistochemical scores, the patients were divided into two groups (low and high). As shown in Table 2, a high expression level of HDAC3 was positively correlated with an advanced TNM stage (p<0.001) and N stage (p<0.001). However, it was not associated with the T stage (p=0.129), ER status (p=0.963), PR status (p=0.169), HER2 status (p=0.466), age (p=0.117), or histologic grade (p=0.882).
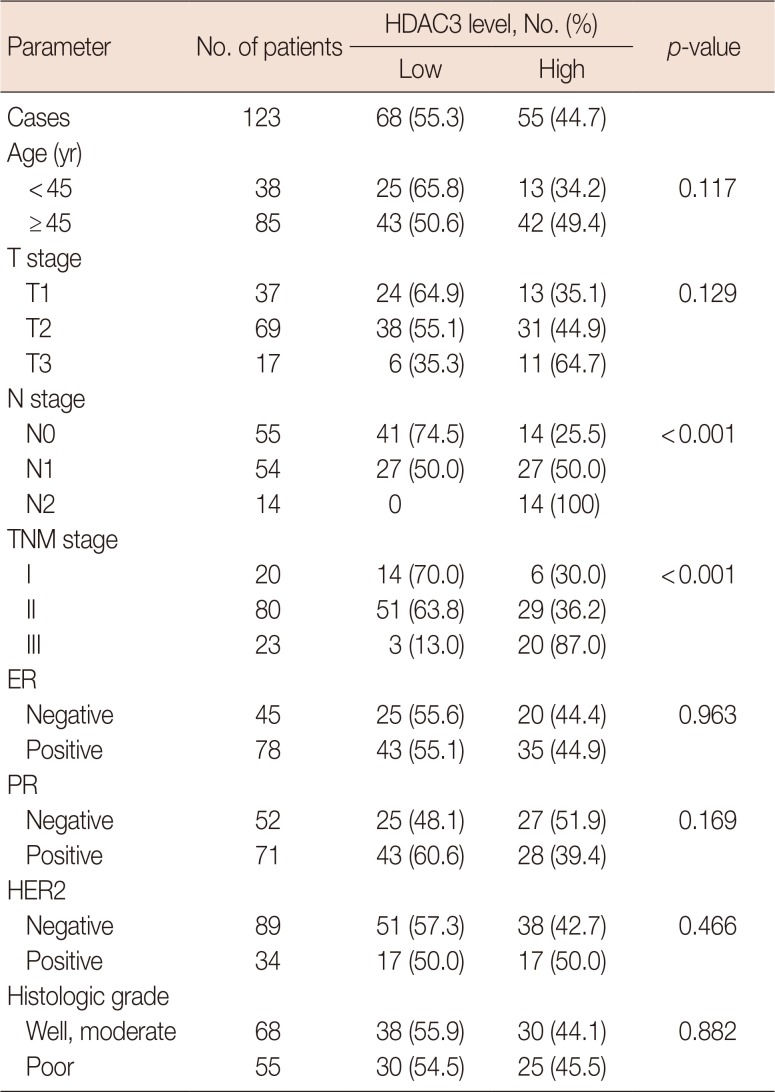
Table 2
Associations between HDAC3 expression and clinicopathological characteristics in breast cancer
![]()
Association between HDAC3 expression and the prognosis of breast cancer patients
Kaplan-Meier survival curves and log-rank test were used to investigate the prognostic effect of HDAC3 on the survival rate for breast cancer patients. Log-rank tests revealed that patients with breast cancer expressing high HDAC3 levels had significantly lower OS than those expressing low HDAC3 levels (p<0.001) (Figure 1F). As shown in Table 3, univariate analysis indicated that the HDAC3 level (p<0.001), T stage (p<0.001), N stage (p=0.001), TNM stage (p<0.001), and tumor differentiation (p=0.032) all correlated with patient survival. Multivariate analysis showed that in addition to T stage, N stage, and TNM stage, HDAC3 levels were independent prognostic factors for breast cancer patients (p=0.035) (Table 3).
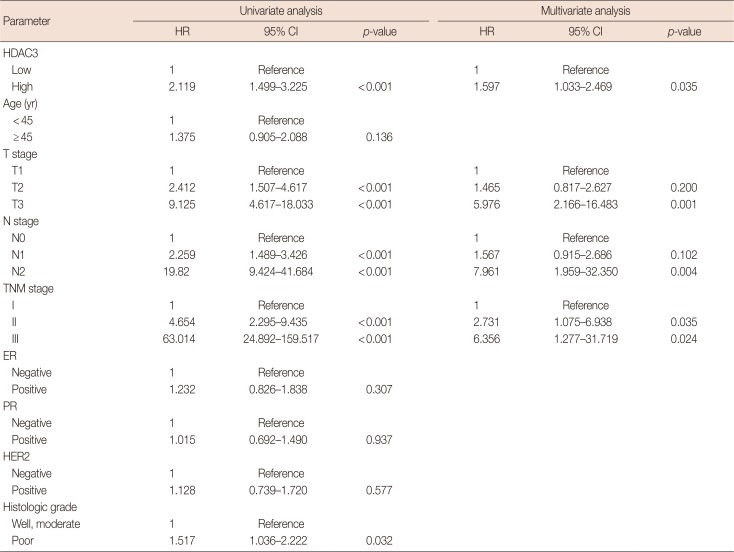
Table 3
Summary of univariate and multivariate Cox regression analysis of overall survival duration in all breast cancer patients (n=123)
![]()
Knockdown of HDAC3 inhibited breast cancer cell proliferation through suppression of aerobic glycolysis
Knockdown of HDAC3 in MCF-7 and MDA-MB-268 cell lines, which had relatively high HDAC3 levels (Figure 1D and 1E), was used to explore the effect of HDAC3 on breast cancer cell proliferation. Western blotting was used to confirm the efficacy of HDAC3 knockdown (Figure 2A and 2B). An MTT assay was performed to assess cell proliferation. The results revealed that downregulation of HDAC3 expression significantly suppressed cell proliferation (p=0.003, Figure 2A; p=0.004, Figure 2B).
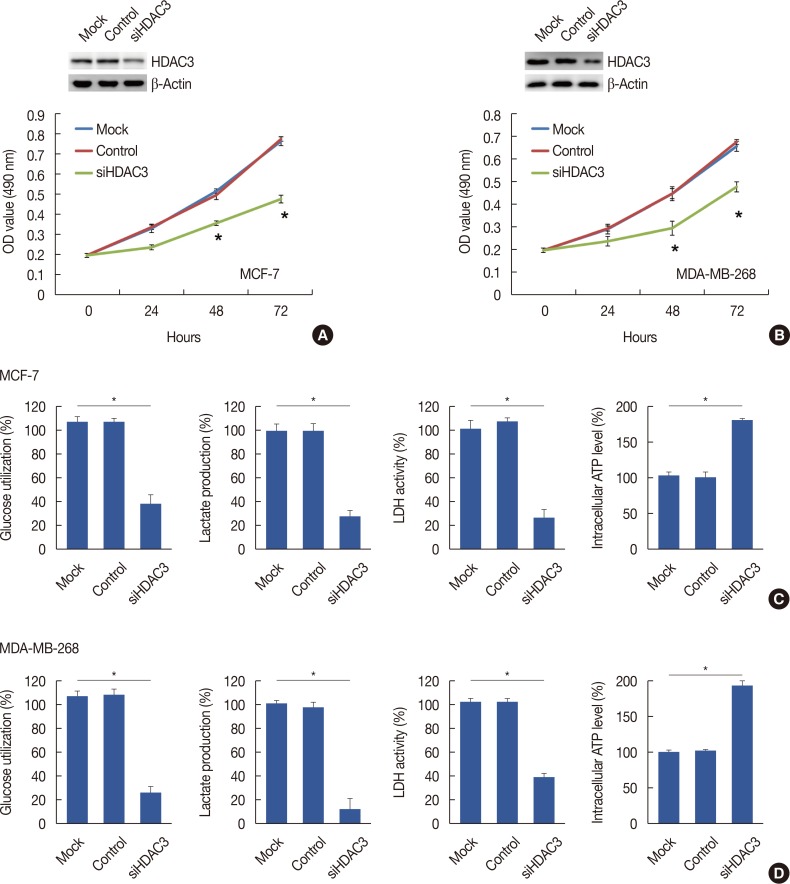 | Figure 2The decrease of cell proliferation and aeroobic glycolysis in response to histone deacetylases-3 (HDAC3) knockdown. The proliferation curve of cells after transfected with control vector or HDAC3 small interfering RNA (siHDAC3) in MCF7 (A) and MDA-MB-268 (B) cell lines, respectively. The glucose utilization, lactate production, lactate dehydrogenase (LDH) activity and intracellular adenosine triphosphate (ATP) level were detected in MCF7 (C) and MDA-MB-268 (D) after transfecting of control vector or siHDAC3.OD=optical density. *p<0.05.
|
Subsequently, we explored the underlying mechanism of HDAC3-induced cell proliferation. Our data showed that HDAC3 downregulation markedly decreased LDH activity, glucose utilization, and lactate production, and increased the levels of intracellular ATP in breast cancer cells (Figure 2C and 2D). Taken together, the results indicated that HDAC3 promoted breast cancer cell-proliferation in part through aerobic glycolysis.
Transfection of miR-31 inhibitor can rescue the loss of HDAC3-mediated repression activity in breast cancer cells
Analysis of the effects of HDAC3 expression on miR-31 mRNA levels showed that expression of miR-31 was upregulated by the knockdown of HDAC3 (MCF-7, p=0.002; MDA-MB-268, p=0.001) (Figure 3A). The transfection of cells with an miR-31 inhibitor rescued the loss of HDAC3-mediated repression activity in breast cancer cells, including reduced cell proliferation (Figure 3B), decreased LDH activity, glucose utilization, and lactate production, and increased intracellular ATP levels (Figure 3C).
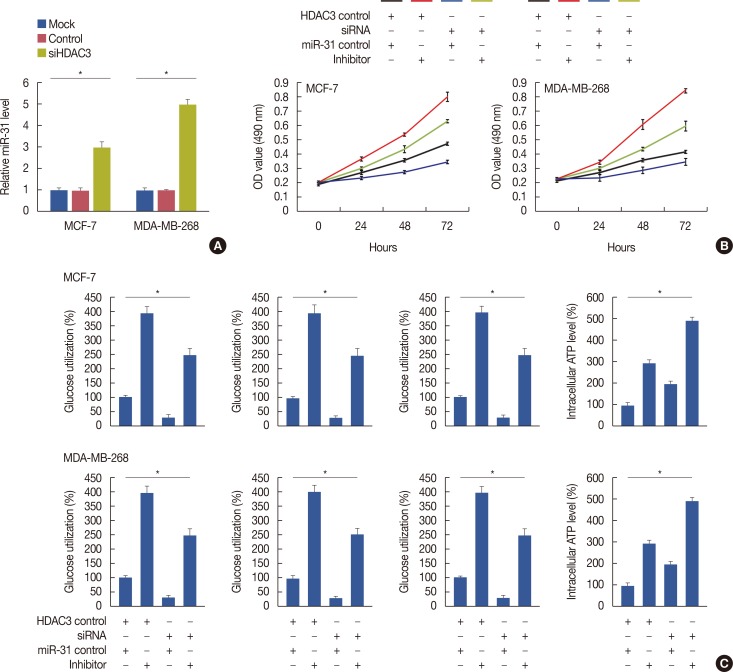 | Figure 3Rescue the loss of histone deacetylases-3 (HDAC3)-mediated repression activity by transfection of microRNA-31 (miR-31) inhibitor in breast cancer. (A) HDAC3 knockdown decreased miR-31 expression. (B) Transfection of miR-31 inhibitor can rescue the loss of HDAC3-mediated reduced cell proliferation in breast cancer. (C) Transfection of miR-31 inhibitor can rescue the loss of HDAC3-mediated decreased lactate dehydrogenase (LDH) activity, glucose utilization, and lactate production and increased intracellular adenosine triphosphate (ATP) level.OD=optical density; siHDAC3=HDAC3 small interfering RNA; siRNA=small interfering RNA. *p<0.05.
|
Overexpression of HDAC3 promoted breast cell proliferation through the promotion of aerobic glycolysis
Overexpressed HDAC3 in nontumorigenic MCF10A cells showed that HDAC3 upregulation promoted MCF10A cell proliferation (p<0.001) (Figure 4A). Furthermore, overexpression of HDAC3 markedly increased LDH activity, glucose utilization, and lactate production, and decreased intracellular ATP levels (Figure 4B).
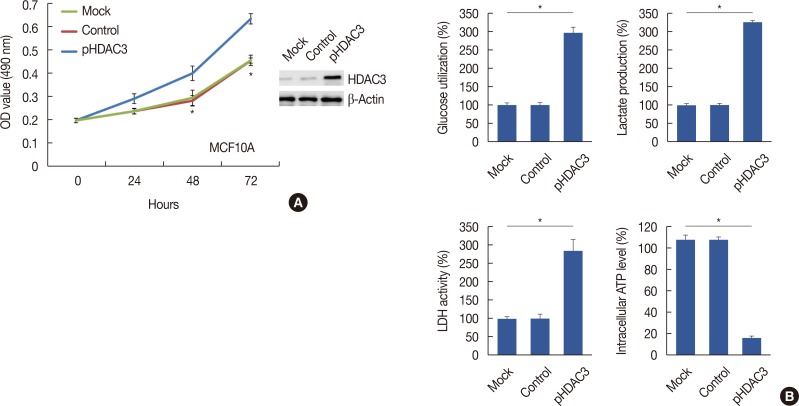 | Figure 4The promotion of cell proliferation and aeroobic glycolysis after histone deacetylases-3 (HDAC3) overexpression. (A) HDAC3 upregulation promoted MCF10A cell proliferation. (B) The glucose utilization, lactate production, lactate dehydrogenase (LDH) activity and intracellular adenosine triphosphate (ATP) level were detected in MCF10A after transfecting of control vector or HDAC3 overexpression (pHDAC3).OD=optical density. *p<0.05.
|
HDAC3 regulated the gene expression of related metabolic enzymes
We determined the levels of related metabolic enzymes in response to HDAC3 knockdown and overexpression. The results showed that the inhibition of HDAC3 expression decreased glucose transporter 1 (GLUT-1), GLUT-4, lactate dehydrogenase A (LDHA), and lactate dehydrogenase B (LDHB) expression (Figure 5A and 5B). In contrast, induction of HDAC3 expression increased GLUT-1, GLUT-4, LDHA, and LDHB expression (Figure 5C).
 | Figure 5Regulation of metabolic enzymes related gene expression by histone deacetylases-3 (HDAC3) level. Inhibition of HDAC3 expression decreased glucose transporter 1 (GLUT-1), GLUT-4, lactate dehydrogenase A (LDHA) and lactate dehydrogenase B (LDHB) expression in MCF7 (A) and MDA-MB-268 (B) cell lines, respectively. (C) Induction of HDAC3 expression increased GLUT-1, GLUT-4, LDHA, and LDHB expression in MCF10A cell.siHDAC3=HDAC3 small interfering RNA; pHDAC3=HDAC3 overexpression. *p<0.05.
|
HDAC3 regulated miR-31 transcriptional activity
To further provide evidence that HDAC3 binds directly to the miR-31 promoter, we conducted a Chip assay using MCF-7-conHDAC3 and MCF-7-siHDAC3 cells. Compared to the MCF-7-conHDAC3 cells, the MCF-7-siHDAC3 cells exhibited reduced HDAC3 recruitment to the miR-31 promoter (p<0.001) (Figure 6A). In contrast, knockdown of HDAC3 resulted in increased levels of H3K9ac of the miR-31 promoter (p<0.001) (Figure 6B).
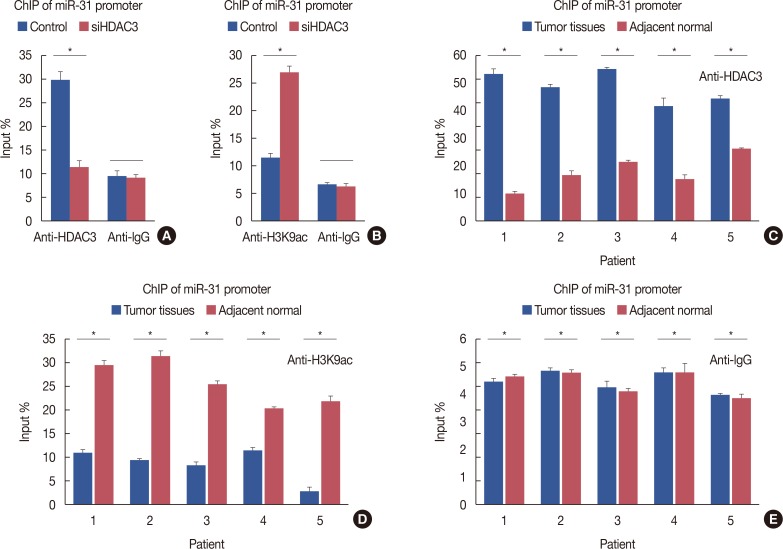 | Figure 6Regulation of microRNA-31(miR-31) transcriptional activity by histone deacetylases-3 (HDAC3). (A) Compared to MCF-7-conHDAC3, MCF-7-siHDAC3 cells exhibited a reduced HDAC3 recruitment to miR-31 promoter. (B) Knockdown of HDAC3 increased histone H3 acetylation at lysine K9 (H3K9ac) levels at the miR-31 promoter. (C) Compared with normal tissues, HDAC3 recruitment to miR-31 promoter was increased in breast cancer tissues. (D) Compared with normal tissues, H3K9ac recruitment to miR-31 promoter was decreased. (E) Normal human IgG was used as a negative control.ChIP=chromatin immunoprecipitation; conHDAC3=HDAC3 control; siHDAC3=HDAC3 small interfering RNA. *p<0.05.
|
Finally, we analyzed HDAC3 recruitment to the miR-31 promoter in five paired breast cancer specimens and their respective adjacent normal tissues. Compared with normal tissues, HDAC3 recruitment to the miR-31 promoter was increased in breast cancer tissues, while H3K9ac recruitment was decreased (Figure 6C–6E). Taken together, these data suggest that HDAC3 binds to the miR-31 promoter to mediate miR-31 transcription in breast cancer cells. We also observed an inverse correlation between HDAC3 expression and miR-31 mRNA expression in breast cancer cell lines (Figure 1D).
Go to :
DISCUSSION
HDAC3 belongs to Class I HDACs (HDAC1, 2, 3, and 8), which are critical regulators of fundamental cellular events such as cell cycle, differentiation, and apoptosis [21]. The upregulation of HDAC3 has been observed in various malignancies, including cholangiocarcinoma [22], pancreatic cancer [19], colon cancer, ovarian cancer, and lung cancer [23]. However, the expression of HDAC3 and its association with clinical parameter in breast cancer are contradictory [131415]. In our study, we observed that HDAC3 was upregulated in breast cancer tissue compared with para-carcinoma tissue. Moreover, HDAC3 expression positively correlated with advanced TNM stage and N stage. Patients with breast cancer expressing high HDAC3 levels had significantly lower OS than those expressing low HDAC3 levels. Furthermore, multivariate analyses suggested that the level of HDAC3 was an independent prognostic factor for breast cancer patients.
We evaluated the biological function of HDAC3 in breast cancer. The results revealed that HDAC3 promoted breast cancer cell proliferation, in part through aerobic glycolysis, including increased LDH activity, glucose utilization, and lactate production, and decreased intracellular ATP levels. It is reasonable to hypothesize that HDAC3 may target the promoter and enhancers of tumor suppressor genes and other proteins that are related to tumor suppressor gene [24]. Jiao et al. [11] suggest that HDAC3 participates in the pathogenesis and progression of pancreatic cancer through postinduction repression of P53, P27, and Bax gene transcription via H3K9 deacetylation. Interestingly, a recent study found that HDAC3 can bind to the miRNA promoter, mediating miRNA transcriptional repression [20]. Koumangoye et al. [20] showed that HDAC3, SOX4, and EZH2 form a co-repressor complex that binds to the miR-31 promoter, repressing miR-31 through an epigenetic mark by H3K27me3 and by histone acetylation in advanced esophageal cancer.
One of the most frequently altered miRNAs in human cancers is miR-31, whose expression and functions have been extensively studied and well defined for many types of cancer [2526]. It is reported that miR-31 is downregulated in ovarian cancer, prostate cancer, and glioma, while miR-31 is upregulated in colorectal, lung, and pancreatic cancers [26]. Overexpression of miR-31 is a pleiotropically acting inhibitor of breast cancer metastasis [182728], through its regulation of various target genes. Our results also showed that the expression of miR-31 was upregulated by knockdown of HDAC3 expression. In addition, we found that transfection of miR-31 inhibitor could rescue the loss of HDAC3-mediated repressive activity in breast cancer, including reduced cell proliferation and decreased aerobic glycolysis. Furthermore, overexpression of HDAC3 decreased H3K9ac levels bound to the miR-31 promoter, leading to miR-31 transcriptional repression. Finally, we analyzed HDAC3 recruitment to the miR-31 promoter in five breast cancer specimens and their respectively paired adjacent normal tissue samples. Compared with normal tissues, HDAC3 recruitment to the miR-31 promoter was increased in breast cancer tissues, while H3K9ac recruitment was decreased. A recent study showed that miR-31 promotes mammary stem cell expansion and breast tumorigenesis by suppressing Wnt signaling antagonists [29]. This study represents the first report of a physiological role for miR-31 in mammary tumorigenesis [29]. Based on previous findings and our results, we speculate that the levels of miR-31 expression play a different role during different stages of breast cancer. First, high levels of miR-31 promote breast tumorigenesis by suppressing Wnt signaling antagonists. Subsequently, miR-31 expression is downregulated by epigenetic mechanisms, leading to breast cancer metastasis. The underlying mechanism needs to be further elaborated.
In conclusion, our findings revealed that HDAC3 served as an oncogene that could promote cell proliferation and aerobic glycolysis and was predictive of a poor prognosis in breast cancer patients. The functional involvement of HDAC3 was in part related to the repression of miR-31 transcription via decreased H3K9ac levels of the miR-31 promoter.
Go to :
 XML Download