

 PDF
PDF ePub
ePub Citation
 Print
Print


INTRODUCTION
Breast cancer is the most common invasive cancer in women, comprising approximately 23% of all female cancers worldwide [12]. Although effective treatment methods including surgery, radiation therapy, and chemotherapy exist, breast cancer frequently shows poor response to these therapies. Therefore, researchers must gain a better understanding of the mechanisms underlying the development of breast cancer to identify highly effective drugs that lead to better outcomes for breast cancer patients.
Recent studies have demonstrated that chloride channel-3 (ClC-3) is expressed in breast cancer [3], cervical cancer [4], prostate cancer [5], nasopharyngeal cancer [6], osteosarcoma [7], leukemia [8], and glioma tumors [9], and its expression increases with tumor progression. The functions of ClC-3 are associated with the pathophysiology and progression of tumors. These include cell cycle regulation, cell proliferation, migration, and apoptosis in many cancers [1011]. In our previous investigation, using flow cytometric assays, we found that silencing of ClC-3 caused cell cycle arrest in the G0/G1 phase and inhibition of cell proliferation [12]. However, downregulation of ClC-3 expression by treatment with antisense oligonucleotides arrested the cell cycle in the S phase in vascular smooth muscle cells [13]. The aim of the present study is to explore the molecular mechanisms underlying the antitumor effect of silencing ClC-3 in breast cancer.
METHODS
Quantitative real-time polymerase chain reaction
The present study was approved by the ethics committee of the Sun Yat-sen University (No. 2016-447XS) and adhered to the tenets of the Declaration of Helsinki. Additionally, written informed consent was obtained from the patients. Investigators are required to obtain informed consent before enrolling participants in clinical trials. The total RNA was isolated from human breast tissue using Trizol (Invitrogen, Carlsbad, USA). One microgram of total RNA was reverse-transcribed and used in SYBR Green real-time polymerase chain reaction (RT-PCR) as described previously [14]. Samples were run in triplicate with RNA preparation. QuantiTect primers are shown in Table 1. Quantitative RT-PCR (qRT-PCR) analyses were carried out on a MyiQ Single Color Real-time PCR Detection System (Bio-Rad Laboratories, Hercules, USA) for 40 cycles at 95℃ for 15 seconds and 60℃ for 1 minute, after an initial incubation at 95℃ for 2 minutes. The fold change in messenger RNA (mRNA) expression of target genes was calculated using the 2−ΔΔCT method with glyceraldehyde 3-phosphate dehydrogenase as an internal control.
Cells and cell culture
Human breast cancer cell lines MDA-MB-231 and MCF-7 were cultured in Dulbecco's modified Eagle's medium (DMEM) with 10% fetal bovine serum at 37℃ in 5% CO2 [15].
Transfection of MDA-MB-231 cells with stealth siRNA
The sequence of the stealth small interfering RNA (siRNA) duplex oligoribonucleotides against human voltage-gated channel 3 (RefSeq NM_173872.3) is 5′-UCACCAAGGAAA CUGCAAGAAAGGC-3′, and its corresponding complementary strand is 5′-GCCUUUCUUGCAGUUUCCUUGGUGA-3′ (Life Technologies, Carlsbad, USA). ClC-3 siRNA was transfected into MDA-MB-231 cells transiently using Lipofectamine™ RNAiMAX (Invitrogen) in accordance with the manufacturer's instructions and a negative control stealth siRNA sequence was used.
Briefly, siRNA and Lipofectamine™ RNAiMAX reagent were diluted in Opti-MEMI Medium (Invitrogen). Then, the diluted siRNA and Lipofectamine™ RNAiMAX were mixed and incubated for 20 minutes at room temperature (15℃–25℃) to allow the formation of transfection complexes. Droplets of the complexes were added to the MDA-MB-231 cells while they were in quiescent state and all were swirled gently in order to ensure uniform distribution. After incubation for 8 hours at 37℃, the final transfection mixture was removed, and the MDA-MB-231 cells were incubated under normal growth conditions before conducting the experiments. BLOCK-iT Fluorescent Oligo (Thermo Fisher Scientific, Waltham, USA) and siRNA-labeled fluorescein isothiocyanate (Life Technologies) were used to determine the transfection efficiency.
Cell counting and incorporation of bromodeoxyuridine
Cell proliferation was measured by cell counting and by bromodeoxyuridine (BrdU) incorporation as previously described [12], using a BrdU kit (Calbiochem, San Diego, USA) in accordance with the manufacturer's instructions. After incubation, cells were mixed with 10 mmol/L BrdU for 18 hours, and DNA was denatured in a fixative/denaturing solution for 30 minutes to enable antibody binding to the incorporated BrdU. Then, anti-BrdU monoclonal antibody was incubated for 1 hour at room temperature. After washing, the samples were then treated with horseradish peroxidase (HRP)-conjugated goat anti-mouse immunoglobulin G for 30 minutes. Colorless 3,3′,5,5′-tetramethylbenzidine (100 mmol/L) was added as the substrate of HRP. The colored reaction product was quantified by measuring the optical density at 450–540 nm using a microplate reader.
Cell cycle analysis
Cells were seeded, treated, and then processed for cell cycle analysis using the propidium iodide staining method as previously described [12]. Cells were analyzed for DNA content using flow cytometry. The percentage of cells containing different multiple strands of DNA was quantified.
Western blot and co-immunoprecipitation assay
Whole cell or tissues extracts were digested in radioimmunoprecipitation lysis buffer (Beyotime, Wuhan, China) containing 1 mM phenylmethylsulfonyl fluoride (Beyotime). Total proteins were isolated and quantified by bicinchoninic acid protein assay (Beyotime). The protein lysates (20 µg) were resolved by sodium dodecyl sulfate-polyacrylamide gel electrophoresis. The separated proteins were transferred onto polyvinylidene difluoride membranes and blocked at room phenylmethylsulfonyl temperature for 1 hour in Tris-buffered saline and Tween 20 with 5% nonfat dry milk. The membranes were incubated overnight at 4℃ with the primary antibodies. Then, the membranes were incubated with HRP secondary antibodies (Abcam, Cambridge, UK) for 1 hour at room temperature, and the protein bands were detected with a ChemiDoc™ XRS+ and Image Lab™ software (Bio-Rad Laboratories). Cellular protein expression and phosphorylation were determined via western blot analysis as previously described [12]. Cultured MDA-MB-231 cells were harvested for co-immunoprecipitation (co-IP) as previously described [16].
Xenograft model and in vivo treatment
All animal experiments were approved by Sun Yat-sen University for animal research and performed in compliance with the National Institutes of Health Guide for the Care and Use of Laboratory Animals (issued by the Ministry of Science and Technology of China, Beijing). Female athymic BALB/c nude mice (4 weeks old) were purchased from Vital River Laboratories (Beijing, China). Short hairpin RNA (shRNA)-mediated ClC-3-deficient MDA-MB-231 cells were obtained as described in our previous study [15]. When the mice turned 5 weeks old, 3×10⁶ shRNA-mediated ClC-3-deficient MDA-MB-231 cells and normal MDA-MB-231 breast cancer cells suspended in 100 µL of serum-free and antibiotic-free DMEM were injected subcutaneously into their flanks. Tumor dimensions were measured with a digital vernier caliper every 4 days and the tumor volume was calculated using the formula π/6×(length)×(width)2. The day of inoculation was designated as day 0, and all mice in the study were sacrificed on day 20 postinoculation.
Histology and immunohistochemistry
Tumor tissues were embedded in paraffin and 4 µm-thick transverse sections were cut and stained with hematoxylineosin. To assess the tumor burden, the tumor area in each section was measured using Metamorph software (Universal Imaging Corp., Downington, USA). Cellular proliferation was evaluated by assessing the expression of Ki-67 (Cell Signaling Technology, Beverly, USA) in the tumor sections.
Statistical analysis
Unless otherwise indicated, values are presented as mean±standard deviation and n represents the number of independent experiments. Comparisons between the two groups were performed using the unpaired two-tailed Student t-test. For comparisons of three or more groups, analysis of variance and Bonferroni multiple-comparison post hoc test were employed using the SPSS system (IBM Corp., Armonk, USA). p<0.05 was considered statistically significant.
RESULTS
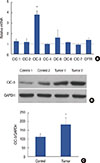
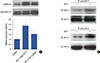
Human breast cancer tissues express chloride channels
The presence of mRNA encoding seven members of the chloride channel family and cystic fibrosis transmembrane conductance regulator (CFTR) in human breast cancer tissue was studied using qRT-PCR. qRT-PCR was performed using specific primers revealed through significant variations in expression among the different members of the chloride channel family and CFTR in human breast cancer tissues. As shown in Figure 1A, the order of relative abundance was ClC-3 (3.78±0.32), ClC-5 (1.56±0.63), CFTR (1.35±0.17), ClC-1 (1.21±0.21), ClC-2 (1.12±0.28), ClC-6 (1.08±0.12), ClC-4 (0.95±0.07), and ClC-7 (0.82±0.14). Thus, ClC-3 is the predominant member of the chloride channel family.
ClC-3 is overexpressed in breast tumor tissues compared to normal breast tissues
Figure 1B and 1C is a representative immunoblot analysis demonstrating ClC-3 expression in two of the six patients enrolled in this study. ClC-3 levels were significantly overexpressed in breast tumor tissues (upregulated by >50%, p<0.01) compared with their normal counterparts.
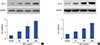
Insulin-like growth factor 1 upregulated ClC-3 expression in human breast cancer cells
ClC-3 has been found in the highly malignant human breast cancer cell lines MDA-MB-231 and MCF-7 [3]. However, it is unknown whether insulin-like growth factor 1 (IGF-1) affects the expression of ClC-3. As shown in Figure 2, western blotting indicated that the protein expression of ClC-3 was increased in MDA-MB-231 and MCF-7 cells incubated with IGF-1. When incubated with 30–300 ng/mL IGF-1 for up to 24 hours, ClC-3 protein expression was increased in a concentration-dependent manner. Exposure to IGF-1 (100 ng/mL) for 24 hours led to a 4-fold induction of ClC-3 protein expression compared with those that were treated with the substance alone (p<0.01). The additional experiments to detect the levels of IGF-1 expression by knockdown of ClC-3. The results reveal that IGF-1 was significantly decreased by knockdown of ClC-3 in secretion of MDA-MB-231 cells (Supplementary Figure 1, available online).
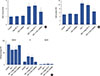
Knockdown of ClC-3 inhibits cell proliferation in human breast cancer cells
Uncontrolled cellular proliferation plays a key role in promoting breast cancer progression, so we investigated the effects of ClC-3 on the proliferation of MDA-MB-231 cells. Compared to the control group, 100 ng/mL IGF-1 led to 1.8±0.3-fold and 1.6±0.2-fold (p<0.01, n=5) increments in BrdU incorporation (Figure 3A) and cell number (Figure 3B), respectively. ClC-3 siRNA inhibited IGF-1-induced cell growth and BrdU incorporation by 82.6%±6.4% and 79%±5.7% in MDA-MB-231 cells, respectively, while negative siRNA had no significant effect on IGF-1-induced cell proliferation, excluding the nonspecificity of the siRNA and transfection reagent.
As shown in Figure 3C, serum-starved MDA-MB-231 cells in the control group were mostly in the G0/G1 (81.1%) and S phases (14.9%). After treatment with IGF-1, a decrease from 81.1% to 62.6% in the G0/G1 phase and an increase from 14.9% to 32.7% in the S phase (p<0.01, n=5) indicated that IGF-1 led to cell cycle progression, accelerating the transition from the G0/G1 to S phase. Treatment of MDA-MB-231 cells with ClC-3 siRNA resulted in an increased percentage of cell populations in the G0/G1 phase and a decreased percentage in the S phase (Figure 3C).
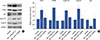
Effect of ClC-3 knockdown on cell cycle protein expression
We first analyzed the expression of two proliferation markers widely used in clinical studies, namely Ki-67 and proliferating cell nuclear antigen (PCNA) (Figure 4). The knockdown of ClC-3 inhibited proliferation in MDA-MB-231 cells compared to that in the control group, as measured by western blot analysis. To explore the mechanisms by which knockdown of ClC-3 arrests the cell cycle in the G0/G1 phase, we analyzed changes in proteins that regulate cell cycle progression, including cyclin D1, cyclin E, and cyclin dependent kinase (CDK) interacting protein 1 (p21). As shown in Figure 4, IGF-1 increased the expressions of cyclin D1 and cyclin E by 2.2±0.2 folds and 1.6±0.1 folds, respectively, and decreased the expressions of p21 by 70.9%±6.4% (p<0.01, n=5). The alterations induced by IGF-1 were completely reversed by the ClC-3 siRNA. The signal-responsive interaction of ClC-3 with IGF receptor (IGF-R) in IGF-1-treated cells induced extracellular signal-regulated protein kinases 1/2 (ERK1/2) activation.
The signal-responsive interaction of ClC-3 with IGF-R in IGF-1-induced ERK1/2 activation
We initially examined the ERK1/2 pathway to investigate events upstream to the IGF-1-induced cell proliferation. Cells treated with IGF-1 were subjected to western blotting with antibodies that specifically recognize phosphorylated ERK1/2 (pERK1/2). Then, the cells were treated with ClC-3 shRNA to confirm whether the knockdown of ClC-3 led to inactivation of pERK1/2. IGF-1-induced activation of pERK1/2 was attenuated in the presence of ClC-3 shRNA (Figure 5A). To understand how ERK1/2 activation was enhanced, we asked whether ClC-3 forms a signaling complex and functionally activates IGF-R. Interestingly, co-IP showed that ClC-3 interacted with IGF-R upon IGF-1 stimulation, in contrast to the control group (Figure 5B). Consequently, it markedly elevated the expression of ClC-3 and the signal-responsive ClC-3/IGF-R coupling was greatly facilitated, enhancing the activation of ERK1/2.
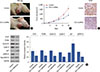
Knockdown of ClC-3 inhibits tumor growth in the xenograft carcinoma mouse model
As previously mentioned, ClC-3 is expressed in breast cancer. However, it is not clear whether suppression of ClC-3 alone can significantly affect tumorigenesis. Therefore, we transiently transfected MDA-MB-231 cells with either ClC-3 shRNA or negative control and injected them into the flanks of female nude mice. The outcome is of considerable interest, since we found that tumors derived from the MDA-MB-231 cells transfected with ClC-3 shRNA grew substantially slower compared to the negative control group during the entire tumor growth period. As shown in Figure 6A and 6B, the ClC-3 shRNA markedly inhibited tumor growth on days >18 (p<0.01). Immunostaining with anti-Ki-67 (Figure 6C) and western blot with anti-Ki-67, anti-PCNA, anti-cyclin D1, anticyclin E, and anti-pERK1/2 indicated that ClC-3 shRNA reduced tumor growth by inhibiting proliferation (Figure 6D). This was evident because the Ki-67 staining and cell cycle protein expression were much lower in the ClC-3 shRNA-treated cells than in the negative control.
DISCUSSION
The present study describes the anticancer activity of ClC-3 knockdown in cultured breast cancer cells and in tumor xenograft animal models. In vitro experiments demonstrated that knockdown of ClC-3 inhibited proliferation in the human breast cancer cell line MDA-MB-231, arresting the cell cycle in the G0/G1 phase.
To further explore how ClC-3 is involved in human breast cancer cell proliferation, we observed the effects of ClC-3 knockdown in the cell cycle of MDA-MB-231 cells. Results indicated that knockdown of ClC-3 expression arrested the cell cycle in the G0/G1 phase in MDA-MB-231 cells. The well-orchestrated cell cycle regulatory proteins govern cell cycle progression [17]. These proteins include cyclins and CDK inhibitors (CDKIs) [18]. The activities of cyclin/cyclin-dependent kinase complexes can be inhibited by CDKIs. In this study, we investigated the expression of the regulatory proteins, and it was found that knockdown of the expression of ClC-3 downregulated the expression of cyclin D1 and cyclin E while increasing the level of p21 and CDKIs, which induce G0/G1 cell cycle arrest through inhibition of the cyclin/cyclindependent kinase complexes [19]. All obtained results demonstrated that knockdown of ClC-3 inhibited the proliferation of human breast cancer cells, which is likely explained by the restriction of G0/G1 to S phase transition during the cell cycle. This blockage is correlated with the ClC-3 shRNA-mediated downregulation of cyclins and upregulation of p21.
The mitogen-activated protein kinase (MAPK)/ERK pathway is a highly deregulated pathway in carcinogenesis and tumor progression [20]. In recent years, several currently available MAPK/ERK inhibitors have shown unprecedented clinical benefits in combating breast cancer [21]. The role of the MAPK/ERK signaling pathway in the proliferation, survival, motility, and differentiation of breast cancer cells has been recently reported [22]. Moreover, MAPK/ERK inhibitors were found to suppress the proliferation of breast cancer cells [23]. The present study associates ClC-3 expression and pERK1/2 with breast cancer progression, as ClC-3 protein expression was increased in breast cancer cells (MDA-MB-231). The human breast cancer cell line MDA-MB-231 is highly aggressive and migratory, as shown in previously published studies as well as in our study [15].
The high levels of pERK1/2 were strikingly associated with poor prognosis in breast cancer, based on poor differentiation, larger tumor sizes, and an advanced stage of breast cancer. The transient ClC-3 knockdown using shRNA markedly decreased the levels of pERK1/2 in MDA-MB-231 cells. This would suggest that ClC-3 may regulate pERK1/2. Over the past decade, ClC-3 was found to be expressed in human breast cancer, cervical cancer, prostate cancer, nasopharyngeal cancer, osteosarcoma, leukemia, and malignant glioma [310]. Several groups have reported that ClC-3 may regulate tumor cell proliferation, apoptosis, autophagy, cell cycle, migration, and invasion. The present study suggests that ClC-3 plays a key role in tumor proliferation and the cell cycle. Knockdown of ClC-3 inhibited tumor growth in our mouse xenograft model of breast carcinoma. Together, the results suggest that ClC-3 may directly affect the clinical outcome of breast cancer patients.
Taken together, we found that ClC-3 acts on the ERK1/2 signal transduction pathway to inhibit the progression of breast cancer. Nevertheless, further studies are needed to verify whether the knockdown of ClC-3 exerts effects other than the inhibition of proliferation, which could account for its antitumor activity. Our data could support the development of a novel treatment for human breast cancer that targets ClC-3.
 XML Download