

 PDF
PDF ePub
ePub Citation
 Print
Print


α2-macroglobulin (α2M) is a typical acute phase protein and useful inflammatory marker in rats [12]. The serum concentrations of interleukins (IL)-6 and cytokine-induced neutrophil chemoattractant-1 (CINC-1) increased prior α2M increased, however, IL-1, IL-2, IL-4, IL-6, IL-10, and IFN-γ did not change in rats induced acute inflammation [3]. Moreover, serum concentrations of α2M increased in rats injected the mixture of IL-6 and CINC-1 rich fraction separated from serum obtained from rats during acute inflammation. Then, IL-6 and CINC-1 are considered to contribute the production of α2M in rats [4567]. α2M was produced by the liver and the serum concentrations of α2M decreased in impairment liver rats [8]. Then, α2M is not suitable inflammatory marker in the case of estimation of substance induced hepatic toxicity in non-clinical studies [8]. The serum concentrations of IL-6 and CINC-1 related with the change of α2M. Then, IL-6 and CINC-1 are considered the surrogate inflammatory markers instead of α2M. In general, cytokines are rapidly eliminated in vivo with extremely short biological half-lives [91011]. However, few reports are available on the elimination rates of IL-6 and CINC-1 produced in vivo during acute inflammation. Therefore, the aim of this study was to clarify the elimination half-lives of IL-6 and CINC-1 in rats in response to inflammatory stimulation and to determine the optimal timing for evaluating IL-6 and CINC-1 as surrogate inflammatory markers in rats.
Five Sprague-Dawley rats (age, 9 weeks; body weight, 235–375 g) were purchased from CLEA Japan, Inc. (Tokyo, Japan). The present animal experiment was approved by the Institutional Animal Care and Use Committee of Azabu University (approval no. 160610-2). Turpentine oil (Wako Pure Chemical Industries, Co., Ltd., Osaka, Japan) was intramuscularly injected at a dose of 2 mL/kg body weight. Turpentine oil has been used to induce inflammation in many previous studies, reliably and with little individual variation, and was therefore chosen to induce inflammation in this study [12]. Blood was collected by ventricular puncture before turpentine oil injection and 6, 12, 24, 36, 48, 60, 72, 84, and 96 h after injection. Injection of turpentine oil and collection of blood were conducted under anesthesia with pentobarbital at dose of 3 mg/kg (Kyoritsu Seiyaku Corporation, Tokyo, Japan) to be reduced pain and stress. The serum concentrations of IL-6 and CINC-1 at pre-injection and 6, 12, 24, 36, 48, 60, 72, 84, and 96 h post-injection were measured using the commercial enzyme-linked immunosorbent assay (ELISA) kits (Thermo Fisher Scientific Inc., Waltham, MA, USA; Immuno-Biological Laboratories Co., Ltd., Gunma, Japan). All serum sample were diluted with standard diluent buffer of kits prior application in the ELISA. The standard curves ranged of 23.5 to 1500 pg/mL IL-6 and ranged of 4.69 to 300 pg/mL CINC-1 were obtained, respectively. The detection limit of IL-6 and CINC-1 were 23.5 and 4.69 pg/mL, respectively. The serum concentrations of α2M were measured by ELISA according to the procedure of Honjo et al. in samples collected pre-treatment and 24, 48, 72, and 96 h after the turpentine oil injection [4]. All samples were diluted with phosphate-buffered saline (ph7.2) prior application in the ELISA and measured by according to method of Honjo et al. The linear slope of serum IL-6 or CINC-1 concentration versus time was then plotted on log-linear regression. The elimination rate constant (K) was calculated using a minimum of three measured serum concentrations [13]. Half-life was calculated as follows: K (h−1)=(−2.303)×slope, Half-life (h)=0.693/K. The kinetic parameters of IL-6 and CINC-1 were analyzed using the paired Student's t-test. Differences in P values <0.05 were considered significant.
The changes in serum concentrations of α2M, IL-6, and CINC-1 in rats are shown in Figures 1, 2, and 3, respectively. Kinetic parameters of IL-6 and CINC-1 are shown in Table 1. The serum concentrations of α2M increased and peaked at 48 h after turpentine oil injection, indicating that acute inflammation was successfully induced in the rats. The serum concentrations of IL-6 peaked at 12 h after the turpentine oil injection and were eliminated immediately. Serum concentrations of IL-6 were not detected after 72 h except in one rat (detection limit=23.5 pg/mL). Serum concentrations below the detection limit were set as zero. CINC-1 peaked at 24 h and exhibited biphasic elimination. The mean terminal half-lives of IL-6 and CINC-1 were 15.5 and 29.9 h, respectively. The half-life of CINC-1 was significantly longer than that of IL-6 (P=0.006).

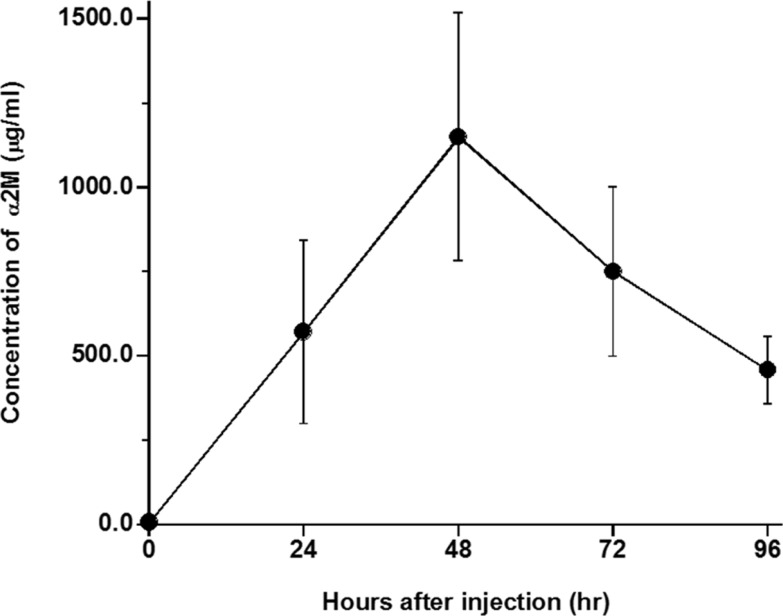 | Figure 1Serum concentrations of α2-macroglobulin (α2M) in rats after injection of turpentine oil at dose of 2 mL/kg body weight. Each point represented as mean±standard deviation (n=5).
|
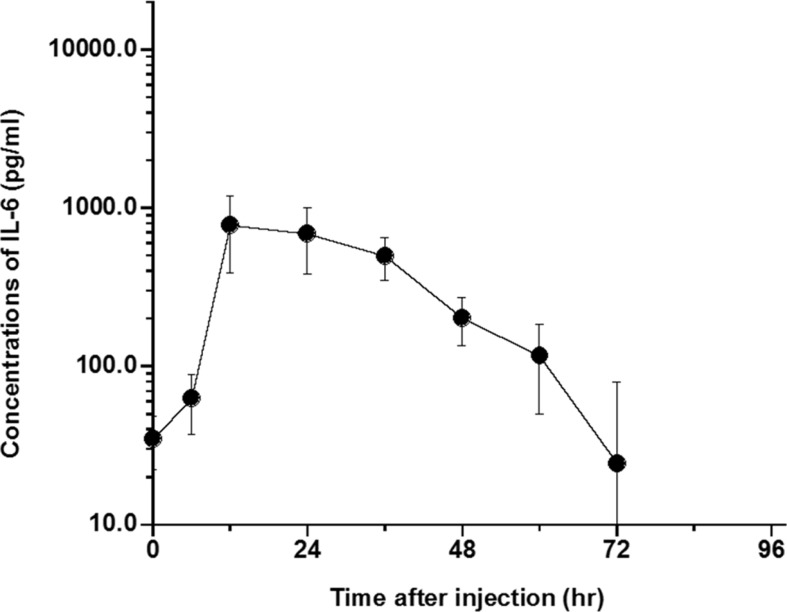 | Figure 2Serum concentrations of interleukin-6 (IL-6) in rats after injection of turpentine oil at dose of 2 mL/kg body weight (n=5). Each point represented as mean±standard deviation (n=5). IL-6 was not detected (ND) except for 1 rats at 72 hours after injection of turpentine oil and ND was calculated as zero. IL-6 was not detected at 84 and 96 hours after injection in all rats.
|
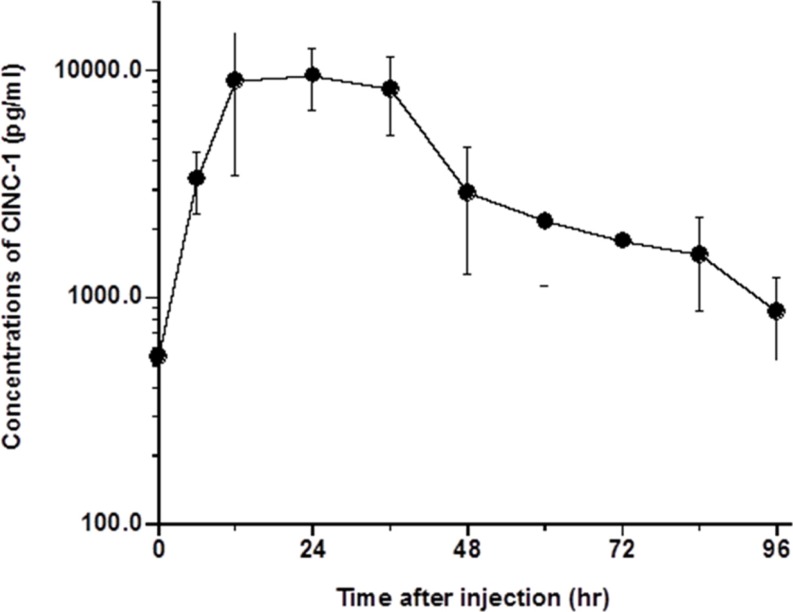 | Figure 3Serum concentrations of cytokine-induced neutrophil chemoattractant-1 (CINC-1) in rats after injection of turpentine oil at dose of 2 mL/kg body weight (n=5). Each point represented as mean±standard deviation (n=5).
|
Table 1
Kinetic parameters of interleukin-6 (IL-6) and cytokine-induced neutrophil chemoattractant-1 (CINC-1) in rats
| Cytokines | Cmax (pg/mL) | Cmax/pre-value | Elimination rate constant | Elimination half-life (hr) |
|---|---|---|---|---|
| IL-6 | 817.4±358.8 | 26.7±16.1 | 0.0463±0.0092 | 15.5±3.4 |
| CINC-1 | 11490.1±3167.9 | 20.8±5.8 | 0.0238*±0.0044 | 29.9*±5.9 |
![]()
Discussion
The terminal half-lives of IL-6 and CINC-1 were 15.5 and 29.9 h, respectively. The half-lives of IL-6 and CINC-1 were shorter than α2M and AAG, typical acute-phase proteins in rats [14], suggesting that IL-6 and CINC-1 in rats are rapidly eliminated after production by acute inflammatory stimulation. The half-lives of targeted and non-targeted mIFN-α2 in mice after intravenous dosing were reported to be 16.2 and 17.1 h, respectively [15]. These results are compatible with the half-lives of IL-6 and CINC-1 in this study. The half-life of PEG-IFN-α2 was 46.1 h in human after subcutaneous administration. The half-lives of PEG-IFN-β1a and IFN-β1a were 86.0 and 61.7 h, respectively [16]. IFN conjugated with polyethylene glycol slows down the decomposition of IFN [171819]. Moreover, these IFNs were subcutaneously administered in humans and slowly absorbed [20], suggesting that IFN slowly is absorbed and decomposes. Based on these results, the half-lives of IL-6 and CINC-1 estimated in this study were considered to be appropriate.
The elimination half-life of AAG is significantly longer than that of α2M in rats [15]. Similarly, a significant difference in the elimination half-lives of CINC-1 and IL-6 was observed in rats. Additionally, the survival time of CINC-1 was significantly longer than that of IL-6 in rats. However, the serum concentrations of IL-6 beyond 72 h were below the detection limit of the commercial ELISA kit used in this study. Conversely, the serum concentrations of CINC-1 were detectable until 96 h (detection limit=4.69 pg/mL). Therefore, the possibility of a short half-life for IL-6 is not negligible. Further measurement of serum concentrations of IL-6 using high sensitivity ELISA kits is necessary to confirm any significant differences in IL-6 and CINC-1 half-lives. In conclusion, IL-6 and CINC-1 eliminated rapidly than α2M in rats. Then, if these cytokines will be used as surrogate inflammatory markers instead of α2M, the serum concentrations of these cytokines should be measured at an early stage after peak concentration, from 12 to 18 hours after inflammatory stimulation.
Go to : 
 XML Download