

 PDF
PDF ePub
ePub Citation
 Print
Print


Zinc (Zn) is an essential trace mineral, which is involved in various biological functions of animals. The supplemental Zn to pig diet is an indispensable nutrient which is required for growth and the activity of metabolic and enzymatic functions [12]. In particular, Zn is recognized not only as a cell mediated immune modulator but also as an antioxidant for the prevention of biological oxidation [3]. More recently, dietary Zn is known to exert an important role in antioxidant defense system against oxidative stress induced by infection, heat stress, disease and pollutants [4567]. The role of Zn as a nutrient is thought to act as a biological antioxidant by protecting lipids in membranes against oxygen radicals and subsequently maintaining body homeostasis under stressful circumstances of animal production [3]. The beneficial effects of supplemental Zn on the antioxidant capacity seem to be mainly associated with its ability to synthesize CuZn-SOD and metallothionein that act as free radical scavengers [89]. It has been demonstrated that dietary supplemental Zn activates CuZn-SOD expression and metallothionein content in the liver of piglets [2]. Thus, antioxidant minerals including Zn and selenium are widely used as feed additives due to their potential and beneficial effects on animal health. The supplemental Zn to pig diet has been documented to increase growth performance by the activation of immunity, digestive enzymes, antioxidant capacity, and favorable gastrointestinal microbes [10111213]. So far, a pharmacological dose of supplemental Zn up to 4,000 ppm has been commonly used for the prevention of post-weaning diseases including diarrhea in piglets [14]. The most common sources used in animal diets are inorganic zinc oxide (ZnO) and Zinc sulfate (ZnSO4) as dietary supplemental Zn [15]. Such a pharmacologically high dose of inorganic Zn supplement, however, usually results in a very low bioavailability and subsequently could give rise to the environmental pollution of heavy metal, since up to 75 to 90% of supplemental ZnO is not absorbed [1516].
The development of high bioavailable Zn additives that are effective at a dosage lower than the pharmacological ZnO is necessary for a reduction of a dietary supplemental Zn level. Encapsulated Zn is a lipid-coated ZnO (LCZ) product, which is designed to maximize the absorption of the Zn to the small intestine without being ionized in the stomach due to the lipid protection. Our previous studies implied that a dietary supplement of 72 ppm of Zn with lipid-coated Zn was comparable to 2,000 ppm Zn as the chemical form of ZnO in its effects on alleviated diarrhea and improved intestinal villus structure in weaned piglets [17181920]. However, whether LCZ as a Zn supplement could affect antioxidant defense system in the small intestine and liver of piglets has not been extensively investigated, although the antioxidant functions of Zn have been documented. Zn is known to be an essential element for immunity and health in the gastrointestinal tract and liver, which play a central role in coordinating dietary supplemented Zn [52122]. It has also been reported that adequate Zn ingestion activated total microsomal cytochrome P450 activity in the liver of rats, which is responsible for the xenobiotic metabolism [23].
Therefore, the present study is one of the first attempts to investigate the effects of dietary LCZ and the level of LCZ compared with those of ordinary ZnO on the antioxidant defense system in the small intestine and liver of piglets.
Materials and Methods
Animal husbandry and experimental designs
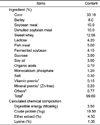
The protocols of this experiment were approved by the Institutional Animal Care and Use Committee (GNUST IACUC, 2016-04) of Gyeongnam National University of Science and Technology. A total of forty 22-d castrated piglets (average BW, 5.51±0.21 kg) born to Duroc-sired Yorkshire×Landrace dams were randomly divided into five dietary groups, with eight replicates of animals, immediately after weaning at 21-d of age. The piglets were fed a diet supplemented with 100 ppm Zn as ZnO (ZnO-1), 2,500 ppm as ZnO (ZnO-2), 100 ppm Zn as 10% (w/w) lipid-coated ZnO (LCZ-1, CTCBIO Inc., Seoul, Korea), 200 ppm Zn as LCZ (LCZ-2), or 400 ppm Zn as LCZ (LCZ-3), respectively. The basal corn-soybean meal diet was formulated to meet the NRC requirement of all nutrients (NRC, 2012, Table 1), and all animals were allowed ad libitum access to one of the five experimental diets and water for 2 weeks. The body weight of the piglets and feed intakes were recorded on days 0, 7, and 14 to calculate the average daily gain and feed intake during the experimental period. The room temperature was maintained at 29 to 30℃ during the feeding periods.
Tissue harvesting
At the end of the 14-d feeding period with supplemental Zn, all piglets (n=8) were deprived of diet for 12 h and then were sacrificed with electric stunning. Immediately after opening the abdominal cavity, blood was collected in tubes coated with sodium heparin, and then their jejunal section of the small intestine and the left lobes of the liver were harvested as previously described [17]. The harvested tissues were then rapidly frozen in liquid nitrogen and stored at −70℃ until further assay.
mRNA Expression of antioxidant genes by Real Time-PCR
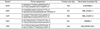
The mRNA expression of antioxidant enzymes, including CuZn-superoxide dismutase (SOD), glutathione peroxidase (GPX), catalase (CAT), and glutathione S-transferase, (GST) was quantified by real-time PCR (Bio-rad, CA, USA). Total RNA was extracted from the jejunal mucosa and liver tissues using RNAzol TM B (Tel-Test Inc, TX, USA). Briefly, 100 mg of tissues mixed with 2 mL of RNAzol solution were homogenized using liquid nitrogen. After that, 100 µL of chloroform was added to a micro-tube and incubated for 5 min on ice. Next, the aqueous phase was separated by centrifugation (15 min at 15,000×g), after which the isolated RNA was precipitated with the same volume of isopropanol and then centrifuged (15 min at 15,000×g). The isolated total RNA was then washed with 75% ethyl alcohol, dried, and diluted with diethylpyrocarbonate (DEPC)-treated H2O, after which the optical density at 260 nm was applied to quantify the concentration of RNA (GeneQuant pro spectrophotometer, Amersham, Piscataway, NJ. USA). After that, 5 µg of total RNA were incubated with 1.0 g of oligo dT (Invitrogen Co., Carlsbad, CA, USA) at 70℃ for 5 min and 4℃ for 5 min to produce the first strand cDNA. The reaction mixture was incubated at 42℃ for 50 min, 90℃ for 10 min and 42℃ for 50 min in a reaction cocktail containing 5× first strand buffer, 2.5 mM dNTP, 0.1M DTT, superscript III and RT-mixture. The expression of antioxidant enzymes and the housekeeping gene TATA box binding protein (TBP) were quantitated by real-time quantitative PCR with SYBR green supermix (BioRad, CA, USA) under the following conditions: 5 min at 95℃, followed by 40 cycles of denaturation at 95℃ for 15 s and annealing at 60℃ for 30 sec and then extension at 72℃ for 30 sec. The cDNA primers including internal standard gene used to amplify antioxidant genes are shown in Table 2. The PCR amplification cycle at which dye fluorescence passed the selected baseline (CT) was determined by real-time monitoring. The mRNA expressional level of each gene in piglets fed the diet with 100 ppm ZnO was assigned a value of 1 and the 2−ΔΔCT method as described by Livak and Schmittgen [24] was adopted to calculate the relative gene expression.
Antioxidant enzyme activity, lipid peroxidation and total antioxidant capacity
To harvest cytosol and microsomal fraction from tissues of the jejunal mucosa and liver, an isolation procedure was conducted using the method described by Kupfer and Levin [25]. The tissues (1 g) were homogenized with a solution containing 0.25 M sucrose, 0.05 M Tris-HCl (pH 7.4), 0.005 M MgCl2, 0.025 M KCl and 0.008 M CaCl2 using a tissue grinding homogenizer (Omni TH, NW Kennesaw, GA, USA). The homogenate tissues were then centrifuged at 10,000×g for 15 min, after which the resulting supernatant was diluted 1: 6 volumes with a solution containing 0.0125 M sucrose, 0.005 M MgCl2, 0.025 M KCl and 0.008 M CaCl2. Following that, diluted supernatant was centrifuged at 1,500×g for 10 min, after which the resulting supernatant was harvested as a cytosolic fraction. The resulting pellet suspended in 0.25 M sucrose solution was centrifuged at 1,500×g for 10 min. After that, the remnant pellet was suspended in cold 1.15% KCl solution as a microsomal fraction. The harvested supernatant (cytosol) and a suspended pellet (microsomes) were stored at −70℃ until further assay.
The activity of CuZn-SOD in the cytosolic fractions was determined using a commercial SOD assay kit (Sigma-Aldrich, St. Louis, MO, USA) based on an indirect assay method of xanthine oxidase as described in the manufacture's protocol. The specific activity of SOD was expressed as units/mg of proteins, where one unit of activity is the amount of enzymes required to inhibit 50% of the SOD or SOD like substances. Cytosolic GPX was measured at 37℃ using cumen hydroperoxide as a substrate [26]. The GPX coupled the reduction of cumen hydroperoxide to the oxidation of NADPH by gluthathione reductase, and concomitant oxidation was assessed by a spectrophotometer with a decrease in absorbance at 340 nm. One unit of GPX is described as the amount of GPX needed to oxidize 1 µmol of NADPH per min. GST in the cytosol was measured using CDNB as a substrate and monitored increase in absorbance at 340 nm [27]. One unit of activity was expressed as the amount of enzyme catalyzing the conjugated CDNB per minute. CAT activity was assessed by the amount of hydrogen peroxide, which was converted by CAT. The decomposition of the substrate was measured using a spectrophotometer at 240 nm and one unit activity was expressed as moles of H2O2 consumed per minute per mg protein [28]. The lipid peroxidation concentration in the microsomes was measured by the production of thiobarbituric acid (TBA) substances using a spectrophotometer at 532 nm [29]. TBA substances are expressed as nmol of malondialdehyde (MDA) per mg of protein. Total antioxidant power in plasma was assayed using a commercially available assay kit with an ELISA reader (Oxford Biomedical Research, Inc. MI, USA). Assay procedures were carried out according to the manufacturer's protocols. Trolox was used to generate a standard curve, and data were presented as mM Trolox equivalents or in µM copper reducing equivalents. Protein concentration was determined by BCA method (Pierce™ BCA Protein Assay Kit, Pierce Biotechnology, Rockford, lL, USA) using an ELISA (VMax, Molecular Devices, CA, USA).
Statistical analysis
Data (Mean±SE) difference among treatment groups was analyzed by the general linear model (GLM) procedure of SAS (SAS Institute Inc., Cary, NC, USA). Significant difference among dietary groups was examined using Tukey's test. Within the LCZ groups, the linear (L) and quadratic (Q) regressions of each variable in response to the dietary LCZ level were analysed using the regression procedure of SAS. A P value of <0.05 was considered as statistically significant.
Results
Body weight and feed efficiency of piglets did not differ between dietary supplementation with ZnO (100 and 2,500 ppm) and LCZ (100, 200 and 400 ppm) during the feeding period of 14-d (data not shown).
mRNA expression and activity of antioxidant genes in the intestine and liver
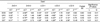
The effects of dietary supplementation with ZnO (ZnO-1 and ZnO-2 groups) or lipid-coated ZnO (LCZ-1, LCZ-2 and LCZ-3 group) on the mRNA expression of antioxidant enzymes in jejunal and liver tissues are presented in Tables 3 and 4, respectively.
In jejunal mucosa (Table 3), piglets fed the diet supplemented with 400 ppm of LCZ (LCZ-3) showed significantly higher (P<0.05) mRNA expression levels of SOD, CAT, and GST than those fed the diets supplemented with 100 ppm of ZnO (ZnO-1) and 100 ppm of LCZ (LCZ-1). Furthermore, the GPX mRNA expression of the LCZ-3 group was significantly higher (P<0.05) compared with that of the ZnO-1, ZnO-2, LCZ-1, and LCZ-2 groups. The maximum mRNA expression of antioxidant enzymes in jejunal mucosa of piglets was observed in the diet supplemented with 400 ppm of LCZ. In particular, the mRNA expression levels of GPX and GST in the jejunum of piglets fed 400 ppm of LCZ increased by 11.61 and 13.45 folds compared with those of piglets fed 100 ppm of ZnO, respectively. However, no difference was observed in the mRNA expression of antioxidant genes between the ZnO-1 and ZnO-2 groups. Within the LCZ groups, the mRNA expression levels of SOD, GPX, CAT, and GST in jejunal mucosa of piglets showed significant (P<0.01) linear and quadratic effects (P<0.01) on the supplemental LCZ level.
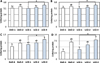
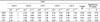
The pattern of antioxidant enzyme activity in the jejunum was similar to that of the mRNA expression of these enzymes (Figure 1). The LCZ-3 group exhibited significantly greater (P<0.05) specific activities of SOD, GPX, and GST than those of the ZnO-1 and LCZ-1 groups.
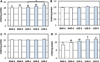
In the liver (Table 4), the mRNA expression of SOD, GPX, CAT and GST was not significantly different among the LCZ groups or between the ZnO-1 and ZnO-2 groups. However, the specific activities of hepatic SOD and GST in the piglets fed the diet supplemented with 400 ppm of LCZ (LCZ-3) were significantly greater (P<0.05) than those fed the diet supplemented with 100 ppm of ZnO (ZnO-1, Figure 2). No difference in hepatic mRNA expression and activity of antioxidant enzymes was observed among the ZnO-2, LCZ-1, LCZ-2 and LCZ-3 groups.
Antioxidant capacity in plasma and lipid peroxidation in the intestine and liver
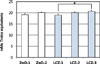
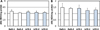
The effects of dietary ZnO (100 and 2,500 ppm) or LCZ (100, 200, and 400 ppm) on total antioxidant power (TAP) in plasma, and lipid peroxidation (MDA) in jejunal and hepatic tissues of piglets are depicted in Figures 3 and 4. There was no significant difference in TAP and MDA among the five treatment groups, although plasma TAS showed linear and quadratic (P<0.05) increases as increasing supplemental LCZ dose within the LCZ groups.
Discussion
The previous literature has reported that dietary source and level of Zn influenced the antioxidant status in animals [24], since bioavailability of Zn is directly associated with the synthesis of CuZn-SOD and metallothionein, which act as free radical scavengers against reactive oxygen species [8]. As a matter of fact, Zn deficiency in rats gave rise to an increase in oxidative stress and DNA damage, and this was alleviated by a dietary supplemented Zn [30]. It has also been demonstrated that piglets fed the diet supplemented with organic Zn-chelate exhibited a greater deposition of Zn and levels of SOD, GPX, and metalothonemin compared with those fed the diet supplemented with inorganic ZnO [31]. Therefore, the beneficial effects of supplemental Zn on the extent of antioxidant capacity should be associated with its bioavailability to cope with reactive oxygen species.
A ZnO product coated with lipid was developed to maximize the rate of ZnO absorption through the small intestine without being ionized in the stomach due to its physical properties [18]. The present study focused on the effects of LCZ and the level of LCZ on the antioxidant defense system in the small intestine and liver of piglets in comparison with ordinary ZnO.
Our data indicated that piglets fed the diet supplemented with 400 ppm of LCZ markedly increased mRNA expressions and activities of SOD, CAT, GPX, and GST in the jejunum compared with those fed the diet 100 ppm of ZnO or 100 ppm of LCZ. Within the LCZ groups, the mRNA levels and activities of SOD, GPX, CAT and GST resulted in significant linear and quadratic effects on the supplemental LCZ concentration. However, the degree of lipid peroxidation in the jejunum was unaffected by dietary source and level of Zn. An important function of the small intestine is to serve as the first membrane barrier between external and internal milieu in the body and subsequently immense defense and adaptation phenomena for ingested substances would occur [32]. Thus, intracellular antioxidant defense mechanism that occurred at the small intestine is more profound than any other organs under ingestion of dietary nutrients [32]. However, the study focusing on the effects of dietary LCZ on the antioxidant defense system compared with ordinary ZnO is very limited. In this study, intestinal antioxidant enzymes were markedly affected by dietary source of Zn, which was in agreement with the previous report [22], which indicated that piglets fed the diet supplemented with ZnO nanoparticles (600 ppm) increased mRNA expression of SOD and GPX in the jejunum compared with those fed the diet with 90 ppm of Zn.
Comparing with other antioxidant enzymes, a 13.45 fold increase in GST activity of the jejunum in response to 400 ppm of LCZ gave us interesting results. The increased activity of GST plays a major role in phase II of drug-metabolism where GST contributes to the survival of intestinal mucosal cells by biotransformation of harmful foreign substances [33], suggesting that a 400 ppm of LCZ diet to the piglets activates the detoxification of xenobiotics and subsequently protects against oxidative free radicals in the small intestine.
Similarly, the study [34] reported that Zn supplementation at 20, 40, 60, and 80 ppm from Zn bearing palygorskite linearly increased CuZn-SOD activity in the jejunum of chickens. This study also indicated that dietary Zn from Zn bearing palygorskite inhibited lipid peroxidation as indicated by serum MDA of chickens. However, we did not observe changes in MDA level of the jejunum among dietary Zn source and level. The reason for the unchanged lipid peroxidation in our study is not clear but can be partly explained by the fact that the level of 100 ppm of ZnO was enough to maintain intestinal cellular integrity under the circumstances of this study. Thus, we concluded that 400 ppm of LCZ might have many more positive effects on the antioxidant enzymes of the intestine compared with a pharmacological dose (2,500 ppm) of ordinary ZnO.
Zn is essential to the development and functions of the liver, which plays a vital role in the metabolism of ingested nutrients and protection against oxidative stress induced by numerous metabolic processes [35]. From our study, the activities of hepatic SOD and GST in piglets fed 400 ppm of LCZ were significantly greater than in those fed 100 ppm of ZnO, although mRNA expression of these enzymes in the liver was not affected by dietary source of Zn. Elevated hepatic SOD and GST activities in response to 400 ppm of LCZ diet suggest that LCZ may readily absorbed and play a vital role in the self-protective mechanism against oxidative stress in the liver, although its effect on the liver was not as much as that on the small intestine of piglets. Similar with our study, another study [6] reported that dietary Zn level at 0, 20, 40 and 60 mg of diet from Zn-chelate linearly increased CuZn-SOD and GPX activities in the liver of chickens without affecting lipid peroxidation. It is speculated that this discrepancy of the relationship between antioxidant enzymes and lipid peroxidation among the studies was likely attributed to differences in the degree of oxidative stress conditions under the circumstance of studies.
The protective effects of antioxidant substances including Zn on oxidative stress may be not only likely due to antioxidant enzymes but also may be mediated through their non-enzymatic antioxidant activity [3]. The extent of cellular damage induced by excess oxidative stress relies on the balance between production of oxidants and removal by the enzymatic and non-enzymatic antioxidant system. In the enzymatic antioxidants, CuZn-SOD, widely distributed in oxygen metabolizing cells, directly converts superoxide anion to hydrogen peroxide [36]. The GPX enzyme, which is responsible for antioxidant action that converts H2O2 to H2O using glutathione. CAT, a heme-containing enzyme is also involved in the conversion of H2O2 to H2O in the antioxidant defense system [37]. The non-enzymatic antioxidants responsible for the first line of defense system in the body are represented by albumin, ceruloplasmin, uric acid, transferrin, glutathione, metallothionein, etc. [38]. Among various non-enzymatic antioxidants, Zn originated from dietary source is considered an important antioxidant, which can profoundly affect the activity of endogenous antioxidant defense system [38]. In fact, Zn is known to be a cofactor of CuZn-SOD, which is a crucial first defense line of antioxidant enzyme against oxidative radicals [3]. Besides, its beneficial effects on the synthesis of CuZn-SOD, Zn is a component of metallothioneins that plays a protective role in antioxidant defense against free radicals [39]. Zn itself participates in antagonizing the activities of bivalent metals such as iron and copper, which are known to be an important initiator of free radical oxidations such as lipid peroxidation and DNA damage [30].
Taken together, dietary supplementation with 400 ppm of LCZ was the most effective in increasing mRNA expression and activities of antioxidant enzymes in the jejunum and liver. As a level of Zn supplement, our data indicated that 200 ppm of LCZ was comparable to 2,500 ppm of ordinary ZnO for enhancing antioxidant defense system in piglet. Our previous study has reported that dietary supplementation with 72 ppm of Zn using LCZ was comparable to 2,000 ppm Zn as ZnO in its effects on the alleviation of diarrhea and intestinal villus architecture in piglets [18].
Intestinal Zn absorption is a carrier-mediated process, which is associated with the family of Zn transporters (ZnT) including ZnT-1, ZnT-2, ZnT-5, and metallothionein in animals [40]. It is well documented that Zn absorption in the intestine is significantly affected by various factors including the chemical form of Zn, supplemented level of Zn, dietary composition, etc. [151718]. In this study, enhanced antioxidant enzymes in response to 400 ppm of LCZ in the piglet may be due to increased Zn absorption by its lipophilic properties of LCZ compared with ordinary ZnO. The increased bioavailability of Zn from LCZ can lead to the activation of antioxidant enzymes in the small intestine compared with ordinary ZnO, suggesting that properties of dietary Zn source with a higher bioavailability is to ultimately lower the environmental burden of Zn pollution. Further studies are still needed to elucidate the exact mechanism by which LCZ transports across the small intestine and how much Zn from LCZ can be deposited into organs in piglets.
In conclusion, 400 ppm of LCZ in piglets resulted in a maximum increase in the expressions of antioxidant enzymes especially in the small intestine and liver compared with 100 or 2,500 ppm of ordinary ZnO, indicating that, as a Zn supplement, LCZ was more effectively bioavailable compared with ZnO for enhancing the antioxidant defense system in piglet.
 XML Download