

 PDF
PDF ePub
ePub Citation
 Print
Print


INTRODUCTION
Identifying allergens to which patients are sensitized could modify their clinical course; however, it is almost impossible to check all possible causative allergens. To overcome this inconvenience, multiple allergen simultaneous test (MAST), a simple and reliable method, has been widely used to identify allergen-specific IgE. It can detect many kinds of allergen immunoglobulin (Ig)Es at one time with relatively small serum volume.
Previous research revealed that some allergens tend to sensitize simultaneously more than others, and hence these were grouped into a cluster reflecting the biological classification of the allergen sources1 or co-exposure. It is known that prevalence of allergen sensitization is higher in male group than female123. To our knowledge, research investigating the sensitization cluster patterns with their positive differences between male and female groups is limited. Therefore, we performed a cluster analysis and comparative study in 4,360 patients in a single center. The aim of this study was to investigate the allergen sensitization cluster patterns and the differences in allergen sensitization characteristics based on gender.
MATERIALS AND METHODS
We enrolled all patients with MAST results who visited Department of Dermatology at SMG-SNU Boramae Medical Center, Seoul, Korea, between 2008 and 2014. The RIDASCREEN® Allergy ELISA (R-Biopharm AG, Darmstadt, Germany) was used to detect the IgE to specific antigens in the serum. In total 39 allergens were evaluated to check whether sensitized or not as follows: Acarus siro, alternaria, Aspergillus fumigatus, barley meal, beef, birch-alder, buckwheat meal, Candida albicans, cat, cheddar, chicken, citrus (lemon, lime, orange), Cladosporium herbarum, cockroach, codfish, crab, Dermatophagoides farinae, Dermatophagoides pteronyssinus, dog, egg white, garlic, house dust, milk, mugwort, oak white, onion, peach, peanut, pork, ragweed short, rice, rye, salmon, shrimp, soybeans, tomato, tuna, wheat flour, and baker's yeast. The gender and MAST result data were retrieved. The test categorizes each allergen-specific IgE level class from 0.0 to 6.0 semi-quantitatively. Allergen to which specific IgE was measured as class 2.0 or above (≥0.70 IU/ml) was defined to have sensitized the patient, i.e., positive result. First, to find out allergens which simultaneously sensitized patients, cluster analysis was performed. The allergens were clustered based on whether they were positive concurrently in each patient. Second, the ratio of sensitization to each allergen was compared between male and female group. In addition, total IgE levels, if measured in MAST positive patients, were also compared. This study was approved by Institutional Review Board in SMG-SNU Boramae Medical Center (20150730/26-2015-92/082).
Statistical analysis
Data were analyzed using IBM SPSS Statistics ver. 20.0 (IBM Co., Armonk, NY, USA). To cluster the allergens, phi coefficients between every two among 39 antigens, with regards to whether they sensitized the patients or not, were calculated at first. Afterwards, hierarchical agglomerative methods with between-groups linkage analysis were used, based on the coefficients. The sensitization ratio of each allergen was compared between male and female by Pearson's chi-square test or Fisher's exact test (for expected cells <5 in the SPSS program). p-values <0.05 were considered statistically significant.
RESULTS
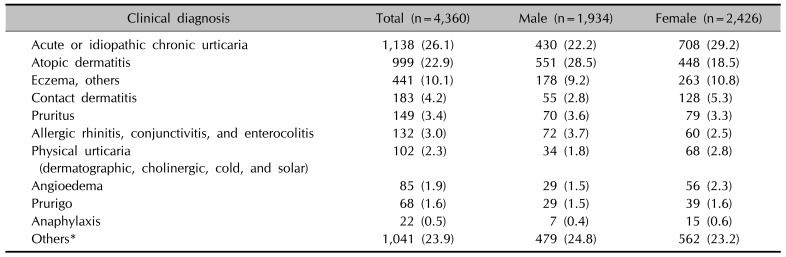
Enrolled in this study were 4,360 cases. 1,934 cases were male (44.4%, 20.1±21.0 years old) and 2,426 cases female (55.6%, 27.2±21.8 years old). Table 1 shows the main clinical diagnosis of the enrolled patients. The most common clinical diagnosis was acute or idiopathic chronic urticaria (1,138, 26.1%), followed by atopic dermatitis (999, 22.9%), eczema (441, 10.1%), contact dermatitis (183, 4.2%), and pruritus (149, 3.4%). The clinical diagnoses in the remaining 1,041 patients (23.9%) were infectious skin disorders, drug eruption, allergen sensitization screening purpose and systemic disorders, i.e., gastrointestinal/hematological/endocrinological disorder, and respiratory disorder except asthma.
Cluster analysis of the positive allergens
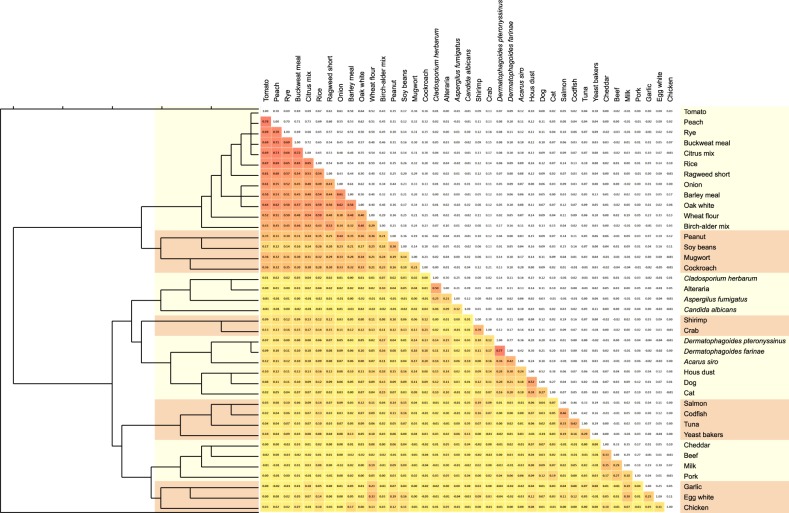
All tested allergen-specific IgE were positive in at least one patient. These allergens could be clustered by hierarchical cluster analysis method on the basis of phi coefficients between every two sensitizing item. Fig. 1 depicts it in detail with a dendrogram. The 39 allergens were grouped into 8 clusters as follows: 1) Tomato, peach, rye, buckwheat meal, citrus mix, rice, ragweed short, onion, barley meal, oak white, wheat flour, and birch-alder mix; 2) Peanut, soybeans, mugwort, and cockroach; 3) C. herbarum, alternaria, A. fumigatus, and C. albicans; 4) Shrimp and crab; 5) D. pteronyssinus, D. farinae, A. siro, house dust, dog, and cat; 6) Salmon, codfish, tuna, and baker's yeast; 7) Cheddar, beef, milk, and pork; 8) Garlic, egg white, and chicken.
Comparative analysis between male and female
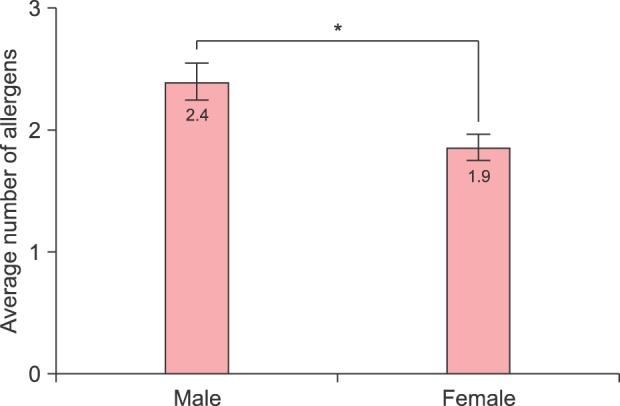
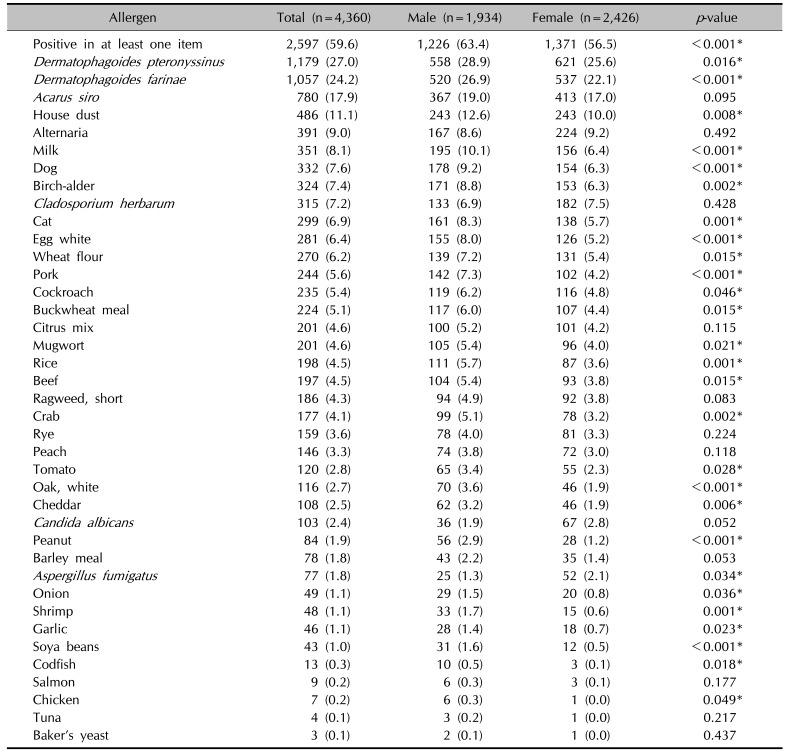
Table 2 compares the allergen sensitization between each gender. The case with maximum positive allergen number was sensitized to 25 items. The number of sensitizing allergens in male group tended to be higher than in females (2.4 vs. 1.9, p<0.001) (Fig. 2). The proportion of sensitization to at least one allergen was higher in male group than in female (63.4% vs. 56.5%, p<0.001).
There were 39 allergens to be evaluated. The most common sensitizing allergen was D. pteronyssinus (27.0%), followed by D. farinae (24.2%) and A. siro (17.9%), while sensitization to salmon, chicken, tuna, and yeast were less than 10 cases (nine, seven, four, and three cases, respectively). All tested allergens tended to sensitize males more frequently than females, except for the following four items: alternaria, C. herbarum, C. albicans, and A. fumigatus. Among them, 27 revealed differences between both groups with statistical significance (p<0.05). Among 4,360 cases, 3,293 (75.6%; male: 1,455, female: 1,837) patients had total IgE (normal value, ≤100 IU) level checked, which was higher in the male group than in the female group (500.1 IU vs. 281.8 IU, p<0.001).
DISCUSSION
To our knowledge, no detailed clustering analysis of sensitizing allergens in conjunction with comparative analysis of IgE to allergens between male and female has been reported with various antigens. In the hopes that clustering multiple allergens and understanding the differences between male and female would advance our knowledge on the allergen sensitization pattern in the clinical setting, we investigated MAST results with 39 kinds of allergens in 4,360 cases (1,934 male and 2,426 female).
Allergen clustering was performed to find out the association of each allergen. The analysis was based on phi coefficients, which reflected the association between two allergen items out of 39. In the study population, all tested 39 allergens were positive in at least one patient. The 39 items were grouped into 8 clusters. The association in each cluster could stem from allergenic epitope similarity (cross reactivity), or co-exposure and sensitization without epitope alikeness45.
Cluster 1 is tomato, peach, rye, buckwheat meal, citrus mix, rice, ragweed short, onion, barley meal, oak white, wheat flour, and birch-alder mix: this cluster could be explained by cross reactivity of profilins and lipid transfer proteins. Profilins and lipid transfer proteins are very common proteins in the plants, both of which are used as a multiple pollen marker678. In this regard, the association among the allergens in this cluster was very strong (the red squares in Fig. 1).
Cluster 2 encompassed peanut, soy beans, mugwort, and cockroach: allergens in peanut and soy beans share IgE epitope similarity, and their association was reported910. A recent Chinese study11 revealed a solid correlation between peanut sensitization and mugwort in terms of lipid transfer protein from each allergen. The most inspected allergenic molecules of cockroach is tropomyosin, which causes co-sensitization of cockroach with shellfish12. In this study, however, cockroach was clustered with peanut, soy beans, and mugwort, instead of cluster 4 (shrimp and crab). More future study is warranted to find out a common or similar epitope between cockroach and mugwort.
Cluster 3 is C. herbarum, alternaria, A. fumigatus, and C. albicans; all of them are fungal allergens. Although cross-reactivity between C. herbarum and alternaria had been established, neither of them cross-reacted with A. fumigatus in one study13. On the other hand, Breitenbach et al.14 reported that it would be enolases that make C. herbarum, alternaria, A. fumigatus, and C. albicans cross-reactive.
Cluster 4 is shrimp and crab; tropomyosin is the major allergen of the shellfish family, including shrimp and crabs121516. Sequences of tropomyosins of shrimps, prawns, lobsters, and crabs manifested 91%~100% similarity, and those of mites have 78.5%~81.7% homology to shrimp tropomyosin17. It is suggested that tropomyosin could play a major role associating clusters 4 and 5.
Cluster 5 is D. pteronyssinus, D. farinae, A. siro, house dust, dog, and cat; cross reactivity among D. pteronyssinus, D. farinae, and A. siro are well established at both molecular animal levels718. Association of IgE epitopes of cat and dog allergens was presented by Spitzauer et al.19, and it turned out to be albumin20. House dust sensitization could be a result of co-exposure to cat and dog, as they are all indoor allergens.
Cluster 6 is salmon, codfish, tuna, and baker's yeast; parvalbumin, a calcium-binding protein, is a pronounced fish allergen21. As such, recombinant parvalbumin can be used as a basophil histamine releaser in fish-allergic patients22. Baker's yeast is fungal species, but when analyzed, too low a positivity ratio (0.07%) would make it classified into cluster 6 rather than cluster 3 (fungus).
Cluster 7 is cheddar, beef, milk, and pork; in this cluster cross reactivity could be explained by albumins, which are responsible for sensitization to meats and other foods from the same origin. About 10% to 20% of the children sensitized to milk are allergic to beef, and 93% of those sensitized to beef are allergic to milk2324. Also galactose-alpha-1,3-galactose was reported to be relevant to the sensitization to beef, pork, or lamb25.
The last cluster, cluster 8, is garlic, egg white, and chicken: bird-egg syndrome by chicken serum albumin (egg yolk alpha-livetin) is well established26. Alliin lyase is known to be a major garlic allergen27. However, there has been no research on the cross-activity between alpha-livetin and alliin lyase in the literature to date, requiring future validation.
We found that 35 of 39 allergens sensitized male subjects more frequently in this study. In agreement with previous reports12829303132, almost all sensitizing allergens (35 items) sensitized more males than females, with 26 of them exhibiting statistical significance. Furthermore the average number of sensitized allergens was 2.4 in male and 1.9 in female, respectively (p<0.001, Fig. 2). In addition, proportion of sensitization to at least one allergen in this study was higher in male group (63.4%) than in female (56.5%) (p<0.001).
Interestingly, 4 allergens out of 39 items, which were classified into the cluster 3 (fungus), were found to sensitize more female than male. This result is opposite to a general population study from America1. It could be associated with living environment or ethnic background. Fungal species are key indoor environmental allergens and are associated with indoor storage of organic household waste3334. The fact that female group was more often sensitized to cluster 3 items C. herbarum, alternaria, A. fumigatus, and C. albicans could be attributed to the fact that female are more prone to do housework than male. More future study is needed to find out the etiology of fungal sensitization in female group.
This study has limitations. First, the test for detecting allergen IgE was MAST. So far the gold standard is skin prick test for detecting IgE. However, this latter method can lead to inter- or intra-evaluator error due to the test method itself, including inconsistent procedure process and subjective assessment by each investigator. In addition, previous studies validated reliability of MAST by comparing with skin prick test and ImmunoCAP assay, resulting in 89.2% and 81.8% concordance rate, respectively3536. Therefore, MAST is a quick and reliable method to study IgE sensitization pattern. Second, the diagnoses of cases were heterogeneous in this study. The allergen sensitization characteristics are affected by associated diseases, i.e., asthma, rhinitis, and eczema37. In this respect, disease-matched comparison between male and female could provide more accurate information. Nonetheless, the results of this study may provide preliminary results on the differences in gender allergen sensitization pattern. The majority of enrolled cases had associated cutaneous diseases, and it is not uncommon to have more than two diseases at the same time in one patient, i.e., urticaria, atopic dermatitis, and other eczematous disorders. Disease-controlled prospective studies are needed to confirm that female group is more prone to be sensitized to fungal allergens.
In conclusion, these cluster and comparative analysis results show that the sensitizing allergens could be clustered by allergenic molecules' cross-activities or co-exposure. When a patient is confirmed to be sensitized to certain antigens and cutaneous symptoms are aggravated by them, physicians could advise the patient to avoid or be aware other antigens, based on the proximity on the dendrogram. The positive ratio of each allergen differs distinctly between male and female. Although almost all the tested allergens sensitized male group more frequently, the fungus allergens, cluster 3, tended to sensitize female group more frequently. These results may aid in better understanding of the association of multiple allergen sensitization and the differences between each gender.
 XML Download