

 PDF
PDF ePub
ePub Citation
 Print
Print


INTRODUCTION
MATERIALS AND METHODS
Phantom
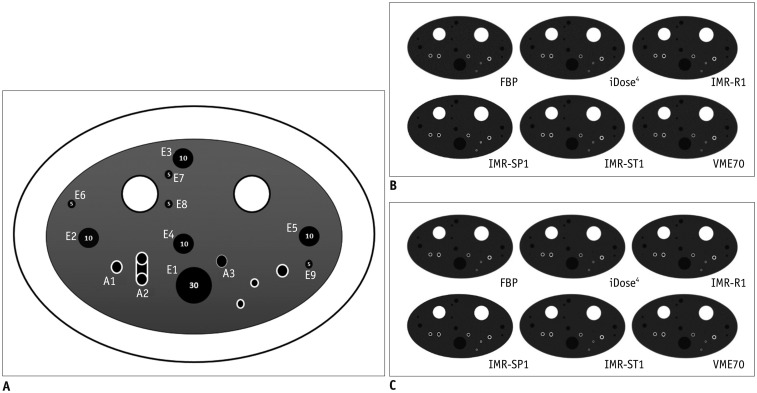 | Fig. 1Illustration and CT images of CTP674 lung phantom (The Phantom Laboratory).
A. Illustration of CTP674 lung phantom. Nine air columns with three different diameters and volumes were chosen for EV measurements (E1–E9), and three polycarbonate tubes (airway tubes) with different wall thicknesses and angles were analyzed for airway wall measurements (A1–A3). Two airway tubes (A1 and A2) were placed at different angle of 30° from z-axis of CT couch. B. CT scans with various algorithms at low-dose setting. C. CT scans with various algorithms at standard-dose setting. CT = computed tomography, EV = emphysema volume, FBP = filtered back projection, IMR-R1 = MIR with image definition of body routine level 1, IMR-SP1 = MIR with image definition of sharp plus level, IMR-ST1 = MIR with image definition of body soft tissue level 1, MIR = model-based iterative reconstruction, VME70 = standard virtual monoenergetic dataset at 70 keV
|
Table 1
Characteristics of Each Air Column and Each Airway Tube Inserted into CTP674 Lung Phantom (The Phantom Laboratory)
| Diameter (mm) | Air Columns for EV | Reference Volume (mm3) |
|---|---|---|
| 30 | E1 | 28.416 |
| 10 | E2, E3, E4, E5 | 3.157 |
| 5 | E6, E7, E8, E9 | 0.789 |
| Diameter (mm) | Airway Tubes for Airway Measurements | Reference WA% |
|---|---|---|
| 6 | A1 | 48.98 |
| 6 | A2 (oblique) | 48.98 |
| 6 | A3 | 40.83 |
![]()
CT Image Acquisition
Image Reconstruction Techniques
Emphysema Volume Measurements and Airway Wall Measurements
Statistical Analysis
RESULTS
Accuracy of Emphysema Volume
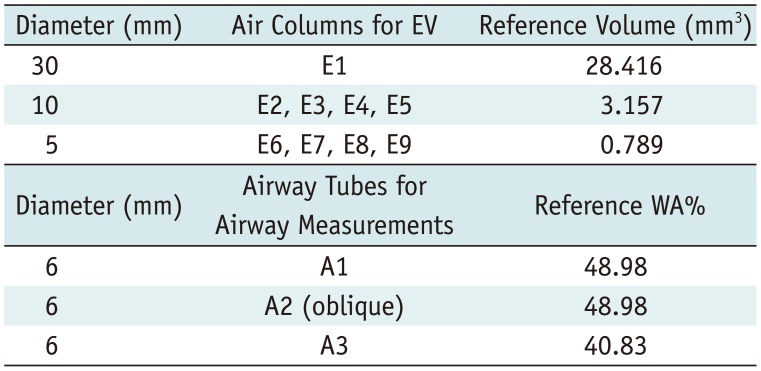
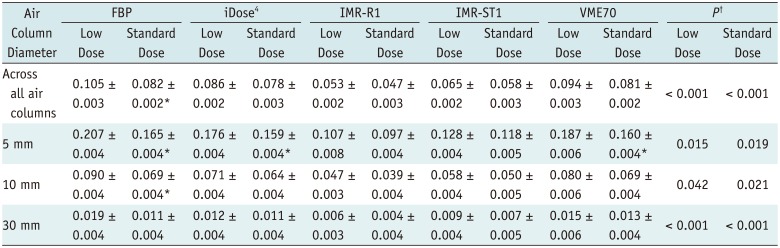
 | Fig. 2APEvol of across all air columns (all of 5-, 10-, and 30-mm air columns) on (A) low-dose CT and (B) standard-dose CT.Mean APEvol in all air columns was lowest in IMR-R1 in both low-dose and standard-dose settings. APE = absolute percentage measurement error, APEvol = APE of EV
|
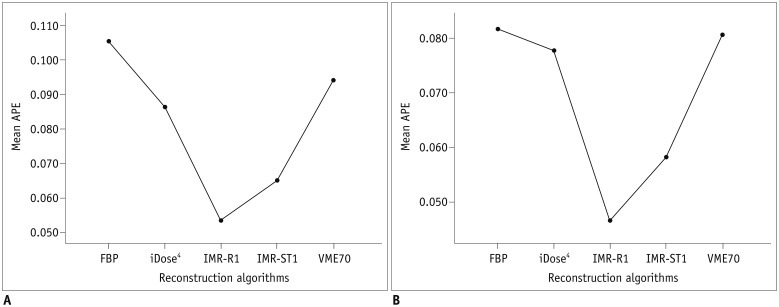
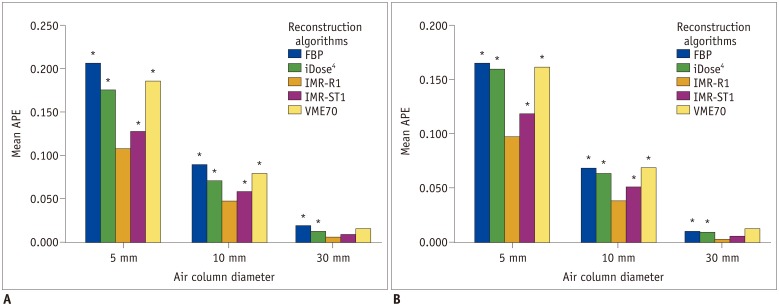
 | Fig. 3APEvol of each column (each 5-, 10-, and 30-mm) on (A) low-dose CT and (B) standard-dose CT.Mean APEvol in all air columns was lowest in IMR-R1 in both low-dose and standard-dose settings. Mean APEvol decreased as volume of air columns increased.
|
Table 2
APEvol according to Different Air Columns, CT Tube Current, and Reconstruction Algorithms
APEvol are expressed as mean ± standard deviation. *Showing significant difference between APE between low dose and standard dose (p < 0.05), †Showing significant difference between reconstruction algorithms. APE = absolute percentage measurement error, APEvol = APE of EV, CT = computed tomography, FBP = filtered back projection, IMR-R1 = body routine level 1, IMR-ST1 = body soft tissue level 1, VME70 = standard virtual monoenergetic dataset at 70 keV
![]()
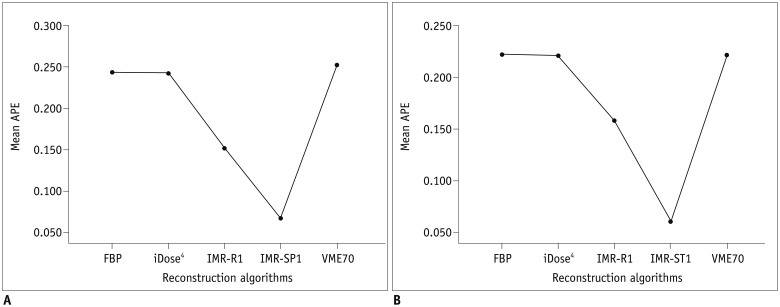
Accuracy of Airways Measurement
 | Fig. 5APEWA% of across all airway tubes (all of A1, A2, and A3 airway tubes) on (A) low-dose CT and (B) standard-dose CT.Mean APEWA% of across all airway tubes was lowest in IMR-SP1 in both low-dose and standard-dose settings. Mean APEWA% decreased as WA% increased. APEWA% = absolute percentage measurement error of wall area percentage, WA% = wall area percentage
|
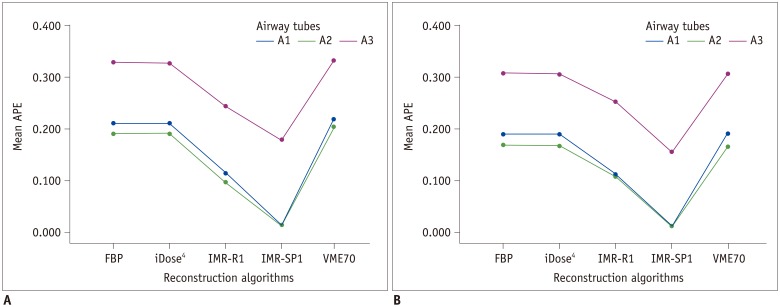 | Fig. 6Absolute percentage measurement error of each airway tube (each A1, A2, and A3 airway tube) on (A) low-dose CT and (B) standard-dose CT.Mean APEWA% decreased as WA% increased.
|
 | Fig. 7Mean APEWA% in each airway tube on (A) low-dose and (B) standard-dose CT.Significant differences in APEWA% from IMR-SP1 are marked with asterisk (*).
|
Table 3
APEWA% according to Different Air Columns, CT Tube Current, and Reconstruction Algorithms
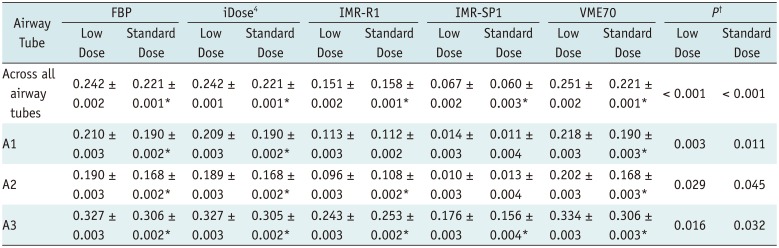
APEWA% are expressed as mean ± standard deviation. *Showing significant difference between APE between low dose and standard dose (p < 0.05), †Showing significant difference between reconstruction algorithms. APEWA% = absolute percentage measurement error of wall area percentage, IMR-SPI = sharp plus level 1
![]()
 XML Download