

 PDF
PDF ePub
ePub Citation
 Print
Print


INTRODUCTION
Pulmonary artery intimal sarcoma (PAIS) is a rare tumor with only a few hundred cases reported in the literature. It originates from the intimal layer of elastic pulmonary artery (PA), and can be completely undifferentiated or contain heterologous components such as osteosarcomas and chondrosarcomas (1). Its incidence is not clear, but PAIS was identified in 1–4% of pulmonary endarterectomy specimens from patients with chronic pulmonary thromboembolism (PTE) (23). PAIS is typically misdiagnosed as PTE, because the imaging findings and clinical aspects of the two are quite similar, which makes early diagnosis difficult and can lead to underestimation of the incidence of PAIS (4). There are often delays in confirming its diagnosis, which lead to poor prognosis; therefore, accurate early diagnosis is clinically important.
There have been only a few studies aimed at distinguishing between PAIS and PTE on the basis of CT imaging findings including dual energy CT (567). Positron emission tomography (PET)-CT and MRI findings are not well known until now. Moreover, the number of patients included in such studies was too small and the imaging findings were nonspecific.
Therefore, the aim of this study was to describe typical CT and clinical findings of PAIS compared with PTE, to investigate imaging findings of PAIS obtained by MRI and PET-CT, and to evaluate the effect of delayed diagnosis on survival outcomes of PAIS.
MATERIALS AND METHODS
This retrospective study was approved by the Institutional Review Board of our institution, and informed consent was waived (approval number: 2016-0695).
Patient Characteristics
By searching the database, we identified consecutive patients with PAIS who were hospitalized between November 1999 and June 2016. A total of 26 patients with PAIS that was confirmed histologically using biopsy or surgical specimens (10 males [38.5%] and 16 females [61.5%]) were enrolled. These patients were matched for gender at a ratio of 1:2, with 52 consecutive patients with PTE who were hospitalized between June 2015 and June 2016. Of the patients with PTE, nine underwent surgical removal, and PTE was pathologically confirmed. In the remaining 43 PTE patients, the index lesions decreased or disappeared on follow-up CT after anti-coagulation therapy, or the clinical symptoms improved along with a reduction in D-dimers (7). The inclusion criteria were as follows: 1) age > 19 years and 2) chest CT performed before initiation of treatment.
Clinical Assessment
Clinical assessment was carried out by searching electronic medical records. The following clinical data were noted: sex, symptoms, duration of symptoms, presence of deep vein thrombosis (DVT), laboratory test results including D-dimers, C-reactive protein (CRP), brain natriuretic peptide (BNP), history of anticoagulation treatment, presence of metastasis at the time of diagnosis, tumor recurrence and location, and survival. Tumor recurrence was defined as a newly developed metastatic lesion in an organ other than PA, or a newly developed tumor in PA after initiation of treatment (8). Overall survival was defined as the interval from the time of pathologic diagnosis to the date of death.
We also reviewed the radiology reports to identify cases of delayed diagnosis. Delayed diagnosis was defined as an interval from the date of the first CT imaging to the time of pathologic diagnosis exceeding 30 days. The date of the first formal report of CT was also recorded.
CT Acquisition Technique
Various CT units were used over a 10-year period, including LightSpeed 16, LightSpeed Plus and LightSpeed VCT scanners (GE Healthcare, Milwaukee, WI, USA), as well as Sensation 16, SOMATOM Definition, SOMATOM Definition flash or SOMATOM Definition AS plus scanners (Siemens Healthineers, Erlangen, Germany). Among the 78 CT scans that were performed, 16 (61.5%) of the PAIS patients and 49 (94.2%) of the PTE patients were imaged according to the pulmonary angiography CT (PACT) protocol, and the remainder were imaged according to the conventional chest CT protocol of our institution.
All images were obtained in a caudo-cranial direction from the lung base through the thoracic inlet level. For PACT, patients were administered a bolus of 100 mL of 400 mgI/mL non-ionic contrast material at a rate of 3.5 mL/sec via a 20-gauge cannula into an arm vein using a power injector. Immediately after administration of the contrast medium, a 40 mL saline bolus was injected at the same rate. A bolus tracking technique triggered at 100 HU on the pulmonary trunk was used with a delay of 10 seconds prior to scanning. For conventional chest CT, intravenous contrast medium (120–150 mL of 300–370 mgI/mL non-ionic contrast) was administered at a rate of 2–3 mL/sec using an automatic power injector. Scanning was started with a delay of 40 seconds after contrast medium administration.
MRI Acquisition Technique
Of the PAIS patients, nine (34.6%) underwent cardiac MRI. All cardiac MRI studies were performed using a 1.5T scanner with a cardiac phased-array receiver surface coil and electrocardiography-gating (Magnetom Avanto; Siemens Healthineers). T1-weighted image (T1WI) using a double inversion recovery fast spin-echo pulse sequence (repetition time [TR], 1 heartbeat; echo time [TE], 20–30 msec) and breath-hold T2-weighted image (T2WI) using a double inversion recovery fast spin-echo pulse sequence (TR, 2 heartbeats; TE, 70–100 msec) were obtained. Late gadolinium enhancement images using an inversion-recovery gradient-echo pulse sequence (inversion time of 250–350 msec) were acquired 10 minutes after intravenous injection of 0.2 mmol/kg gadolinium-based contrast agent. These sequences represented the routine protocol of all patients. Late gadolinium enhancement images using an inversion time of 600 msec were also acquired (TI 600). In TI 600, regions with contrast uptake appear as high signal intensity (SI), whereas thrombi appear as homogeneously dark SI, and there is improved thrombus delineation (91011). Since a TI 600 sequence is available at our institution, we have added TI 600 to assist in differential diagnosis in cases of suspected PTE or PAIS. In addition, diffusion-weighted image (DWI) is added when trying to distinguish whether lesions are tumors or not. TI 600 sequences were obtained in three patients, and DWIs in five patients.
PET-CT Technique
Twenty-four (92.3%) PAIS patients and six (11.5%) PTE patients underwent PET-CT. The median interval between PET-CT and the initial CT in PAIS patients was eight days (range, 1–1077 days). A PET-CT scanner (Discovery PET/CT 690; GE Healthcare) was used for fluorine-18 fluorodeoxyglucose (18F-FDG) PET-CT. The patients fasted for at least six hours and PET-CT scans were obtained 50 minutes after intravenous injection of FDG (5.2 MBq/kg body weight). Images were reconstructed using a three-dimensional ordered-subset expectation maximization algorithm, and lean body mass-based standardized uptake values were calculated. The maximum standardized uptake value (maxSUV) on the FDG PET-CT was identified, and a maxSUV value of 2.5 was used as the cut-off value for hypermetabolic tumors.
Image Analysis
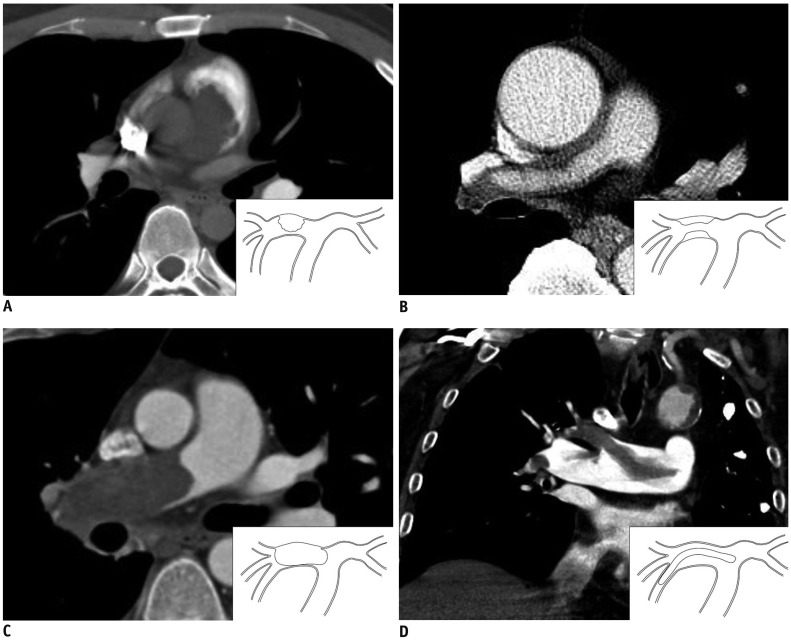
The initial CT scans of all patients were analyzed. Two chest radiologists (with 19 and 7 years of experience, respectively) analyzed the chest CT images together, and decisions were reached in consensus. The index lesion was defined as the largest and most representative lesion on CT. The following parameters were measured: maximal longitudinal/transverse diameter, tumor extension pattern (cauliflower-like polypoid lesion, diffuse/focal wall thickening, tumoral impaction, or tubular-polypoid shape) (Fig. 1), heterogeneity, attenuation, wall eclipse sign (WES), bulging contour, lobulating contour or surface nodularity, presence of intratumoral vessels, interphase angle, presence of right ventricle (RV) strain, multifocality, presence of lung ischemia, and tumor location. WES was defined as eclipsing of the PA wall before the lesion infiltrated beyond the artery (6). The presence of RV strain was radiologically defined when axial CT images showed a D-shaped RV with interventricular septal flattening (12). Central location included lesions in the PA trunk and both PAs. Peripheral location included lesions in the interlobar/lobar/segmental PAs.
All MRI images were reviewed in consensus by two radiologists with 14 years and 7 years of experience in cardiovascular imaging, respectively. The degree of SI was defined as SI relative to that of the pectoralis muscle (PM). The ratio of the SI of a tumor to the SI of the muscle was also evaluated in T1WI and T2WI. However, MRI was performed only in patients with PAIS and therefore was not used to compare the two diseases.
The maxSUV in FDG PET-CT was recorded by a single radiologist.
Pathological Analysis
Pulmonary artery intimal sarcoma specimens were obtained by surgical excision/surgical biopsy (n = 22) or percutaneous needle biopsy (n = 4). One experienced pathologist (with 12 years of clinical experience in lung pathology) examined the pathology slides to confirm the pathology diagnosis. PAIS was diagnosed based on morphology and immunohistochemical findings.
Statistical Analysis
To compare the clinical and CT findings of the two study populations, Student's t test was used for continuous variables and chi-square test was used for categorical variables. Receiver operating characteristic (ROC) analysis was performed, and areas under the ROC curve (AUC) were calculated to evaluate cut-off values with corresponding sensitivity and specificity of D-dimers for discriminating between PAIS and PTE (MedCalc version 7.1; MedCalc Software, Ostend, Belgium). Kaplan-Meier survival analysis with a log-rank test was performed to investigate and compare mean survival times in PAIS patients with and without delayed diagnosis. A p value < 0.05 was considered significant. All statistical analyses other than ROC analysis and AUC calculation were performed using statistical software (SPSS package, version 21.0; IBM Corp., Armonk, NY, USA) by a single investigator with 11 years of clinical experience in clinical statistics.
RESULTS
Clinical Characteristics
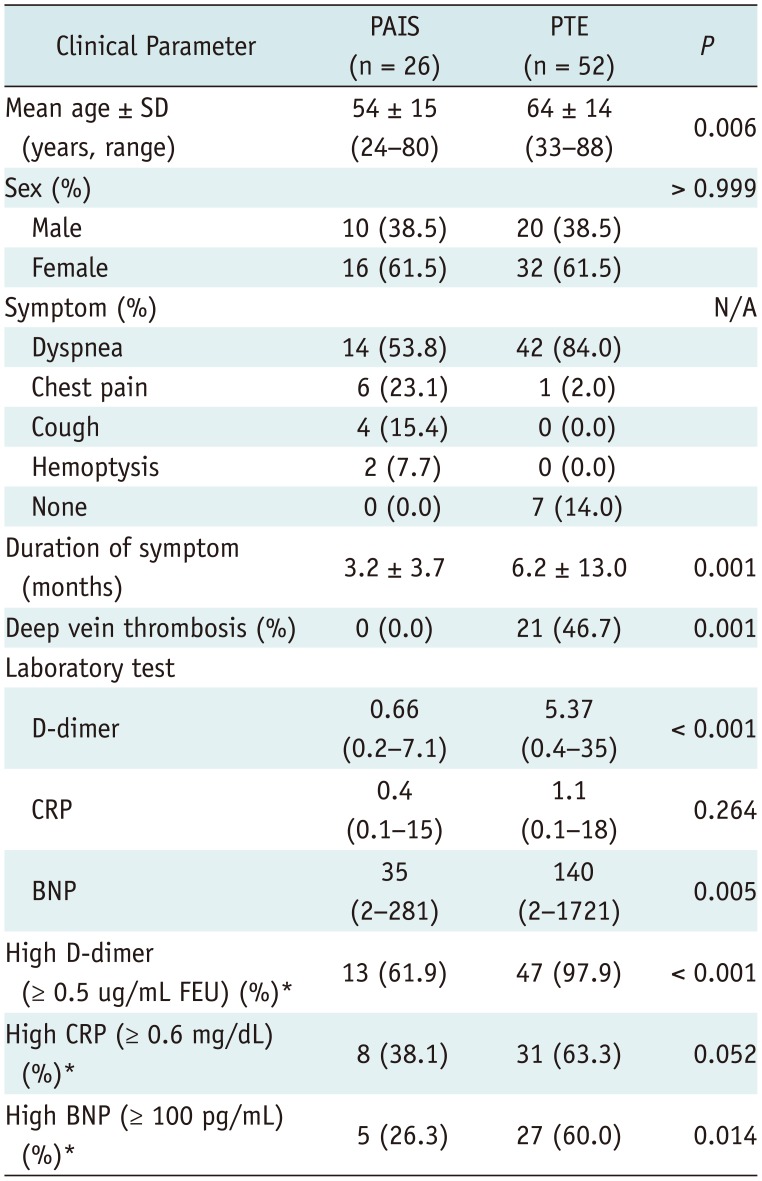
The clinical characteristics of the PAIS and PTE patients are shown in Table 1. The PAIS patients were significantly younger than the PTE patients (p = 0.006). Dyspnea was the most common symptom in both diseases. The duration of symptoms was significantly shorter in PAIS than PTE (p = 0.001). None of the PAIS patients had DVT, whereas 46.7% of the PTE patients had DVT (p = 0.001).
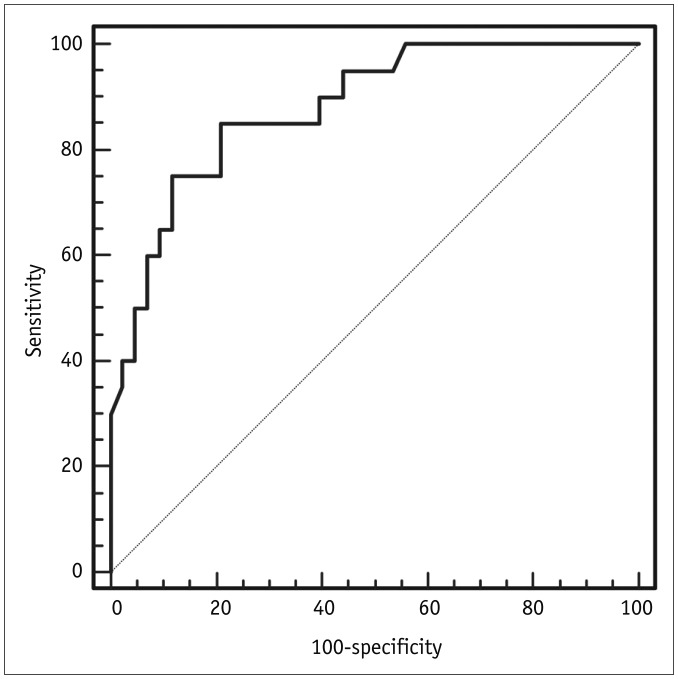
In the laboratory results, levels of serum D-dimers and BNP were significantly lower in PAIS than in PTE (p < 0.001 and p = 0.005, respectively), and the proportions of patients with high levels of D-dimers (≥ 0.5 ug/mL fibrinogen equivalent units [FEU]) and BNP (≥ 100 pg/mL) were significantly higher in PTE than PAIS (p < 0.001 and p = 0.014, respectively). From ROC analysis, the AUC of D-dimers was 0.88 (95% confidence interval [CI], 0.774–0.948) (Fig. 2), and using a threshold of 2.81 ug/mL FEU for D-dimers showed 85% sensitivity (95% CI, 62.1–96.8) and 79% specificity (95% CI, 64–90) for the identification of PAIS.
Of the PAIS patients, 16 (61.5%) received anticoagulation treatment with heparin or warfarin, and the extent of the lesions increased or was unchanged on follow-up CT in all patients. The initial CT showed that one PAIS patient (3.8%) had metastasis in lung and pleura.
Nineteen PAIS patients underwent surgery consisting of mass excision (n = 9), endarterectomy (n = 3), pneumonectomy (n = 5), lobectomy (n = 1), or lung transplantation (n = 1). Twelve patients received post-operative treatment with chemotherapy (n = 3), radiotherapy (n = 2), or chemoradiotherapy (n = 7). One patient received chemotherapy only, and four patients underwent chemoradiotherapy only.
Imaging Findings
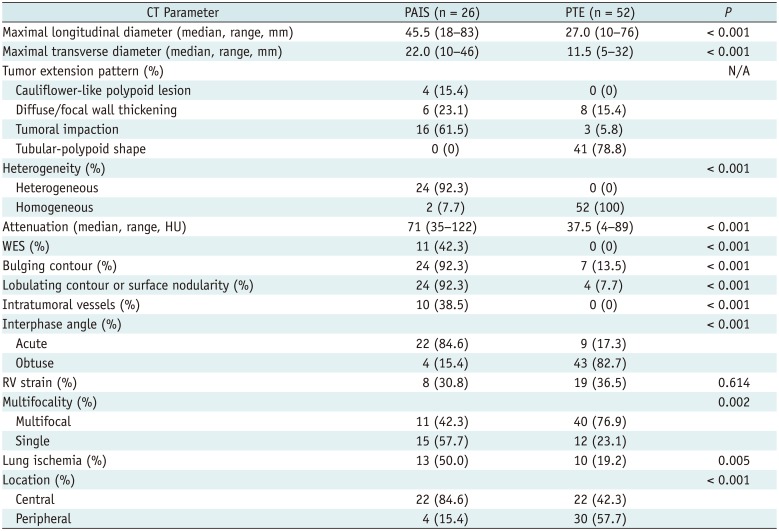
The CT findings in PAIS and PTE are compared in Table 2. The median size of tumors in PAIS was significantly greater than that in PTE (p < 0.001). The most common tumor pattern in PAIS was tumoral impaction (61.5%). None of the PAIS tumors had a tubular-polypoid shape compared with 78.8% of PTE, and none of the cases of PTE had cauliflower-like polypoid lesions. Heterogeneous attenuation, WES, bulging contours, lobulating contours or surface nodularity, intratumoral vessels, acute interphase angles, single location, lung ischemia, and central location were significantly more common in PAIS than in PTE (all p < 0.01). Attenuation was significantly higher in PAIS than PTE (p < 0.001).
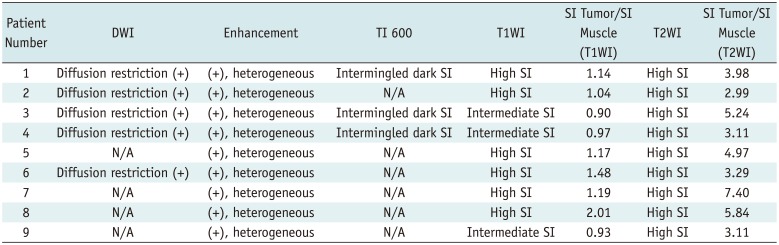
In MRI, all cases of PAIS showed diffusion restriction and heterogeneous enhancement. In the three patients who underwent a TI 600 sequence, intermingled dark SI foci suggestive of intermingled thrombi were seen (Fig. 3, Table 3).
All 24 PAIS patients showed hypermetabolic FDG uptake on PET-CT (Fig. 4), whereas none of the six patients with PTE showed metabolic uptake. The median maxSUV of PAIS was 7.15 (range, 3.1–17.6).
Survival Outcomes
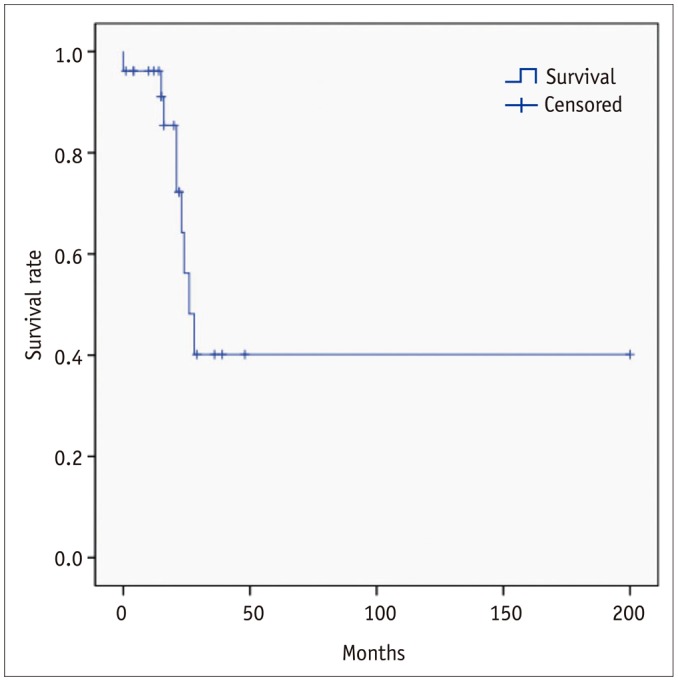
Nine PAIS patients died (34.6%) in the follow-up period. The median overall survival of patients with PAIS was 26 months (range, 0–200 months) (Fig. 5). One patient died six days after endarterectomy due to pulmonary hypertension, and this patient had not received a delayed diagnosis. Tumors recurred in 17 patients (65.4%) and three patients showed recurrence in more than one organ. The most common organ involved was PA (local recurrence) (n = 6), followed by lung (n = 6), brain (n = 3), bone (n = 1), chest wall (n = 1), lymph node (n = 1), thyroid (n = 1), and adrenal gland (n = 1). One patient survived for 200 months, despite the presence of metastases in thyroid gland and adrenal gland.
Delayed Diagnosis
Eleven (42.3%) PAIS patients received a delayed diagnosis. The mean delay was 268.6 ± 331.8 days (range, 34–1079 days). The most common incorrect diagnosis was PTE (6/11, 54.5%), followed by Takayasu arteritis (2/11, 18.2%), tumor thrombus (2/11, 18.2%), and lung cancer (1/11, 9.1%).
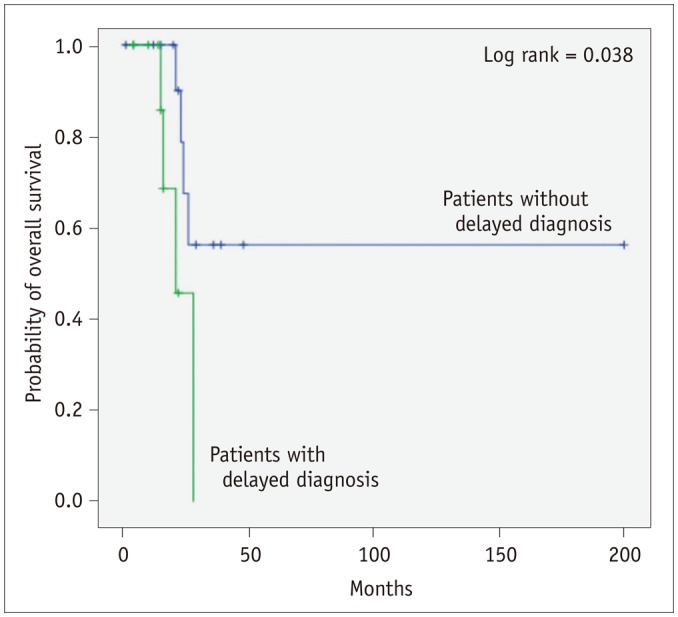
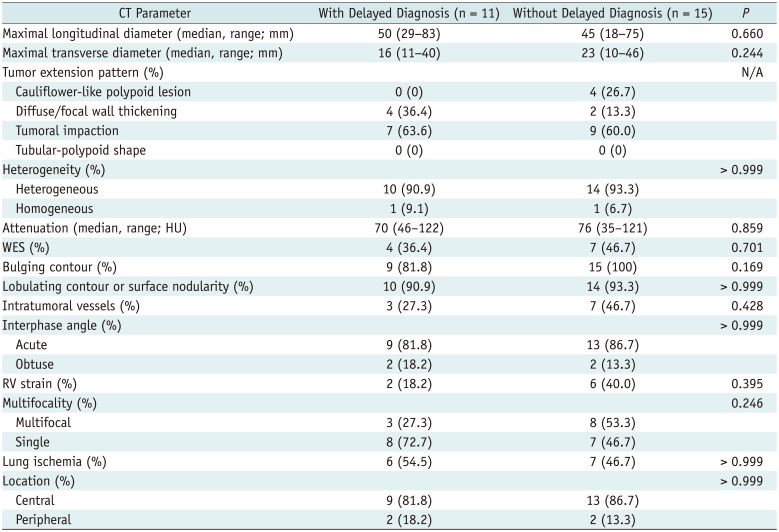
There was no significant difference in overall survival between patients with or without a delayed diagnosis (mean survival, 22.5 ± 2.6 vs. 115.0 ± 28.3 months, p = 0.121). However, when an initial patient who died in the peri-operative period (6 days after surgery) were excluded, the overall survival of patients who were diagnosed late was significantly shorter than that of patients diagnosed early (mean survival, 22.5 ± 2.6 vs. 122.0 ± 29.1 months, p = 0.038) (Fig. 6). There was no significant difference in tumor size or presence of metastasis at the initial CT between patients with and without delayed diagnosis (p > 0.05), and there were no significant differences in CT imaging findings between the two groups (Table 4).
DISCUSSION
The term pulmonary artery sarcoma (PAS) has been used interchangeably with PAIS, but PAS also encompasses the exceedingly rare “mural” sarcoma, (i.e., leiomyosarcoma), which is distinct from PAIS in originating from the intimal layer of elastic PAs (1). Meanwhile, angiosarcomas are the most common primary cardiac malignancies with specific differentiation (1), which can also involve pericardium, pleura, and mediastinum; metastasize to lung parenchyma; and expand to PA. Recently, various kinds of PAS have been reclassified based on immunohistochemistry staining. Those tumors might have different behaviors including outcomes, pathological features, and probably imaging characteristics. Therefore, in our study, we distinguished PAIS from PAS and analyzed clinical and imaging characteristics of only PAIS.
On radiologic imaging, it is crucial to suspect PAIS rather than PTE, but this is not easy in routine practice. CT is the most basic and most popular modality for assessing PAIS and PTE. Previously, a few studies have reported CT imaging findings in PAIS such as WES, lesions occupying the entire lumen at the level of the proximal PAs, expansion of PAs, and extraluminal extensions (56). However, these imaging findings are quite nonspecific, and the study populations were small.
In this study of a relatively larger population, we identified CT imaging findings that were significantly more frequent in PAIS than in PTE. Furthermore, we classified the tumor extension pattern into four morphologic types. Among the four types, PAIS showed tumoral impaction (61.5%), diffuse/focal wall thickening (23.1%), or cauliflower-like polypoid lesions (15.4%). Considering the previous report that PAIS had an intraluminal polypoid growth pattern macroscopically (1), we believe that these CT features reflect the stages of tumor growth or sequential process of tumor characteristics. At first, polypoid tumor foci of PAIS form in the intimal layer of the PA; these subsequently extend along the vessel, forming a cauliflower-like mass or diffuse/focal wall thickening. Finally, the tumors compact and occupy almost the entire PA lumen. PAIS thus has a spectrum of appearances on initial CT in routine practice.
On the other hand, no PAIS had a tubular-polypoid shape, whereas about two-thirds of PTEs were of a tubular-polypoid shape. This tubular-polypoid shape might be due to DVT and is thought to be part of the process of moving thrombus from DVT; half of the PTE patients in our study had DVT compared with none of the PAIS.
In our study, PAIS was significantly more heterogeneous and had higher attenuation than PTE. Most previous studies also have shown heterogeneous enhancement of PAS and PAIS (1314151617), except for one study that found no significant difference in mean attenuation between PAIS and PTE (7). In the previous studies, necrosis and hemorrhage were common features of PAIS (11418); in our study, intratumoral vessels were significantly more common in PAIS. These findings could explain the heterogeneity or higher attenuation in CT and might be specific findings of PAIS.
Wall eclipse sign was also a significant CT finding in PAIS in our study. Gan et al. (6) reported that WES was pathognomonic for PAS, and this sign was seen in CT images in all 12 patients with PAS. WES was seen in less than half of our PAIS patients (42.3%), but was not seen in any of the PTE patients. Therefore, WES could be a reasonably specific sign for PAIS.
We also examined the imaging features of PAIS using MRI and PET-CT. In MRI, all PAIS in our study showed diffusion restriction and heterogeneous enhancement, and these findings were evident in PAS including PAIS, but not in PTE in a previous study (19). The TI 600-msec sequence of MRI showed intermingled dark SI, reflecting intermingled or overlying thrombosis, and this has also been described in a few case reports (202122). Therefore, MRI has strength for distinguishing combined thrombus along with PAIS. In PET-CT, all PAIS patients showed FDG hypermetabolism, as in previous reports (2324). PET-CT also has the advantage of demonstrating the presence of other foci of PAIS and identifying metastases distant from the PAIS. However, there have been two reports of low FDG uptake in PAIS (2526). This might be due to intermingled thrombus, the thin wall of PA aneurysms, or cystic changes in PAS (in leiomyosarcoma) (26). Despite these limitations, MRI and PET-CT can be used as second-line imaging modalities to distinguish PAIS from PTE and for better planning of endovascular catheter biopsy or surgery; however, a further prospective study is needed to assess the pros and cons of the two modalities.
Clinically, PAIS was significantly more common in younger patients, had shorter symptom duration, and had no DVT than PTE. It also had significantly lower levels of D-dimer and BNP. D-dimer was higher than normal in both PAIS and PTE patients. However, when the level of D-dimer is lower than 2.81 ug/mL FEU, the possibility of PAIS increases. Conversely, if the level of D-dimer is very high (above 2.81 ug/mL FEU), the probability of PAIS is considered to be very low. These findings could be used as confirmation when PAIS is suspected clinically.
In our study, 42.3% of PAIS patients received a delayed diagnosis; this is similar to previous studies, in which approximately half of PAS cases were originally misdiagnosed as PTE due to the similar CT findings in the two diseases (1427). If the CT findings of the delayed diagnosis group were more similar to PTE than those of the timely diagnosis group, this might be the cause of delayed diagnosis, however there were no significant differences in CT findings between patients with delayed diagnosis and those with timely diagnosis in our study. This result suggests that the specific CT features of PAIS revealed in this study were not recognized at the time of diagnosis, and this might have led to the delay in diagnosis. In our study, the overall survival of patients given a delayed diagnosis was significantly shorter than that of patients receiving a timely diagnosis, if the initial patients who died due to immediate post-operative complication (< 7 days) were excluded. Most reports suggest that radical resection is the only effective therapy (828), early detection and early diagnosis should help to improve survival outcomes in PAIS. Therefore, it is important to understand the specific imaging and clinical findings and to apply this knowledge quickly in differential diagnosis for PAIS to avoid delayed diagnosis and improve survival outcomes.
Our study has several limitations. First, it was retrospective in nature and was performed in a single tertiary center; it therefore had a selection bias. Second, the CT and MRI protocols were not uniform, and not all patients underwent MRI and PET-CT. However, we included a larger number of PAIS patients than did prior studies, focused on distinguishing PAIS from PAS, and compared CT and clinical findings that were easily obtained in routine practice with those of PTE patients. We also complemented the imaging findings using MRI with TI 600 and PET-CT and assessed survival outcomes. Third, we analyzed survival rates after excluding an initial patient who died of immediate post-operative complication, because we wanted to emphasize the mortality caused by the disease itself (i.e., the mortality caused by the recurrence).
In conclusion, the characteristic CT findings of PAIS should be understood in order to achieve early diagnosis of suspected PAIS, which leads to better survival outcomes. The most common tumor pattern in PAIS was tumoral impaction. Heterogeneous attenuation, WES, intratumoral vessels, acute interphase angles, single location, presence of lung ischemia, and central location were more common in PAIS than in PTE. MRI and PET-CT can be used as second-line imaging modalities to help distinguish PAIS from PTE and to plan appropriate clinical management.


 XML Download