

 PDF
PDF ePub
ePub Citation
 Print
Print


INTRODUCTION
The novel magnetic resonance imaging (MRI) quantitative sequence, the two-dimensional (2D) fast spin echo (FSE) multi-dynamic, multi-echo (MDME) sequence, enabled the rapid and the simultaneous sampling of physical properties which constitute an magnetic resonance (MR) image (12). The Synthetic MRI from the sequence enables the production of images with variable contrast-weighting after quantifying the longitudinal relaxation rate (R1), the transverse relaxation rate (R2), and the proton density (34). The quantitative values can be directly measured at the same times on the synthetic images with good accuracy and reproducibility (56). Several prior studies using the MDME sequence have investigated the image quality and diagnostic ability of the synthetic MRI (7891011). The applications of MDME sequence in neuroimaging will be further utilized.
The administration of gadolinium-based contrast agent (GBCA) is an important part of MRI in patients with central nervous system (CNS) disease for the diagnosis and monitoring of disease progression. If the integrity of the blood brain barrier (BBB) is changed by a variety of circumstances that increase its permeability, GBCA leaks into the brain tissue (12). GBCA changes the absolute magnetic properties of tissue water, strongly increasing R1, slightly increases the R2 and results in hyperintensity on the T1-weighted image (T1WI). This effect may vary with the imaging time after contrast administration. In daily clinical practice, conventional contrast-enhanced MRI is used as a qualitative method that is detected as visible differences based on the signal intensity. Several previous studies investigated post-contrast time-dependent change based on signal intensity on T1WI (13141516). However, absolute signal intensity cannot provide any direct meaning and it should be compared to adjacent normal tissue. On the other hand, tissue relaxometry is a representative quantitative MR technique that can reflect tissue characteristics and reduce the subjectivity of the conventional clinical MRI. Therefore, it has been reported to provide objective measures of tissue properties in variable CNS diseases (17181920212223). However, because of the prolonged scan time, there has been a limitation in investigating the R1 and R2 change, resulting from MR contrast agent.
Development of the new pulse sequence, MDME can provide diverse synthetic images and simultaneous quantification of R1, R2, and proton density maps in a scan time of approximately 6 minutes and post-processing time less than 1 minute (6). As the MDME sequence is promising method for the CNS disease, a post-contrast scan has been also applied to patients with multiple sclerosis or brain metastasis (1124). However, we could not find a study which applied MDME sequence with different times of image acquisition after contrast injection or evaluated the effects of GBCA on the physical properties of R1 and R2 using the MDME sequence. As brain metastasis is the most common intracranial tumor in adults, it is effective to investigate the post-contrast R1 and R2 changes in brain metastasis, as a representative CNS pathology that disrupts the BBB.
Therefore, the purpose of this study was to apply the MDME sequence for the direct measurement of MR relaxation times and tumor volumes in brain metastases on synthetic images at different time points after contrast administration and to provide a reference for appropriate imaging time for post-contrast a MDME sequence.
Go to : 
MATERIALS AND METHODS
Study Population
Our Institutional Review Board approved this study protocol, and informed consent was waived. Eight patients with intracerebral metastases, confirmed by imaging follow-up, underwent brain MRI with MDME sequences in June 2014 (15). One patient was excluded due to motion artifacts. Finally, seven patients (four men and three women; mean age, 58 years; age range, 38–66 years) with 15 brain metastases were enrolled in this study. Metastatic brain tumors, which included lung adenocarcinoma (n = 11), renal cell carcinoma (n = 3), and rectal adenocarcinoma (n = 1) were investigated. Mean size of the metastases was 1.85 ± 11.17 cm (range, 0.65–4.72 cm).
MR Examination
All examinations were done using a 3T clinical scanner (Discovery MR750w 3.0T; GE Medical Systems, Milwaukee, WI, USA) with a 32-channel head coil. Quantitative MRI sequences were taken before and after intravenous administration of gadobutrol (Gadovist; Bayer Healthcare, Berlin, Germany) at a dose of 0.1 mmol per kilogram of body weight. The 2D FSE MDME sequence was performed utilizing 4 automatically calculated saturation delays, 2 echo time (TE) of 21.4/85.4 ms and a repetition time (TR) of 4000 ms. All subjects were scanned at the following three different delay time points, after the administration of contrast agent: 1 minute, 10 minutes, and 20 minutes delayed imaging (Fig. 1).

A least square fit was performed on the signal intensity S of each pixel of images per section to calculate the T1, according to the following equation (2):
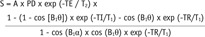
where A is the overall intensity scaling factor considering the coil sensitivity, the radiofrequency chain amplification and the voxel volume, and the applied excitation flip angle α and saturation pulse angle θ were 90 degrees and 120 degrees, respectively. The B1 field was included in the fitting algorithm to account for B1 inhomogeneity. Details of the sequence and the post-processing were described by Warntjes et al. (2).
Synthetic T1WI and T2-weighted image (T2WI) were created by the MDME sequence using a vendor-provided program (SyMRI7.2; Synthetic MR, Linköping, Sweden). Detailed parameters for the MR sequences are shown in Table 1.
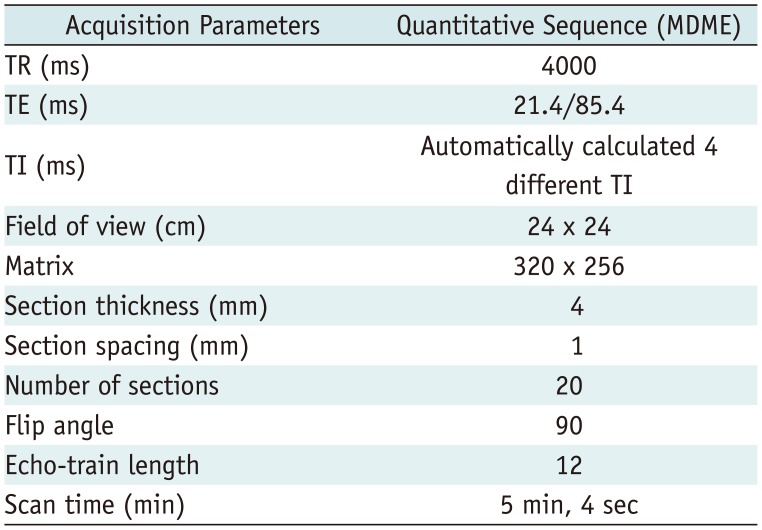
Table 1
MDME Sequence Parameters
![]()
Image Analysis
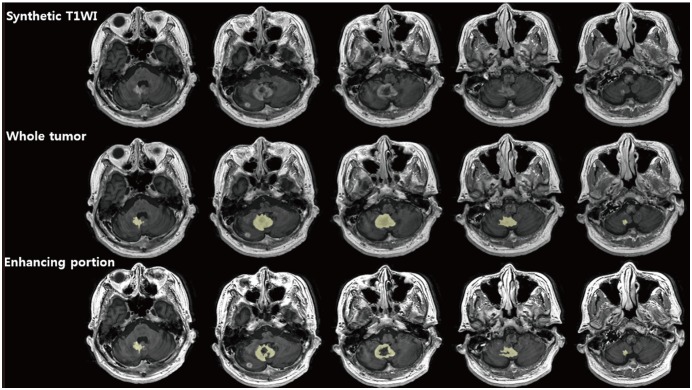
Quantitative analysis was performed by a radiologist with 8 years of experience in neuroradiology. A lesion was defined as a mass with an abnormal focal parenchymal enhancement with a signal intensity higher than normal brain parenchyma that does not appear as a thin blood vessel on T1WI. R1 and R2 values and the volume (mL) of a lesion were measured in a volume of interest (VOI) utilizing a semiautomatic segmentation method in pixel analysis software (Nordic ICE; NordicNeuroLab, Bergen, Norway). Synthetic T1WI of 1 minute, 10 minutes, and 20 minutes delayed imaging were used as structural images for each VOI. A major region of interest (ROI), involving the entire cross-section of a metastasis at its maximum diameter (whole tumor including both the enhancing portion and the nonenhancing necrotic core) was drawn in each section of the three post-contrast synthetic T1WI to derive a VOI. Next, a selective ROI limited to the enhancing portion of the tumor was drawn on each section of the post-contrast synthetic T1WI to derive a VOI representing the enhancing portion of the lesion (Fig. 2). These processes were repeated for different time points and six VOIs were created for each of the lesions. For R1 and R2 values of pre-contrast images, synthetic T1WIs of 20 minutes delayed imaging were used as structural reference to define a lesion. Then, a histogram analysis was performed to derive the mean, median, skewness, and kurtosis calculated from the pixel values of a VOI.
Statistical Analysis
The results were reported as median values with the ranges in parentheses. The Friedman test was utilized to evaluate the differences in mean, median, skewness, kurtosis and the lesion volume among the three different time delays (1415). Differences were considered significant at p < 0.05. For post hoc pairwise multiple comparison, the Wilcoxon signed-rank test was used (1 minute versus 10 minutes delayed images, 1 minute versus 20 minutes delayed images, and 10 minutes versus 20 minutes delayed images). In this case, the Bonferroni-corrected significance level of p < 0.017 was used. Statistical analyses were performed using commercially available software (PASW Statistics version 24.0; IBM Corp., Armonk, NY, USA, and MedCalc version 11.1.1.0; MedCalc software, Mariakerke, Belgium).
Go to :
RESULTS
R1 and R2 values in the tumor, on the 1 minute delayed images, were significantly elevated compared to the pre-contrast images (p < 0.001 for the mean, p < 0.001 for the median, skewness and kurtosis).
Longitudinal Relaxation Rate
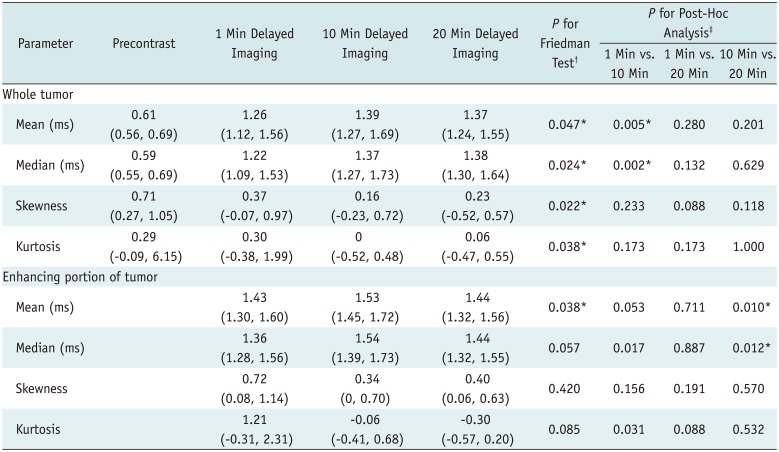
The Friedman test showed significant differences in R1 histogram parameters of the whole tumor depending on the three different imaging times (all p < 0.05) (Table 2). The post-hoc analyses for whole tumor displayed the mean and median of R1 were significantly increased on the 10 minutes delayed images compared to the 1 minute delayed images (p = 0.005 and p = 0.002, respectively) (Fig. 3).
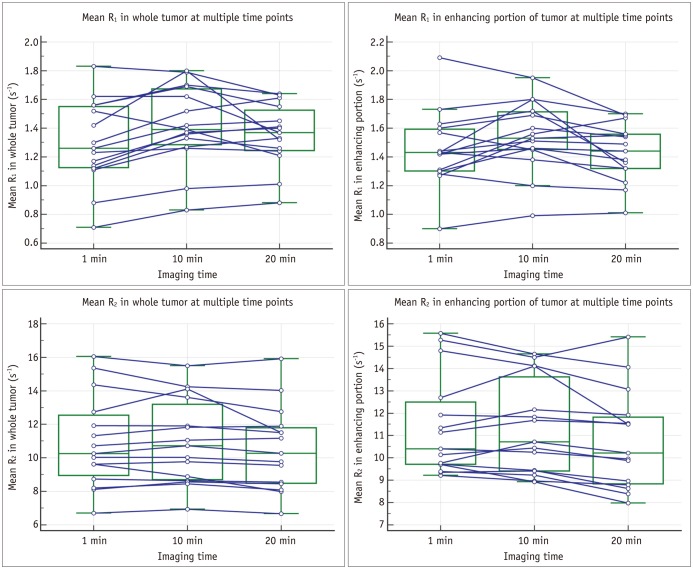 | Fig. 3Box and whisker plots display distribution of mean R1 and R2 in whole tumor and enhancing portion of tumor, respectively.Central box represents values from lower to upper quartile (25–75 percentile). Middle line represents median. Horizontal line extends from minimum to maximum value, excluding outside and far out values that are displayed as separate points.
|
Table 2
Effects of Time Delay after Contrast Injection on Histogram Parameters of Longitudinal Relaxation Rate Values in Brain Metastasis
![]()
For the enhancing portion of the tumor, significant differences were calculated for the mean of R1 according to the imaging times (Friedman test, p = 0.038). In the post-hoc analyses for the enhancing portion of the tumor, the mean and median R1 values were significantly larger on the 10 minutes delayed images than on the 20 minutes delayed images (p = 0.01 and p = 0.012, respectively).
The post-hoc analyses of the skewness and kurtosis of T1 did not show significant difference between the three different imaging times in both whole tumor and enhancing portion of the tumor (p > 0.017). The results are summarized in Table 2.
Transverse Relaxation Rate
In the whole tumor, the mean R2 was significantly different according to the three different imaging delay times (Friedman test, p = 0.038). The other parameters were not significantly altered depending on the imaging times (Friedman test, all p > 0.05) (Table 3). In the post-hoc analyses for the whole tumor, the mean of R2 showed a significant decrease on the 20 minutes delayed images as compared to the 10 minutes delayed images (p = 0.011) (Fig. 3).
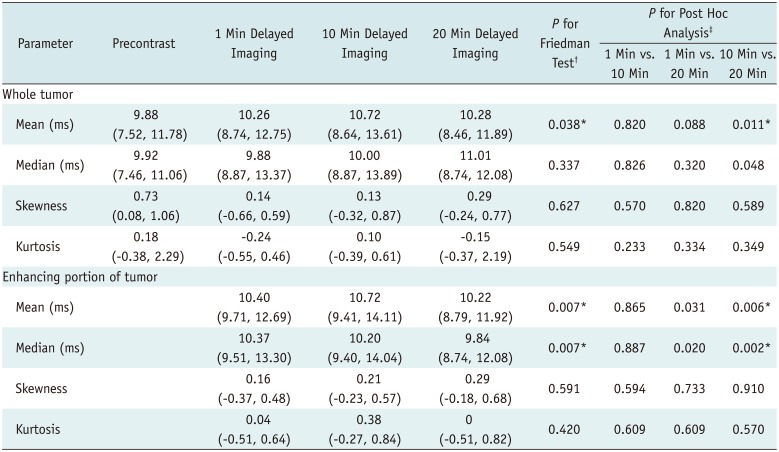
Table 3
Effects of Time Delay after Contrast Injection on Histogram Parameters of Transverse Relaxation Rate Values in Brain Metastasis
![]()
For the enhancing portion of the tumor, the mean and median of the pixel values were significantly different in R2 for the three time delays (Friedman test, p = 0.007 for both the mean and median). In the post-hoc analyses for the enhancing portion of the tumor, the mean and the median of R2 were much larger on the 10 minutes delayed images as compared to the 20 minutes delayed images (p = 0.006 for the mean and p = 0.002 for the median). The results are summarized in Table 3.
Volume
There was a significant difference in the volume of whole tumor for the three different imaging times (p = 0.022). The median values of the volume of whole tumor, according to the imaging time, were 0.43 mL (interquartile range [IQR], 0.18−2.67 mL) on the 1 minute delayed images, 0.59 mL (IQR, 0.21−3.09 mL) on the 10 minutes delayed images and 0.71 mL (IQR, 0.26−3.50 mL) on the 20 minutes delayed images. In the post hoc analysis with Wilcoxon signed-rank tests conducted with a Bonferroni correction, there were significant increases in the volume of whole tumor on the 10 minutes and 20 minutes delayed images as compared to the 1 minute delayed images (p = 0.001 and p = 0.002, respectively). There was no significant difference between the 10 minutes and 20 minutes delayed images (p = 0.028).
The volume of the enhancing portion of tumor also showed a statistically significant difference for the three different imaging times (p < 0.001). The median values for the volume of the enhancing portion of the tumor, according to the imaging time were 0.29 mL (IQR, 0.12−1.73 mL) on the 1 minute delayed images, 0.54 mL (IQR, 0.13−2.61 mL) on the 10 minutes delayed images and 0.69 mL (IQR, 0.21−3.37 mL) on the 20 minutes delayed images. In the post hoc analysis, the volume of the enhancing portion of the tumor revealed a significant increase with the delayed imaging time (both p = 0.001 between the 1 minute and 10 minutes delayed images and between the 1 minute and 20 minutes delayed images and p = 0.01 between the 10 minutes and 20 minutes delayed images).
Go to :
DISCUSSION
Quantitative relaxometry can be utilized to obtain fundamental and absolute information on tissue properties (22). As recently introduced synthetic MRI enabled direct measurement of R1 and R2 values within a reasonable time, we applied the sequences to investigate the time-dependent changes of R1 and R2 on the post-contrast MRI and measured them in brain metastases at three delay time points. We observed the mean of R1 and R2 in the whole tumor were higher on the 10 minutes delayed images than on the 1 minute delayed images. For the enhancing portion of the tumor, the mean and the median of R1 and the mean of R2 were higher on the 10 minutes delayed images than on the 20 minutes delayed images. Therefore, R1 and R2 values measured on the synthetic MRI were significantly changed at 10 minutes after contrast injection. In addition, we observed that volumes of the whole tumor and the inner enhancing portion were significantly larger at the 10 minutes delayed images as compared to the 1 minute delayed images.
There have been a few studies that reported the time dependent changes of MR relaxation times. We found a previous study which investigated time-dependent changes in the local T1 relaxation time (T1) in variable brain tumors after the intravenous injection of GBCA, using a magnetic focusing technique (25). T1 values of the tumors were measured serially for 60 minutes, and most values of T1 reached the minimal values at 5 minutes or, at latest, 10 minutes after the injection of GBCA (25). Similar to these results, our study the using synthetic MRI also revealed that measured MR relaxation times on the delayed scan were significantly different from those on the immediate post-contrast scan. In addition, we included the skewness and kurtosis in the analyses because they are biomarkers for tumor heterogeneity (26272829). Although Friedman test revealed that the skewness and kurtosis of R1 for the whole tumor were significantly different according to the different imaging delay times, their differences were attenuated in the post-hoc analyses. Based on our findings and previous knowledge, post-contrast quantitative MRI needs to be acquired at least 5 minutes after contrast injection to reflect enough changes in MR relaxation times.
The measurability of a disease is important for the assessment of response in patients with malignant tumors who are given anticancer treatments. In our study, two kinds of volumes for the whole tumor (including enhancing portion and nonenhancing necrotic core) and the inner enhancing portion were significantly larger on the 10 minutes and 20 minutes delayed images as compared to the 1 minute delayed images. Whereas no significant difference was observed between the 10 minutes and 20 minutes delayed images in the whole tumor, the volume of the enhancing portion of the tumor was larger on the 20 minutes delayed images than the 10 minutes delayed images. Our results are similar to a few previous reports, which showed the lesion contrast from signal intensities improved with delayed imaging time (1314). As the post-contrast synthetic T1WIs were used as structural images for each VOI, we could indirectly validate the time-dependent changes in tumor volume measured by the MDME sequence as compared to the conventional MR imaging.
Post-contrast synthetic MRI could demonstrate the R1 and the R2 changes caused by GBCA leakage in the brain metastasis. By using synthetic MRI, the changed MR relaxation times were easily and directly measured and compared between pre- and post-contrast scans. In addition, the changes were much larger on the delayed scan rather than 1 minute delayed scan. Even though these results are predictable, there has been no prior study, which put a theory on the synthetic MRI. Therefore, this preliminary study is meaningful as a reference for future studies using post-contrast synthetic MRI.
The current study has several limitations. First, the number of patients was small. Because of the limitation of the acquisition time, it was difficult to obtain MDME sequences four times in many of these patients. Second, in the case of multiple lesions in the same patient, each lesion was regarded as an independent lesion. In addition, the constitution of sample was heterogeneous, and the pathology of metastases might have affected the time-dependent changes in tissue relaxation. However, our purpose was not to differentiate the pathology of metastases, but to analyze the time-dependent effects of the contrast medium on MDME sequence in an enhancing mass. We could obtain reliable results by studying various histogram parameters and statistical verification. Third, our study did not investigate time-dependent changes of R1 and R2 with a shorter interval of imaging time delays. This was also caused by the limitation of acquisition time. In addition, it took 5 minutes and 4 seconds to acquire a MDME sequence, the time interval used in our study seems to be applicable for investigating the time-dependent changes of tissue relaxation times in brain metastasis.
In conclusion, the MDME sequence immediately after contrast injection cannot fully reflect the effects of GBCA leakage in a tissue. Both the changes in the MR relaxation times and the volume of a tumor were larger on the 10 minutes or 20 minutes delayed images rather than on the 1 minute delayed images. As the post-contrast synthetic MRI can provide objective change of tissue properties related to contrast leakage in various CNS diseases, its application in neuroimaging will be further expanded. Our results may provide a reference for appropriate imaging time for post-contrast MDME sequence.
Go to :
 XML Download