Journal List > Korean J Radiol > v.19(4) > 1096615

Kim, Kim, Song, Kang, Yim, Lee, and Nam: Early Prediction of Response to Neoadjuvant Chemotherapy Using Dynamic Contrast-Enhanced MRI and Ultrasound in Breast Cancer

Abstract

Objective

To determine the diagnostic performance of dynamic contrast-enhanced magnetic resonance imaging (DCE-MRI) and DCE ultrasound (DCE-US) for predicting response to neoadjuvant chemotherapy (NAC) in breast cancer patients.

Materials and Methods

This Institutional Review Board-approved prospective study was performed between 2014 and 2016. Thirty-nine women with breast cancer underwent DCE-US and DCE-MRI before the NAC, follow-up DCE-US after the first cycle of NAC, and follow-up DCE-MRI after the second cycle of NAC. DCE-MRI parameters (transfer constant [Ktrans], reverse constant [kep], and leakage space [Ve]) were assessed with histograms. From DCE-US, peak-enhancement, the area under the curve, wash-in rate, wash-out rate, time to peak, and rise time (RT) were obtained. After surgery, all the imaging parameters and their changes were compared with histopathologic response using the Miller-Payne Grading (MPG) system. Data from minor and good responders were compared using Wilcoxon rank sum test, chi-square test, or Fisher's exact test. Receiver operating characteristic curve analysis was used for assessing diagnostic performance to predict good response.

Results

Twelve patients (30.8%) showed a good response (MPG 4 or 5) and 27 (69.2%) showed a minor response (MPG 1–3). The mean, 25th, 50th, and 75th percentiles of Ktrans and Kep of post-NAC DCE-MRI differed between the two groups. These parameters showed fair to good diagnostic performance for the prediction of response to NAC (AUC 0.76–0.81, p ≤ 0.007). Among DCE-US parameters, the percentage change in RT showed fair prediction (AUC 0.71, p = 0.023).

Conclusion

Quantitative analysis of DCE-MRI and DCE-US was helpful for early prediction of response to NAC.

INTRODUCTION

Neoadjuvant chemotherapy (NAC) is widely used in the treatment of breast cancer. An early assessment of response to NAC may allow prediction of the patient's final outcome and guidance regarding further treatment (1). To assess treatment response, imaging of tumor size change is routinely used (2). However, gross change manifests later than microstructural or physiologic alterations (3). On the other hand, functional imaging techniques could depict biologic features of the tumor. Neoangiogenesis is known to play an important role in tumor progression. Altered angiogenesis can be visualized using dynamic contrast-enhanced (DCE) imaging (4).
Magnetic resonance imaging (MRI) is widely used for response evaluation in breast cancer patients. DCE-MRI has been validated through the correlation with histopathologic data including microvessel density or angiogenic growth factors (567). Changes in the DCE-MRI kinetic parameters could be used to predict treatment response. Although the pathophysiologic mechanism explaining the changes in DCE-MRI has not been fully elucidated, it seemed to be related to changes in the microvessel density and antiangiogenic effects of chemotherapy (8). Compartmental pharmacokinetic models of DCE-MRI describe the blood-tissue exchange of an administered contrast agent (9). The models suggest that contrast agent diffuses from (transfer constant [Ktrans]; unit, min−1) and back to the vascular space (reverse constant [Kep]; unit, min−1). Ve, another DCE-MRI-derived parameter, refers to the leakage space (fractional extravascular extracellular space; unit, %). The correlation between NAC response and DCE-MRI parameters has been demonstrated in several studies (10111213).
Meanwhile, there is an increasing interest in the clinical use of contrast-enhanced ultrasound (CEUS). There have been several reports demonstrating the utility of CEUS for differentiation of breast lesions and prediction of prognostic factors of breast cancers (141516). Unlike the contrast agents used in MRI or computed tomography, ultrasound contrast agent (UCA) remains within the vessels. Considering that angiogenesis occurs at the capillary level, CEUS may be one of the most direct imaging tools for visualizing perfusion changes in the tumor. Recently, quantitative analysis of DCE ultrasound (DCE-US) has been investigated (171819). After a bolus injection of the UCA, the average intensity within a region of interest (ROI) can be displayed as a time-intensity curve (TIC) using a dedicated software. The velocity and quantity of UCA particles in the vessels are reflected in the TIC and variable perfusion-related indices are extracted.
In this study, we performed quantitative analysis of DCE-MRI and DCE-US to determine the diagnostic performance for early prediction of response to NAC in breast cancer patients.

MATERIALS AND METHODS

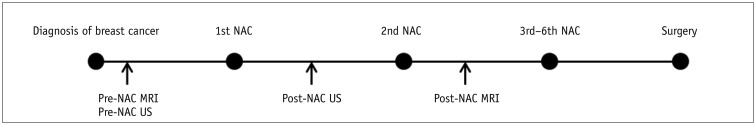
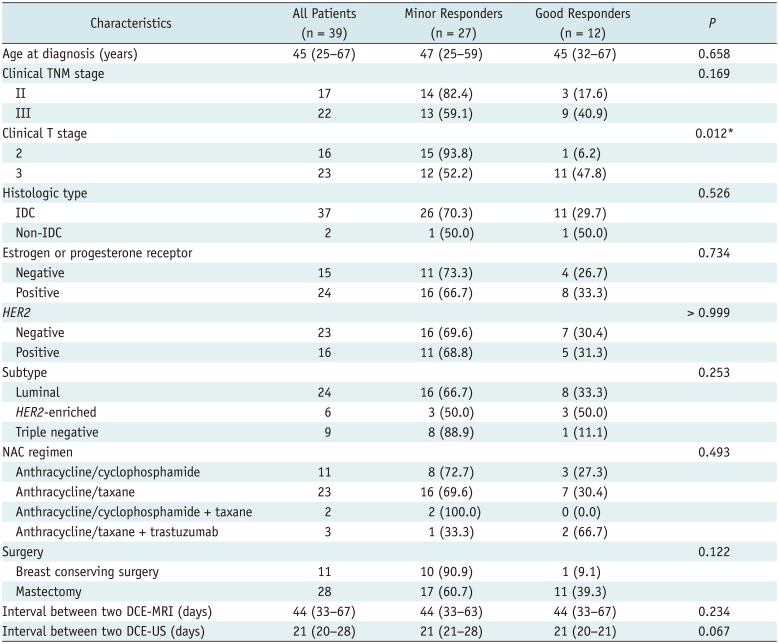
Our Institutional Review Board approved this prospective study, and all the patients provided written informed consent before enrollment. Between January 2014 and July 2016, consecutive 39 women (median age, 45 years; range, 25–67 years) with stage II or III unilateral breast cancer scheduled for NAC participated in this study. The patients received 4–6 cycles of anthracycline-based or anthracycline/taxane-based NAC with/without trastuzumab, followed by surgery (Fig. 1). The clinical characteristics of the patients are summarized in Table 1.
A breast radiologist, with 10 years of experience in breast imaging, performed DCE-US before the NAC and after the first cycle of NAC. The DCE-US carried out were defined as pre-NAC DCE-US and post-NAC DCE-US, respectively. DCE-MRI was performed before the NAC and after the second cycle of NAC and defined as pre-NAC DCE-MRI and post-NAC DCE-MRI, respectively. The DCE-US and DCE-MRI were performed just a few days before the next NAC. Subsequent DCE-MRIs were not analyzed because this study was focused on early prediction of response to NAC.
In the case of multiple malignancies in a breast, only the largest lesion was selected for analysis. The imaging data were evaluated by two radiologists (with 10 and 4 years of experience in breast imaging) in consensus. They were blinded to clinicopathologic information except that the study population was diagnosed with breast cancer.

DCE-MRI Data Acquisition and Analysis

MRI was performed with a 3T MAGNETOM Verio MRI system (Siemens, Erlangen, Germany) using a dedicated surface breast coil. MRI data were acquired using the following sequences: 1) axial turbo spin-echo T2-weighted imaging; 2) precontrast axial T1-weighted flash three-dimensional, volumetric interpolated breath-hold sequence with repetition time (TR)/echo time (TE) 2.7/0.8 msec, various flip angles (2°, 6°, 9°, 12°, and 15°), field-of-view 320 × 320 mm2, matrix size 256 × 192, slice thickness 2 mm, acquisition time 2 minutes 15 seconds; and 3) contrast-enhanced axial T1-weighted imaging with TR/TE 2.5/0.8 msec, flip angle 10°, slice thickness 2 mm, acquisition time 5 minutes 30 seconds (temporal resolution 6 seconds) after an intravenous bolus injection of 0.1 mmol/kg body weight of gadobutrol (Gadovist; Bayer AG, Berlin, Germany).
Dynamic contrast-enhanced magnetic resonance imaging was quantitatively analyzed using the Olea Medical Software (Olea Medical, La Ciotat, France), based on the extended Tofts and Kermode (TK) model (20). A native T1 map was generated using the five flip angles. The arterial input function (AIF) was obtained from the aorta or axillary artery using an automatic AIF selection algorithm. In the case of circumscribed malignant mass, the margin was manually demarcated. In the case of non-mass lesion or mixed pattern, the boundary of enhancing lesions contiguous to the center was traced. During the lesion demarcation on post-NAC DCE-MRI, pre-NAC DCE-MRI was used for reference. A histogram analysis of the whole tumor volume was adopted to avoid sampling bias (2122). After determination of the lesion by manual tracing of the margin on each axial contrast-enhanced T1-weighted image, a whole-tumor volume was automatically generated by summing each of the cross-sectional volumes. The volume of interest was copied and pasted onto other corresponding DCE parameter images. From the Ktrans, Kep, and Ve values per pixel of the whole-tumor volume, mean, 25th, 50th, and 75th percentile pixel values were obtained, and the skewness and kurtosis were calculated (7).

DCE-US Data Acquisition and Analysis

The US was performed with an iU22 scanner (Philips Healthcare, Eindhoven, The Netherlands) using a 7.5-MHz linear probe. Before DCE-US, B-mode US was performed to identify the target tumor. Subsequently, 2.4 mL of intravenous UCA (SonoVue; Bracco, Milan, Italy) was manually injected through the chemoport catheter. DCE-US data were obtained in a representative axial section. The raw data of the examinations were recorded during 3 minutes after the injection of the contrast agent. The data were loaded for the VueBox software (Bracco Suisse SA, Geneva, Switzerland) for quantitative analysis (23). The ROI was drawn to encompass the largest available tumor. TICs were generated and the following DCE-US parameters were automatically obtained: peak-enhancement (PE; units, a.u.), area under the TIC (AUCt; units, a.u.), wash-in rate (WiR; units, a.u.), wash-out rate (WoR; units, a.u.), time to peak (TTP; units, s), and rise time (RT; units, s) (24).

Histopathologic Examination

The histopathological assessment of surgical specimens was performed by a pathologist with 15 years of experience. The pathological response was assessed by the Miller-Payne Grading (MPG) system, which compares cancer cellularity of the core needle biopsy with the resected tumor (2526). Grading of the response was as follows: Grade 1, no reduction in overall cellularity; Grade 2, a minor loss of tumor cells (up to 30% loss); Grade 3, an estimated reduction between 30% and 90% in tumor cells; Grade 4, marked disappearance of tumor cells (more than 90% loss); and Grade 5, no identifiable malignant cells, although ductal carcinoma in situ may be present. Grades 1–3 were defined as a minor response and Grades 4 and 5 as a good response in this study.
Routine histopathological reports included the histologic type, size, and immunohistochemistry results. Tumors were classified into subtypes as follows: Luminal type, estrogen receptor (ER) or progesterone receptor (PR) positive; human epidermal growth factor receptor 2 (HER2)-enriched type, ER and PR negative and HER2 positive; and triple-negative type, ER and PR and HER2 negative.

Statistical Analysis

Statistical analyses were performed using SAS software (version 9.3; SAS Institute, Cary, NC, USA). P values for differences between minor responder and good responder were determined by Wilcoxon rank sum test, chi-square test, or Fisher's exact test. In regards to the diagnostic performance of imaging parameters to predict good response after NAC, receiver operating characteristic (ROC) curve analysis was used, and the area under the ROC curve (AUC), sensitivity, and specificity were calculated. The range of 0.9–1.0 indicates an excellent predictor; 0.8–0.9, a good predictor; 0.7–0.8, a fair predictor; and < 0.7, a poor predictor. The optimal threshold (cutoff) was chosen according to the Youden index. The percentage of the difference (%change) was calculated as follows: ([post-NAC values−pre-NAC values] / pre-NAC values) × 100. P values less than 0.05 were considered to indicate a statistically significant difference.

RESULTS

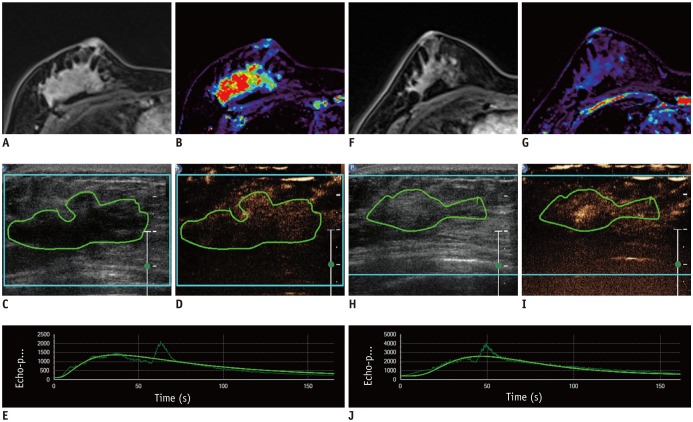
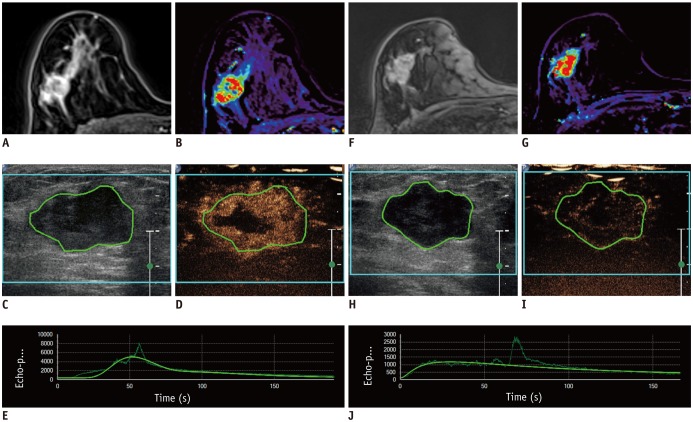
On pathological analysis of the surgical specimens, MPG results were as follows: Grade 1, n = 2 (5.1%); Grade 2, n = 5 (12.8%); Grade 3, n = 20 (51.3%), Grade 4, n = 8 (20.5%), and Grade 5, n = 4 (10.3%). In this study, 12 (30.8%) patients were classified as good responders (Grade 4 or 5) (Fig. 2) and 27 (69.2%) patients as minor responders (Grade 1, 2, or 3) (Fig. 3). Among the 12 good responders, there were 2 patients with no residual malignancy, 2 patients with ductal carcinoma in situ, 7 patients with invasive ductal carcinoma (median size, 0.7 cm; range, 0.2–1.5 cm), and 1 patient with mucinous carcinoma (size, 5 cm). Out of the 27 minor responders, there were 25 patients with invasive ductal carcinoma (median size, 1.8 cm; range, 0.2–4.8 cm) and 2 patients with invasive lobular carcinoma (size, 5 cm and 9.8 cm).

DCE-MRI

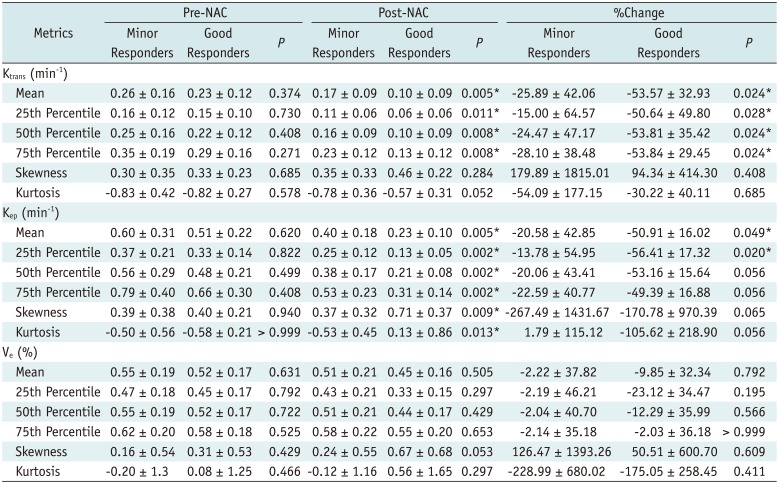
None of the pre-NAC DCE-MRI histogram metrics showed a difference between minor responders and good responders (Table 2). Whereas the mean, 25th, 50th, and 75th percentiles of Ktrans and Kep of post-NAC DCE-MRI in good responders were significantly lower than those in minor responders (p ≤ 0.011). The %changes of these values were bigger or tended to be bigger in good responders (p ≤ 0.056). Skewness and kurtosis of Kep were higher in good responders after NAC (p ≤ 0.013). There was no difference in histogram metrics of Ve between the two groups.
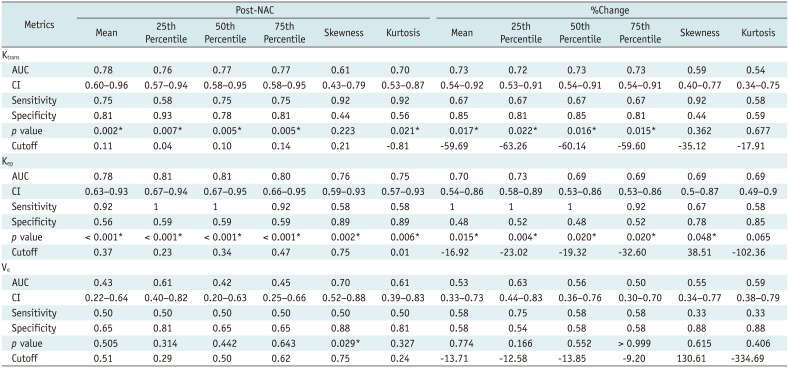
Table 3 shows the diagnostic performance of post-NAC DCE-MRI histogram metrics to predict good response after NAC. The mean, 25th, 50th, and 75th percentiles of Ktrans and Kep of post-NAC DCE-MRI showed fair to good prediction (AUC 0.76–0.81, p ≤ 0.007). Their %changes showed poor to fair prediction (AUC 0.69–0.73, p ≤ 0.022). Skewness and kurtosis of Kep of post-NAC showed fair predictors (AUC 0.76 and 0.75, respectively, p ≤ 0.006).

DCE-US

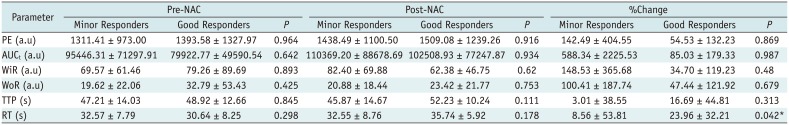
Table 4 demonstrates quantitative DCE-US parameters obtained before and after NAC for the discrimination between minor and good responders. There was no significant difference in PE, AUCt, WiR, WoR, TTP, and RT between minor responders and good responders before and after NAC. The %change in RT was significantly higher in good responders than in minor responders (p = 0.042). No statistically significant difference was found for the %change of PE, AUCt, WiR, WoR, and TTP. The statistical analysis of diagnostic performance revealed that %change of RT showed fair prediction (AUC 0.71, p = 0.023).

DISCUSSION

Our results from quantitative analysis of DCE-MRI in response assessment of NAC in breast cancer were consistent with those of several previous studies (10111213). Padhani et al. (10) found that the Ktrans range was accurate for predicting the response after two cycles of NAC. Ah-See et al. (11) showed that Ktrans and Kep after two cycles of NAC were significantly correlated with pathologic response. Li et al. (12) reported that Kep after the first cycle of NAC appeared to predict treatment response. Tudorica et al. (13) presented that Ktrans, Kep, and Ve obtained after one cycle of NAC were good to be excellent early predictors of pathologic response. On the other hand, Cho et al. (27) reported that DCE-MRI parameters (Ktrans, Kep, and Ve) did not lead to early identification of the pathologic response to NAC after the first cycle of chemotherapy.
In a systematic review regarding early response monitoring of NAC in breast cancer patients, Prevos et al. (28) concluded that the value of MRI in this issue was not yet established. Marinovich et al. (1) also pointed out that heterogeneous study methodology precluded definitive conclusions. There were large variations in clinico-pathological (tumor subtype, NAC regimen, the definition of pathologic response) and imaging (examination time point, acquisition protocol, analysis methods including pharmacokinetic models) details between each study. Although TK or extended TK models are widely applied in breast tumor evaluation, there is no universal consensus for the choice of pharmacokinetic model (49).
Several studies have supported the potential usefulness of CEUS for response assessment of NAC in breast cancer patients (17181929). Among the studies adopting quantitative analysis, significantly increased TTP is frequently observed in responders. TTP is the time from zero intensity (just before the UCA arrives at the ROI) to the peak (30). Cao et al. (17) quantitatively assessed TIC-derived parameters of CEUS, before and after three cycles of NAC. After NAC, an increase in TTP, a decrease in peak intensity and a decrease in wash-in slope was observed. Saracco et al. (19) investigated CEUS performed before and after two cycles of NAC. They observed significantly longer TTP in responders compared to non-responders after NAC. They interpreted this to mean that decreased blood perfusion leads to slower in-flow of UCA in the tumor. RT is the time from TI (the instant at which the maximum slope tangent crosses the x-axis) to the peak. Considering RT is TTP minus TI, our results correspond to those of previous studies. RT is known to be the least dependent on changes in US scanner settings and contrast bolus volume (31).
There has not been a consensus regarding adequate quantitative parameters representing treatment response. The major drawback of US is its limited reproducibility. For the quantitative analysis of DCE-US, the establishment of US equipment-independent reproducibility and standardization of technical settings is crucial (24). So far, DCE-MRI has been widely investigated and used for response prediction. However, DCE-US is widely available and can be performed in patients who cannot undergo DCE-MRI. Moreover, DCE-US can directly visualize perfusion status in the tumor. It is also encouraging that we observed some meaningful changes after the first cycle of NAC. DCE-US seems to be a potential tool for observing early changes after treatment of tumors.
Our study had several limitations. First, DCE-MRI and DCE-US were performed at different times. As we wanted to identify early perfusion change, DCE-US was performed after the first cycle of NAC for research purposes. However, for more practical purposes, DCE-MRI was performed after two cycles of NAC for midterm assessment. The treatment effects of NAC in breast cancer become pronounced with regard to DCE-MRI parameters after two cycles of NAC (11). Second, although we used commercial software, quantitative analysis of DCE-MRI and DCE-US was not well integrated. Third, when the tumor was larger than the sonic window or the lesion was very indistinct, it was difficult to place the US probe at the exact same location in two serial examinations. Fourth, the study population was small. Clinical and histopathological characteristics were also heterogeneous. Fifth, the response criteria (minor responder vs. good responders) were not well founded. Although the categorization according to the pathologic complete response (pCR) was preferable (32), it was difficult to compare pCR and non-pCR groups in this study because there were only 4 cases of pCR. Sixth, neither intra- nor inter-observer variability was evaluated. An additional large-scale study with a standardized method is needed.
In this paper, we demonstrated the results of quantitative analysis of DCE-MRI and DCE-US for early prediction of the pathologic response to NAC in breast cancer patients. The mean, 25th, 50th, and 75th percentiles of Ktrans and Kep of post-NAC DCE-MRI showed good performance for predicting pathologic response to NAC. Regarding DCE-US, %change in RT was significantly different between the two groups. DCE-US should be further investigated as a potential tool in the early prediction of response to NAC in breast cancer.

Notes

This study was supported by the Research Fund of Bracco Diagnostics, Inc.

The statistical consultation was supported by a grant of the Korea Health Technology R&D Project through the Korea Health Industry Development Institute (KHIDI), funded by the Ministry of Health & Welfare, Republic of Korea (grant number: HI14C1062).

References

1. Marinovich ML, Sardanelli F, Ciatto S, Mamounas E, Brennan M, Macaskill P, et al. Early prediction of pathologic response to neoadjuvant therapy in breast cancer: systematic review of the accuracy of MRI. Breast. 2012; 21:669–677. PMID: 22863284.
crossref
2. Lyou CY, Cho N, Kim SM, Jang M, Park JS, Baek SY, et al. Computer-aided evaluation of breast MRI for the residual tumor extent and response monitoring in breast cancer patients receiving neoadjuvant chemotherapy. Korean J Radiol. 2011; 12:34–43. PMID: 21228938.
crossref
3. Pickles MD, Gibbs P, Lowry M, Turnbull LW. Diffusion changes precede size reduction in neoadjuvant treatment of breast cancer. Magn Reson Imaging. 2006; 24:843–847. PMID: 16916701.
crossref
4. Li SP, Padhani AR. Tumor response assessments with diffusion and perfusion MRI. J Magn Reson Imaging. 2012; 35:745–763. PMID: 22434697.
crossref
5. Padhani AR, Dzik-Jurasz A. Perfusion MR imaging of extracranial tumor angiogenesis. Top Magn Reson Imaging. 2004; 15:41–57. PMID: 15057172.
crossref
6. Knopp MV, Weiss E, Sinn HP, Mattern J, Junkermann H, Radeleff J, et al. Pathophysiologic basis of contrast enhancement in breast tumors. J Magn Reson Imaging. 1999; 10:260–266. PMID: 10508285.
crossref
7. Kim SH, Lee HS, Kang BJ, Song BJ, Kim HB, Lee H, et al. Dynamic contrast-enhanced MRI perfusion parameters as imaging biomarkers of angiogenesis. PLoS One. 2016; 11:e0168632. PMID: 28036342.
crossref
8. Kerbel RS, Klement G, Pritchard KI, Kamen B. Continuous low-dose anti-angiogenic/metronomic chemotherapy: from the research laboratory into the oncology clinic. Ann Oncol. 2002; 13:12–15. PMID: 11863092.
9. Khalifa F, Soliman A, El-Baz A, Abou El-Ghar M, El-Diasty T, Gimel'farb G, et al. Models and methods for analyzing DCE-MRI: a review. Med Phys. 2014; 41:124301. PMID: 25471985.
crossref
10. Padhani AR, Hayes C, Assersohn L, Powles T, Makris A, Suckling J, et al. Prediction of clinicopathologic response of breast cancer to primary chemotherapy at contrast-enhanced MR imaging: initial clinical results. Radiology. 2006; 239:361–374. PMID: 16543585.
crossref
11. Ah-See ML, Makris A, Taylor NJ, Harrison M, Richman PI, Burcombe RJ, et al. Early changes in functional dynamic magnetic resonance imaging predict for pathologic response to neoadjuvant chemotherapy in primary breast cancer. Clin Cancer Res. 2008; 14:6580–6589. PMID: 18927299.
crossref
12. Li X, Arlinghaus LR, Ayers GD, Chakravarthy AB, Abramson RG, Abramson VG, et al. DCE-MRI analysis methods for predicting the response of breast cancer to neoadjuvant chemotherapy: pilot study findings. Magn Reson Med. 2014; 71:1592–1602. PMID: 23661583.
crossref
13. Tudorica A, Oh KY, Chui SY, Roy N, Troxell ML, Naik A, et al. Early prediction and evaluation of breast cancer response to neoadjuvant chemotherapy using quantitative DCE-MRI. Transl Oncol. 2016; 9:8–17. PMID: 26947876.
crossref
14. Miyamoto Y, Ito T, Takada E, Omoto K, Hirai T, Moriyasu F. Efficacy of sonazoid (perflubutane) for contrast-enhanced ultrasound in the differentiation of focal breast lesions: phase 3 multicenter clinical trial. AJR Am J Roentgenol. 2014; 202:W400–W407. PMID: 24660739.
crossref
15. Caproni N, Marchisio F, Pecchi A, Canossi B, Battista R, D'Alimonte P, et al. Contrast-enhanced ultrasound in the characterisation of breast masses: utility of quantitative analysis in comparison with MRI. Eur Radiol. 2010; 20:1384–1395. PMID: 20033178.
crossref
16. Wan CF, Du J, Fang H, Li FH, Zhu JS, Liu Q. Enhancement patterns and parameters of breast cancers at contrast-enhanced US: correlation with prognostic factors. Radiology. 2012; 262:450–459. PMID: 22282183.
crossref
17. Cao X, Xue J, Zhao B. Potential application value of contrast-enhanced ultrasound in neoadjuvant chemotherapy of breast cancer. Ultrasound Med Biol. 2012; 38:2065–2071. PMID: 23062366.
crossref
18. Lee SC, Grant E, Sheth P, Garcia AA, Desai B, Ji L, et al. Accuracy of contrast-enhanced ultrasound compared with magnetic resonance imaging in assessing the tumor response after neoadjuvant chemotherapy for breast cancer. J Ultrasound Med. 2017; 36:901–911. PMID: 28150325.
crossref
19. Saracco A, Szabó BK, Tánczos E, Bergh J, Hatschek T. Contrast-enhanced ultrasound (CEUS) in assessing early response among patients with invasive breast cancer undergoing neoadjuvant chemotherapy. Acta Radiol. 2017; 58:394–402. PMID: 27461224.
crossref
20. Tofts PS, Brix G, Buckley DL, Evelhoch JL, Henderson E, Knopp MV, et al. Estimating kinetic parameters from dynamic contrast-enhanced T(1)-weighted MRI of a diffusable tracer: standardized quantities and symbols. J Magn Reson Imaging. 1999; 10:223–232. PMID: 10508281.
crossref
21. Just N. Improving tumour heterogeneity MRI assessment with histograms. Br J Cancer. 2014; 111:2205–2213. PMID: 25268373.
crossref
22. Heo SH, Shin SS, Kim JW, Lim HS, Jeong YY, Kang WD, et al. Pre-treatment diffusion-weighted MR imaging for predicting tumor recurrence in uterine cervical cancer treated with concurrent chemoradiation: value of histogram analysis of apparent diffusion coefficients. Korean J Radiol. 2013; 14:616–625. PMID: 23901319.
crossref
23. Tranquart F, Mercier L, Frinking P, Gaud E, Arditi M. Perfusion quantification in contrast-enhanced ultrasound (CEUS)--ready for research projects and routine clinical use. Ultraschall Med. 2012; 33(Suppl 1):S31–S38. PMID: 22723027.
24. Zink F, Kratzer W, Schmidt S, Oeztuerk S, Mason RA, Porzner M, et al. Comparison of two high-end ultrasound systems for contrast-enhanced ultrasound quantification of mural microvascularity in crohn's disease. Ultraschall Med. 2016; 37:74–81. PMID: 26251995.
crossref
25. Park CK, Jung WH, Koo JS. Pathologic evaluation of breast cancer after neoadjuvant therapy. J Pathol Transl Med. 2016; 50:173–180. PMID: 27068026.
crossref
26. Ogston KN, Miller ID, Payne S, Hutcheon AW, Sarkar TK, Smith I, et al. A new histological grading system to assess response of breast cancers to primary chemotherapy: prognostic significance and survival. Breast. 2003; 12:320–327. PMID: 14659147.
crossref
27. Cho N, Im SA, Park IA, Lee KH, Li M, Han W, et al. Breast cancer: early prediction of response to neoadjuvant chemotherapy using parametric response maps for MR imaging. Radiology. 2014; 272:385–396. PMID: 24738612.
crossref
28. Prevos R, Smidt ML, Tjan-Heijnen VC, van Goethem M, Beets-Tan RG, Wildberger JE, et al. Pre-treatment differences and early response monitoring of neoadjuvant chemotherapy in breast cancer patients using magnetic resonance imaging: a systematic review. Eur Radiol. 2012; 22:2607–2616. PMID: 22983282.
crossref
29. Corcioni B, Santilli L, Quercia S, Zamagni C, Santini D, Taffurelli M, et al. Contrast-enhanced US and MRI for assessing the response of breast cancer to neoadjuvant chemotherapy. J Ultrasound. 2008; 11:143–150. PMID: 23396645.
crossref
30. Dietrich CF, Averkiou MA, Correas JM, Lassau N, Leen E, Piscaglia F. An EFSUMB introduction into dynamic contrast-enhanced ultrasound (DCE-US) for quantification of tumour perfusion. Ultraschall Med. 2012; 33:344–351. PMID: 22843433.
crossref
31. Gauthier TP, Chebil M, Peronneau P, Lassau N. In vitro evaluation of the impact of ultrasound scanner settings and contrast bolus volume on time-intensity curves. Ultrasonics. 2012; 52:12–19. PMID: 21722933.
crossref
32. Ko ES, Han H, Han BK, Kim SM, Kim RB, Lee GW, et al. Prognostic significance of a complete response on breast MRI in patients who received neoadjuvant chemotherapy according to the molecular subtype. Korean J Radiol. 2015; 16:986–995. PMID: 26357493.
crossref
Fig. 1

Study design diagram.

MRI = magnetic resonance imaging, NAC = neoadjuvant chemotherapy, US = ultrasound
kjr-19-682-g001
Fig. 2

37-year-old woman with invasive ductal carcinoma of right breast.

After six cycles of anthracycline/taxane-based NAC, patient underwent breast-conserving surgery. Surgical specimen indicated complete response (Miller-Payne grade 5).
DCE T1-weighted MR images (A, F) and their corresponding Ktrans maps (B, G) performed before (A, B) and after 2 cycles (F, G) of NAC. Ktrans and Kep values were significantly decreased after NAC. Median values of %change were Ktrans, −83% and Kep, −69%. DCE-US images (B-mode images, C, H; enhanced images, D, I) and their TICs (E, J) performed before (C–E) and after 1 cycle (H–J) of NAC. RT increased from 31.1 to 38.0 seconds (22% change). DCE = dynamic contrast-enhanced, Kep = reverse constant, Ktrans = transfer constant, MR = magnetic resonance, RT = rise time, TIC = time-intensity curve
kjr-19-682-g002
Fig. 3

39-year-old woman with invasive ductal carcinoma of right breast.

After six cycles of anthracycline/taxane-based NAC, patient underwent breast-conserving surgery. Surgical specimen indicated minor loss of tumor cells (Miller-Payne grade 2).
DCE T1-weighted MR images (A, F) and their corresponding Ktrans maps (B, G) performed before (A, B) and after 2 cycles (F, G) of NAC. Ktrans was decreased and Kep was increased after NAC. Median values of %change were Ktrans, −36.8% and Kep, 19.2%. DCE-US images (B-mode images, C, H; enhanced images, D, I) and their TICs (E, J) performed before (C–E) and after 1 cycle (H–J) of NAC. RT slightly increased from 25.8 to 27.7 seconds (7.5% change).
kjr-19-682-g003
Table 1

Clinical Characteristics of Study Population

kjr-19-682-i001
Characteristics All Patients (n = 39) Minor Responders (n = 27) Good Responders (n = 12) P
Age at diagnosis (years) 45 (25–67) 47 (25–59) 45 (32–67) 0.658
Clinical TNM stage 0.169
 II 17 14 (82.4) 3 (17.6)
 III 22 13 (59.1) 9 (40.9)
Clinical T stage 0.012*
 2 16 15 (93.8) 1 (6.2)
 3 23 12 (52.2) 11 (47.8)
Histologic type 0.526
 IDC 37 26 (70.3) 11 (29.7)
 Non-IDC 2 1 (50.0) 1 (50.0)
Estrogen or progesterone receptor 0.734
 Negative 15 11 (73.3) 4 (26.7)
 Positive 24 16 (66.7) 8 (33.3)
HER2 > 0.999
 Negative 23 16 (69.6) 7 (30.4)
 Positive 16 11 (68.8) 5 (31.3)
Subtype 0.253
 Luminal 24 16 (66.7) 8 (33.3)
HER2-enriched 6 3 (50.0) 3 (50.0)
 Triple negative 9 8 (88.9) 1 (11.1)
NAC regimen 0.493
 Anthracycline/cyclophosphamide 11 8 (72.7) 3 (27.3)
 Anthracycline/taxane 23 16 (69.6) 7 (30.4)
 Anthracycline/cyclophosphamide + taxane 2 2 (100.0) 0 (0.0)
 Anthracycline/taxane + trastuzumab 3 1 (33.3) 2 (66.7)
Surgery 0.122
 Breast conserving surgery 11 10 (90.9) 1 (9.1)
 Mastectomy 28 17 (60.7) 11 (39.3)
Interval between two DCE-MRI (days) 44 (33–67) 44 (33–63) 44 (33–67) 0.234
Interval between two DCE-US (days) 21 (20–28) 21 (21–28) 21 (20–21) 0.067

Data are presented as median (range) or n (%). P values for differences were determined by Wilcoxon rank sum test for continuous variables and chi-square test or fisher's exact test for categorical variables. Histopathologic examination results were obtained from core needle biopsy specimen. In case of no available immunohistochemistry results before chemotherapy, data obtained from surgical specimen was presented. *Statistically significant differences (p < 0.05). DCE-MRI = dynamic contrast-enhanced magnetic resonance imaging, DCE-US = DCE ultrasound, HER2 = human epidermal growth factor receptor 2, IDC = invasive ductal carcinoma, NAC = neoadjuvant chemotherapy, TNM = tumor/node/metastasis

Table 2

DCE-MRI Histogram Metrics before and after 2 Cycles of NAC for Discrimination between Minor and Good Responders

kjr-19-682-i002
Metrics Pre-NAC Post-NAC %Change
Minor Responders Good Responders P Minor Responders Good Responders P Minor Responders Good Responders P
Ktrans (min−1)
 Mean 0.26 ± 0.16 0.23 ± 0.12 0.374 0.17 ± 0.09 0.10 ± 0.09 0.005* −25.89 ± 42.06 −53.57 ± 32.93 0.024*
 25th Percentile 0.16 ± 0.12 0.15 ± 0.10 0.730 0.11 ± 0.06 0.06 ± 0.06 0.011* −15.00 ± 64.57 −50.64 ± 49.80 0.028*
 50th Percentile 0.25 ± 0.16 0.22 ± 0.12 0.408 0.16 ± 0.09 0.10 ± 0.09 0.008* −24.47 ± 47.17 −53.81 ± 35.42 0.024*
 75th Percentile 0.35 ± 0.19 0.29 ± 0.16 0.271 0.23 ± 0.12 0.13 ± 0.12 0.008* −28.10 ± 38.48 −53.84 ± 29.45 0.024*
 Skewness 0.30 ± 0.35 0.33 ± 0.23 0.685 0.35 ± 0.33 0.46 ± 0.22 0.284 179.89 ± 1815.01 94.34 ± 414.30 0.408
 Kurtosis −0.83 ± 0.42 −0.82 ± 0.27 0.578 −0.78 ± 0.36 −0.57 ± 0.31 0.052 −54.09 ± 177.15 −30.22 ± 40.11 0.685
Kep (min−1)
 Mean 0.60 ± 0.31 0.51 ± 0.22 0.620 0.40 ± 0.18 0.23 ± 0.10 0.005* −20.58 ± 42.85 −50.91 ± 16.02 0.049*
 25th Percentile 0.37 ± 0.21 0.33 ± 0.14 0.822 0.25 ± 0.12 0.13 ± 0.05 0.002* −13.78 ± 54.95 −56.41 ± 17.32 0.020*
 50th Percentile 0.56 ± 0.29 0.48 ± 0.21 0.499 0.38 ± 0.17 0.21 ± 0.08 0.002* −20.06 ± 43.41 −53.16 ± 15.64 0.056
 75th Percentile 0.79 ± 0.40 0.66 ± 0.30 0.408 0.53 ± 0.23 0.31 ± 0.14 0.002* −22.59 ± 40.77 −49.39 ± 16.88 0.056
 Skewness 0.39 ± 0.38 0.40 ± 0.21 0.940 0.37 ± 0.32 0.71 ± 0.37 0.009* −267.49 ± 1431.67 −170.78 ± 970.39 0.065
 Kurtosis −0.50 ± 0.56 −0.58 ± 0.21 > 0.999 −0.53 ± 0.45 0.13 ± 0.86 0.013* 1.79 ± 115.12 −105.62 ± 218.90 0.056
Ve (%)
 Mean 0.55 ± 0.19 0.52 ± 0.17 0.631 0.51 ± 0.21 0.45 ± 0.16 0.505 −2.22 ± 37.82 −9.85 ± 32.34 0.792
 25th Percentile 0.47 ± 0.18 0.45 ± 0.17 0.792 0.43 ± 0.21 0.33 ± 0.15 0.297 −2.19 ± 46.21 −23.12 ± 34.47 0.195
 50th Percentile 0.55 ± 0.19 0.52 ± 0.17 0.722 0.51 ± 0.21 0.44 ± 0.17 0.429 −2.04 ± 40.70 −12.29 ± 35.99 0.566
 75th Percentile 0.62 ± 0.20 0.58 ± 0.18 0.525 0.58 ± 0.22 0.55 ± 0.20 0.653 −2.14 ± 35.18 −2.03 ± 36.18 > 0.999
 Skewness 0.16 ± 0.54 0.31 ± 0.53 0.429 0.24 ± 0.55 0.67 ± 0.68 0.053 126.47 ± 1393.26 50.51 ± 600.70 0.609
 Kurtosis −0.20 ± 1.3 0.08 ± 1.25 0.466 −0.12 ± 1.16 0.56 ± 1.65 0.297 −228.99 ± 680.02 −175.05 ± 258.45 0.411

Values are presented as means (SD). P values for differences were determined by Wilcoxon signed rank sum test. *Statistically significant differences (p < 0.05). %change = ([post-NAC values − pre-NAC values] / pre-NAC values) × 100. Kep = reverse constant, Ktrans = transfer constant, SD = standard deviation, Ve = leakage space

Table 3

Diagnostic Performance of DCE-MRI Histogram Metrics (Post-NAC and %Change) to Predict Good Response after NAC

kjr-19-682-i003
Metrics Post-NAC %Change
Mean 25th Percentile 50th Percentile 75th Percentile Skewness Kurtosis Mean 25th Percentile 50th Percentile 75th Percentile Skewness Kurtosis
Ktrans
 AUC 0.78 0.76 0.77 0.77 0.61 0.70 0.73 0.72 0.73 0.73 0.59 0.54
 CI 0.60–0.96 0.57–0.94 0.58–0.95 0.58–0.95 0.43–0.79 0.53–0.87 0.54–0.92 0.53–0.91 0.54–0.91 0.54–0.91 0.40–0.77 0.34–0.75
 Sensitivity 0.75 0.58 0.75 0.75 0.92 0.92 0.67 0.67 0.67 0.67 0.92 0.58
 Specificity 0.81 0.93 0.78 0.81 0.44 0.56 0.85 0.81 0.85 0.81 0.44 0.59
p value 0.002* 0.007* 0.005* 0.005* 0.223 0.021* 0.017* 0.022* 0.016* 0.015* 0.362 0.677
 Cutoff 0.11 0.04 0.10 0.14 0.21 −0.81 −59.69 −63.26 −60.14 −59.60 −35.12 −17.91
Kep
 AUC 0.78 0.81 0.81 0.80 0.76 0.75 0.70 0.73 0.69 0.69 0.69 0.69
 CI 0.63–0.93 0.67–0.94 0.67–0.95 0.66–0.95 0.59–0.93 0.57–0.93 0.54–0.86 0.58–0.89 0.53–0.86 0.53–0.86 0.5–0.87 0.49–0.9
 Sensitivity 0.92 1 1 0.92 0.58 0.58 1 1 1 0.92 0.67 0.58
 Specificity 0.56 0.59 0.59 0.59 0.89 0.89 0.48 0.52 0.48 0.52 0.78 0.85
p value < 0.001* < 0.001* < 0.001* < 0.001* 0.002* 0.006* 0.015* 0.004* 0.020* 0.020* 0.048* 0.065
 Cutoff 0.37 0.23 0.34 0.47 0.75 0.01 −16.92 −23.02 −19.32 −32.60 38.51 −102.36
Ve
 AUC 0.43 0.61 0.42 0.45 0.70 0.61 0.53 0.63 0.56 0.50 0.55 0.59
 CI 0.22–0.64 0.40–0.82 0.20–0.63 0.25–0.66 0.52–0.88 0.39–0.83 0.33–0.73 0.44–0.83 0.36–0.76 0.30–0.70 0.34–0.77 0.38–0.79
 Sensitivity 0.50 0.50 0.50 0.50 0.50 0.50 0.58 0.75 0.58 0.58 0.33 0.33
 Specificity 0.65 0.81 0.65 0.65 0.88 0.81 0.58 0.54 0.58 0.58 0.88 0.88
p value 0.505 0.314 0.442 0.643 0.029* 0.327 0.774 0.166 0.552 > 0.999 0.615 0.406
 Cutoff 0.51 0.29 0.50 0.62 0.75 0.24 −13.71 −12.58 −13.85 −9.20 130.61 −334.69

Optimal threshold was chosen according to Youden index. *Statistically significant differences (p < 0.05). %change = ([post-NAC values − pre-NAC values] / pre-NAC values) × 100.

AUC = area under ROC curve, CI = confidence interval, ROC = receiver operating characteristic

Table 4

DCE-US Parameters before and after NAC for Discrimination between Minor and Good Responders

kjr-19-682-i004
Parameter Pre-NAC Post-NAC %Change
Minor Responders Good Responders P Minor Responders Good Responders P Minor Responders Good Responders P
PE (a.u) 1311.41 ± 973.00 1393.58 ± 1327.97 0.964 1438.49 ± 1100.50 1509.08 ± 1239.26 0.916 142.49 ± 404.55 54.53 ± 132.23 0.869
AUCt (a.u) 95446.31 ± 71297.91 79922.77 ± 49590.54 0.642 110369.20 ± 88678.69 102508.93 ± 77247.87 0.934 588.34 ± 2225.53 85.03 ± 179.33 0.987
WiR (a.u) 69.57 ± 61.46 79.26 ± 89.69 0.893 82.40 ± 69.88 62.38 ± 46.75 0.62 148.53 ± 365.68 34.70 ± 119.23 0.48
WoR (a.u) 19.62 ± 22.06 32.79 ± 53.43 0.425 20.88 ± 18.44 23.42 ± 21.77 0.753 100.41 ± 187.74 47.44 ± 121.92 0.679
TTP (s) 47.21 ± 14.03 48.92 ± 12.66 0.845 45.87 ± 14.67 52.23 ± 10.24 0.111 3.01 ± 38.55 16.69 ± 44.81 0.313
RT (s) 32.57 ± 7.79 30.64 ± 8.25 0.298 32.55 ± 8.76 35.74 ± 5.92 0.178 8.56 ± 53.81 23.96 ± 32.21 0.042*

Values are presented as means (SD). P values for differences were determined by Wilcoxon rank sum test. *Statistically significant differences (p < 0.05). %change = ([post-NAC values − pre-NAC values] / pre-NAC values) − 100. AUCt = area under time-intensity curve, PE = peak-enhancement, RT = rise time, TTP = time to peak, WiR = wash-in rate, WoR = wash-out rate

TOOLS
Similar articles