

 PDF
PDF ePub
ePub Citation
 Print
Print


INTRODUCTION
To understand the anatomy of the hepatic artery, portal vein and hepatic vein is of immense importance for liver transplantation and tumor resection because of the complex liver vascular system with many anatomical variations (1234). Currently, the evaluation of the hepatic vascular system is primarily through the use of multi-slice computed tomography (CT) angiography (MSCTA). Recently, spectral CT imaging has been gradually applied clinically (567). Spectral CT energy imaging using single-source instantaneous kVp switching technology can switch between high and low tube voltage (140 kVp and 80 kVp) instantaneously in less than 0.5 ms for a quasi-simultaneous sampling of two sets of data. This mode of spectral CT holds potential in reconstructing any monochromatic image in the range of 40–140 keV (8). Monochromatic imaging with the optimal contrast between blood vessels and their surrounding tissues can be obtained by optimizing the contrast-to-noise ratio (CNR) curve, and it is thus possible to achieve good vessel imaging by use of low dose of contrast agent. The purpose of this study was to improve the hepatic vascular imaging by improving the CNR of the blood vessels through the employment of the optimal monochromatic images with conventional dose, concentration and flow rate of contrast medium.
Go to : 
MATERIALS AND METHODS
Subjects
Between April 2014 and May 2015, 35 patients who underwent abdominal contrast-enhanced CT angiography with spectral CT in our hospital were enrolled in the present study. There were 18 male and 17 female patients, with an age range of 29–76 years (mean 58.1 ± 10.1 years). The inclusion criteria were as follows: no abdominal surgery and no abdominal diseases affecting the blood vessels. Patients with single small (< 5 cm in diameter) liver cysts, liver hemangiomas and renal cysts with no effect on the blood vessel distribution were also included. Patients who had obvious artifacts in their abdominal vascular enhancement images were excluded from the study. This study was approved by the hospital ethics committee, and all patients were informed about the procedure and signed informed consent was obtained from them.
Scanning and Reconstruction Techniques
Abdominal CT angiography was performed in all 35 patients with a spectral CT scanner (Discovery CT 750 HD, GE Healthcare, Milwaukee, WI, USA) with gemstone spectral imaging. The scanning ranged from the diaphragmatic level to the level of the anterior superior iliac crest. The scanning protocol included tube voltage of 140 kVp and 80 kVp with instantaneous (0.5 ms) switch, automatic mAs modulation, pitch 0.984, gantry rotation time 0.5 seconds, 0.625 mm of layer thickness or spacing, and field of view 50 × 50 cm. The contrast agent (ioversol, 320 mg I/mL) was used with a flow rate of 3.0 mL/s and the total amount of contrast medium was 1 mL/kg. The arterial phase scanning was started 8 seconds after the trigger threshold (100 Hounsfield units) was reached on the abdominal aorta at the celiac level and the portal venous phase scanning was started 30 seconds after the arterial phase was ended.
The gemstone spectral imaging analysis software (GE Healthcare) was used to obtain the best CNR curves between 1) the celiac trunk artery and the erector muscle of the spine at the same level, 2) the main portal vein and the hepatic parenchyma, and 3) the hepatic vein (the original image of the hepatic veins in the portal venous phase) and hepatic parenchyma. Based on these curves, the optimal monochromatic keV values for displaying the optimal images of the common hepatic artery, portal vein and hepatic vein were obtained. Subsequently, two-dimensional and three-dimensional reconstructions were performed, including maximum intensity projection and multiplanar reformation of the common hepatic artery, portal vein and hepatic veins.
Objective Assessment
A circular region of interest (ROI) with an area of 15–20 mm2 was used to measure the CT values of the celiac trunk artery, portal and hepatic veins. The CT values of the erector muscle and the hepatic parenchyma were measured similarly, without being affected by surrounding vessels or fat. The CT values were measured thrice, and a mean value was obtained for each area. The background CT values were also evaluated at the erector muscle or hepatic parenchyma at the same level. The CNR and signal-to-noise ratio (SNR) was calculated as follows: the SNR was calculated as the mean CT value of ROI divided by the mean image noise (IN), whereas the CNR was evaluated as the mean CT value of vessel minus the CT value of the background muscle divided by the mean IN of vessel, according to the following formula: CNR = (ROIo−ROId)/SDn and SNR = ROIo/SDn, where ROIo indicates the CT value of the celiac trunk artery, portal vein or hepatic vein, ROId denotes the CT value of the spinal erector muscle at the same slice for the hepatic artery or the parenchyma for the portal vein and hepatic vein, and SDn refers to the mean background IN. The average IN for the hepatic artery was calculated as the standard deviation (SD) of the CT values of the spinal erector muscle at the same level, and the IN for the portal vein or hepatic vein was the SD of the CT value of the hepatic parenchyma.
Subjective Assessment
Two radiologists, each with 5 years of experience, performed a separate evaluation of the common hepatic artery, portal vein, and hepatic vein on a workstation with dedicated software (Gemstone Spectral Imaging Viewer, GE Healthcare). The optimal monochromatic images, the 70 keV spectral images, and the mixed energy (quality check, QC) images of the common hepatic artery, portal vein, and hepatic vein were evaluated. In the gemstone CT spectral scanning, these mixed energy images (QC images) are to obtain a quick view of the scanning effect and range and for comparison with the monochromatic spectral images rather than for clinical diagnosis. Radiologists evaluated the images blindly using the same window width and position with a five-point scale (91011): 5, excellent vessel signal intensity with very sharp edge of vessels; 4, good signal intensity with sharp edge of vessels; 3, fair signal intensity with fairly sharp edge of vessels; 2, bad signal intensity with unclear vessel edge; and 1, worse signal intensity with blurred edge of vessels.
Statistical Analysis
Data analysis was processed using SPSS 22.0 statistical software package (IBM Corp., Armonk, NY, USA). Continuous data were expressed as a mean ± SD and categorical variables as frequencies or percentage. ANOVA was used to compare the CT values, noise, CNR, and SNR of the common hepatic artery, portal vein and hepatic vein, and IN of the background. P < 0.05 was considered statistically significant.
Go to :
RESULTS
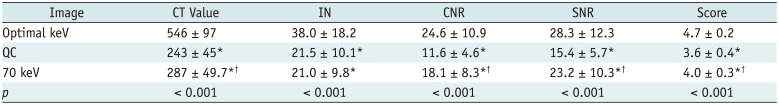
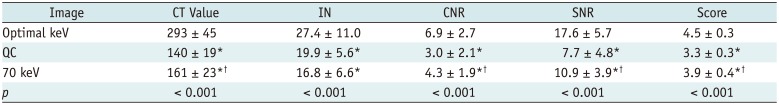
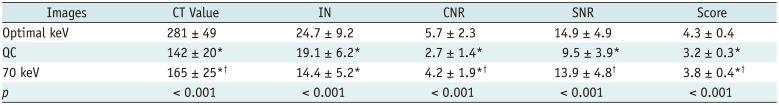
Pancreatic cancer was present in 3 patients, common bile duct neoplasm in 4 patients, small hepatic hemangiomas in 19 patients, small liver cysts in 5 patients, and liver metastases in 4 patients. The optimal monochromatic energies for imaging of the common hepatic artery, portal vein and hepatic vein in the 35 patients were located between 49 keV and 53 keV with an average of 51 keV. A significant (p < 0.05) difference existed in the hepatic vascular CT value, IN, CNR, SNR, and subjective score among the optimal monochromatic, 70 keV and QC images. The CT value, IN, CNR, and SNR of the common hepatic artery, portal vein and hepatic vein were significantly (p < 0.001) higher in the optimal monochromatic images (546 ± 97, 38.0 ± 18.2, 24.6 ± 10.9, and 28.3 ± 12.3, p < 0.001, respectively, for the common hepatic artery; 293 ± 45, 27.4 ± 11.0, 6.9 ± 2.7, and 17.6 ± 5.7, p < 0.001, respectively, for the portal vein; and 281 ± 49, 24.7 ± 9.2, 5.7 ± 2.3, and 14.9 ± 4.9, p < 0.001, respectively for the hepatic vein) than in the 70 keV (287 ± 49.7, 21.0 ± 9.8, 18.1 ± 8.3, and 23.2 ± 10.3, p < 0.001, respectively, for the common hepatic artery; 161 ± 23, 16.8 ± 6.6, 4.3 ± 1.9, and 10.9 ± 3.9, p < 0.001, respectively, for the portal vein; 165 ± 25, 14.4 ± 5.2, 4.2 ± 1.9, and 13.9 ± 4.8, p < 0.001, respectively, for the hepatic vein) and the QC (243 ± 45, 21.5 ± 10.1, 11.6 ± 4.6, and 15.4 ± 5.7, p < 0.001, respectively, for the common hepatic artery; 140 ± 19, 19.9 ± 5.6, 3.0 ± 2.1, and 7.7 ± 4.8, p < 0.001, respectively, for the portal vein; 142 ± 20, 19.1 ± 6.2, 2.7 ± 1.4, and 9.5 ± 3.9, p < 0.001, respectively, for the hepatic vein) images. The subjective scores of the image quality of common hepatic artery, portal vein and hepatic vein in the optimal monochromatic images (4.7 ± 0.2, 4.5 ± 0.3, and 4.3 ± 0.4, respectively) were significantly (p < 0.001) higher than in the 70 keV (4.0 ± 0.3, 3.9 ± 0.4, and 3.8 ± 0.4, respectively) and QC (3.6 ± 0.4, 3.3 ± 0.3, and 3.2 ± 0.3, respectively) images (Tables 1,2,3, Fig. 1).
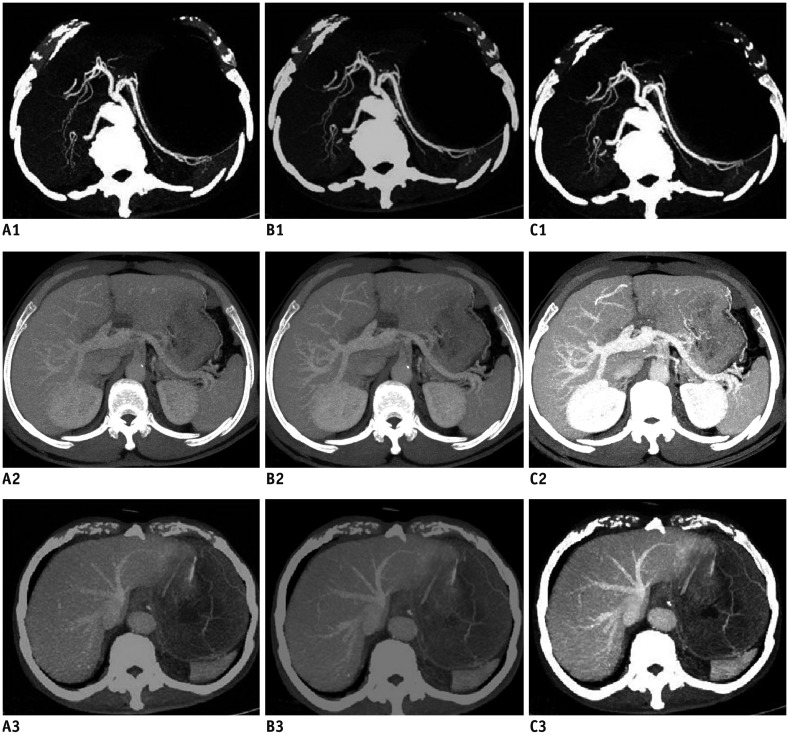 | Fig. 1Comparison of images.In phase of hepatic artery in QC (A1), in 50 keV (B1), and in 70 keV (C1). In phase of portal vein for QC (A2), in 50 keV (B2), and in 70 keV (C2). In phase of hepatic vein in QC (A3), in 50 keV (B3), and in 70 keV (C3). QC = quality check
|
Table 1
Comparison of Hepatic Artery under Monochromatic and Hybrid Spectrum
![]()
Table 2
Comparison of Portal Vein under Monochromatic and Hybrid Spectrum
![]()
Table 3
Comparison of Hepatic Vein under Monochromatic and Hybrid Spectrum
![]()
The CT value, CNR, SNR, and a subjective score of the common hepatic artery (celiac artery), portal vein and hepatic vein were significantly (p < 0.05) higher in the 70 keV images than in the QC images. There was no statistically (p > 0.05) significant difference in the IN between the two groups.
Go to :
DISCUSSION
The anatomy of the hepatic vascular system is very important in the planning of hepatic surgery, and sufficient understanding of the anatomy and variations in the system is crucial in order to choose the adequate surgery plan and to avoid complications. MSCTA can be used to accurately demonstrate the vascular anatomy, possible variations and relationship with surrounding tissues (12121314).
The quality of hepatic vascular imaging depends on the contrast media concentration, which can be affected by many factors, including contrast dosage, blood flow rate, scan delay time, and scan mode. Portal and hepatic venous imaging also get affected by cardiac function, spleen perfusion and interference from the presence of surrounding vessels like the superior mesenteric vein. In the past, high quality CT angiography was often achieved by increasing the dose of contrast media and flow rate, adjusting the pitch and section thickness, or increasing the radiation dose and modifying other scanning conditions (15), which had the potential to increase the adverse reactions caused by the contrast agents, increase the likelihood of contrast extravasations and increase the occurrence of contrast-induced nephropathy. The strategies to reduce the concentration of contrast media and flow rate without affecting the image quality has become a hot research topic in the field of radiology. Low energy levels for imaging can approximate the k peak of iodine absorption (33.2 keV) and produce the “brightest” iodine and the greatest image contrast. And low kVp and dual-energy CT can exploit the K-edge phenomenon to improve vessel contrast when contrast is applied (16). The monochromatic image of the spectrum has different characteristics at different energy levels. At a low energy level, X-ray has low penetration ability, but the CT values and contrast of tissues can be increased despite an increase in the tissue IN (17), whereas at a high energy level, the hardening artifacts in the imaging can be reduced but the tissue contrast decreases. The optimal monochromatic image can best display the vessels without enhancing the background noise, and the conditions of this optimal monochromatic image can be obtained employing optimal CNR curve in the conventional scanning mode.
In this study, the optimal monochromatic values for imaging of the common hepatic artery, portal and hepatic vein were in the 49–53 keV range, with an average of 51 keV. In the optimal monochromatic keV datasets, the CT value, SNR, CNR, and IN of the common hepatic artery and portal vein were significantly (p < 0.05) increased compared with those in the QC images and 70 keV images. Although the optimal monochromatic images had increased background noise, the contrast was increased between the common hepatic artery and the erector muscle and between the hepatic veins and the parenchyma. An increase in the background noise did not affect the display of the common hepatic artery, portal and hepatic vein. In this study, the CNR and SNR of the hepatic vessels were the highest in the optimal monochromatic images, and the subjective scores of the common hepatic artery, portal and hepatic vein were also observed to be superlative.
A few studies have demonstrated that the low voltage and adaptive statistical iterative reconstruction algorithm could reduce the radiation dose and contrast agent dosage in abdominal angiography; however, the conditions were applied only in pediatric patients and lower weight population (1819). After studying the relationship between tube voltage and CT attenuation value of iodine, Huda et al. (20) confirmed that the attenuation value of iodinated enhancement increased at a lower tube voltage, leading to higher enhancement. Other studies demonstrated that by keeping all other parameters equivalent, dynamic CT of the abdominal organs and aorta provided extensive and intensive enhancement at 90 kVp than the standard voltage of 120 kVp (2122). Low-voltage CT angiography has also been reported to produce higher enhancement and a simultaneous reduction in radiation dose compared with standard-voltage CT angiography (23). These reports indicated that the low-tube-voltage techniques in CT angiography may deliver diagnostic images at a reduced contrast dose. As the penetration of X-ray reduces with increase in the patients' body mass index (24), it has been hypothesized that the image quality in lower tube voltage may be affected in patients with higher body mass index. In case of patients with a high body mass index, the optimal CNR spectroscopy technology can provide higher quality images of the abdominal blood vessels and portal veins with the application of low dosage of contrast agent for reducing the total iodine content (2526). In imaging patients with greater body mass indexes, the use of energy spectrum plus adaptive statistical iterative reconstruction algorithm can provide abdominal vascular images of good quality without increasing X-ray radiation and contrast dosage compared with traditional angiography (27). Therefore, it is proposed that the spectrum CT scanning mode can reduce the contrast media dosage and flow rate and provide vascular images of higher quality without increasing radiation dosage at the same time. In our study, the normal liver enhancement effect and the quality of hepatic vascular imaging were ensured by the use of conventional contrast media concentration, flow velocity and low contrast media volume model.
This study investigated the vascular image quality by comparing the QC mixed energy images with the monochromatic images using spectral monochromatic scanning in the same group of patients with abdominal diseases. As the two different modes of imaging were obtained in the same scanning conditions with the same CT scanner, factors affecting the imaging quality in the CT scanner, scanning parameters and patients were excluded, and a good comparison of images could thus be achieved. For the same patient, the optimization of the vascular images in the two imaging modes relies mostly on the density difference between the blood vessels and the hepatic parenchyma or adjacent muscles, and consequently, this study used the contrast resolution as an objective parameter for evaluation of the CT image quality along with noise and SNR. The optimal keV can increase the density difference between blood vessels and hepatic parenchyma or adjacent muscles for objective vascular display.
Some limitations may exist in this study, which includes a smaller sample, conventional contrast agent rather than a low dosage of contrast for comparison, and analysis only on the normal hepatic tissue rather than in the diseased tissues. Moreover, this study did not investigate the possible influence of the combined use of optimal monochromatic technique and adaptive statistical iterative reconstruction algorithm on the quality of the hepatic vascular image. Future studies are necessitated to address these limitations.
In summary, the optimal monochromatic imaging of spectral CT can improve the CT imaging parameters and optimize the image quality of the common hepatic artery, hepatic portal vein and hepatic vein compared to the conventional scanning mode.
Go to :
 XML Download