

 PDF
PDF ePub
ePub Citation
 Print
Print


INTRODUCTION
Hepatic tumor ablation is an established treatment alternative for selected patients with primary and secondary liver tumors. Amongst the different techniques of tumor ablation, irreversible electroporation (IRE) is a new and promising alternative to radiofrequency ablation (RFA), microwave ablation (MWA), laser ablation, and cryoablation. In contrast to other ablation techniques, IRE is deemed to be a non-thermal ablation method that induces tumor necrosis by means of short trains of electric pulses that irreversibly damage cell membranes, thus leading to apoptosis and cell death (12). Based on this principle, IRE primarily affects lesions with high cell density, which is especially the case for tumors. Tissue that merely consists of fibrous tissue, like blood vessels and bile ducts, is not supposed to be affected by ablative effects of IRE (34). Generally, a thorough follow-up is essential after minimally invasive ablation procedures, because unlike surgery, there is no histological proof confirming an R0-resection. Therefore, it is important to be aware of the regular imaging features of completely ablated tumors during the course of follow-up for appropriate detection of incomplete ablation and local tumor progression. Due to the wide acceptance and availability of computed tomography (CT) scanners, CT imaging is the standard tool for detecting liver lesions, for intervention planning, for the conduction of the procedure and finally to evaluate the success of the ablation. Shortly after IRE, a sharply demarcated hypoattenuating central ablation can be found, which involutes and sometimes even disappears after a few weeks (5). Several authors described a hyperintense rim enhancement around the treatment zone in the first days after intervention, dispersing in postacute examinations (2). Only very few studies investigated changes in the lesion's volume during follow-up after ablation. Dollinger et al. (6) reported a reduction in volume to 29% of the initial values, measured during the portal venous phase, after a mean period of 4.7 months. First animal experiments compared RFA and IRE lesions and found unspecific differences in the liver regeneration (7).
To confirm these preliminary results, our study aimed to assess the natural behavior of IRE lesions during follow-up. To set the results into a meaningful context, we furthermore compared the volumetric changes in IRE lesions with volumetric changes in RFA lesions during follow-up.
Go to : 
MATERIALS AND METHODS
The study was conducted under the approval of the Institutional Review Board. The research was conducted according to the Declaration of Helsinki. Patients gave written consent for image data analysis.
Study Design
We performed a retrospective single-center analysis to assess volumetric changes in ablation zones after IRE and RFA. Furthermore, we evaluated the influence of possible confounding factors regarding liver regeneration after IRE or RFA like age and sex of the patients as well as the history of platinum-based chemotherapy (PCT) applying dedicated regression analyses.
Patient Population
Only patients without local progression, who had undergone IRE of their liver tumor in our hospital during the last two years, were included in our study. Before treatment, liver surgery was considered but declined in all patients by an interdisciplinary tumor board. Nevertheless, all the patients met the following typical ablation criteria: a maximum of 3 tumors smaller than 3 cm or a single tumor smaller than 5 cm.
In consideration of these aspects, we included 19 IRE-patients (20 ablations; 11 males/8 females). The choice of ablation strategy, either IRE or RFA, was based on the location of the tumors to be treated. IRE was the preferred ablation method for tumors located near vulnerable structures (e.g., bowel, bile ducts, liver hilum, etc.). In less critical locations, RFA was preferred due to faster treatment time and lower cost. Primary tumors were mostly colorectal cancer (n = 8), breast cancer (n = 4), and hepatocellular carcinoma (n = 2). The mean age of the patients at the time of intervention was 63.3 ± 11.3 years (standard deviation [SD] 11.3). Details of patient's characteristics are listed in Table 1.
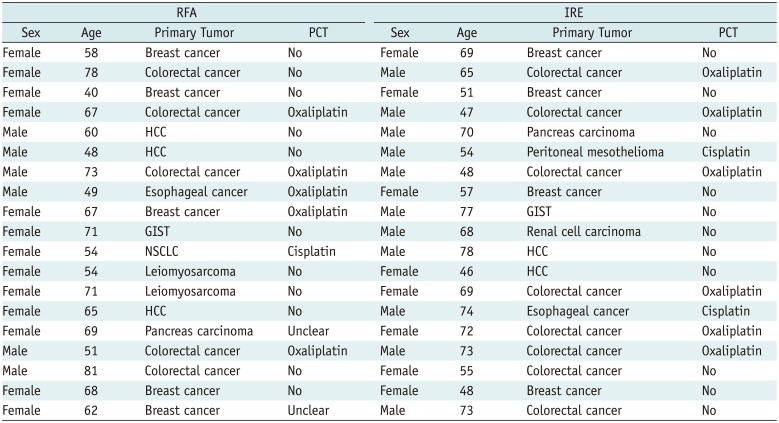
Table 1
Patient Cohort: Sex, Age at Time of Intervention, Primary Tumors and History of Received PCT of RFA and IRE Patients
![]()
We compared the IRE group with 19 patients (6 males and 13 females), treated with RFA for primary and secondary liver tumors in our hospital. Metastases originated most frequently from colorectal cancer (n = 5) and breast cancer (n = 5). Mean age of the patients at the time of intervention was 62.7 ± 12.1 years. Details of patient's characteristics are listed in Table 1.
Irreversible electroporation was performed using the NanoKnife system (Angiodynamics, Latham, NY, USA) with a variable number of probes as demanded by the tumor size. RFA was performed using the RF 3000 system (Boston Scientific, Marlborough, MA, USA) with LeVeen™ (Leveen™ Needle electrode; Boston Scientific) RF probes and umbrella sizes as demanded by the tumor size.
Imaging
Follow-up CT-scans were conducted at day 0 (t1), between day 1–7 (t2), day 8–55 (t3), and after day 55 (t4) subsequent to ablation as a standard multiphase contrast-enhanced CT scan (Somatom Definition Flash® and Somatom Definition AS®, Siemens Healthineers, Forchheim, Germany) including a unenhanced CT scan as well as CT scans after intravenous administration of iodine contrast agent in the arterial and the venous phase. The scans were acquired as routine follow-up with the following parameters: 210 mAs, 120 kVp, 5-mm collimation, and pitch of 1.0. For contrast-enhanced CT scans, a body weight adjusted amount of contrast agent (Ultravist 370, Bayer Vital GmbH, Leverkusen, Germany) was injected intravenously with a flow rate of 4 mL/s followed by a 30 mL saline chaser bolus. Scans were started with a 10 seconds delay for the arterial phase and 60 seconds delay for the venous phase using the bolus tracking method (threshold, 100 HU).
Lesion volumetry was calculated using the open source software 3D Slicer 4.3.1 (http://www.slicer.org/) (8). The lesions were manually marked in axial planes using image datasets reconstructed in 5-mm slice thickness and 4-mm increment. Thereafter, lesion's volumes were calculated. Measurements were performed by a radiologist with one year of experience in CT reading. Control and correction were performed by an attending physician with 8 years of experience in CT reading and evaluation of post-ablation imaging. The appearance of a rim enhancement surrounding the ablation zone was compared between the IRE and the RFA groups.
Statistics
Statistical Analysis System (SAS 9.4, SAS Institute Inc., Cary, NC, USA) was used for the analysis. All volumetric values were converted into percentage decrease of the volume relative to the starting volume at day 0. Means of the different groups (t1–t4) were compared and in the first step, Student's two-sided t test was used assuming unequal variances to evaluate the differences. We confirmed the results with statistical models for regression analysis. Subsequently, the used regression model was extended for investigating the influence of possible types of bias/confounders like sex and age on the analysis. The influences of PCT and treatment modality (IRE/RFA) were analyzed by means of dedicated multivariate regression analyses.
Go to :
RESULTS
Influence of Treatment on Ablation Volume
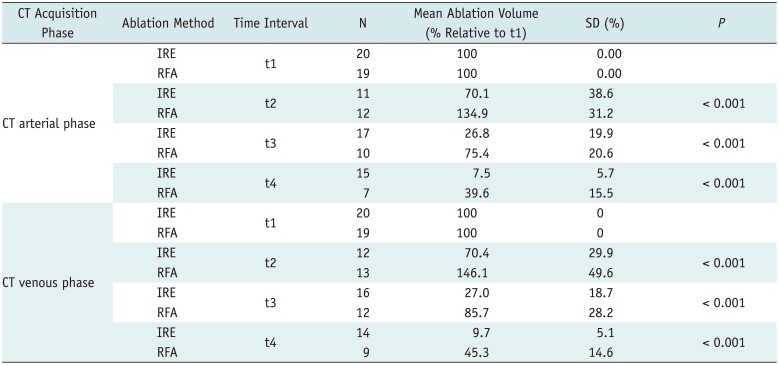
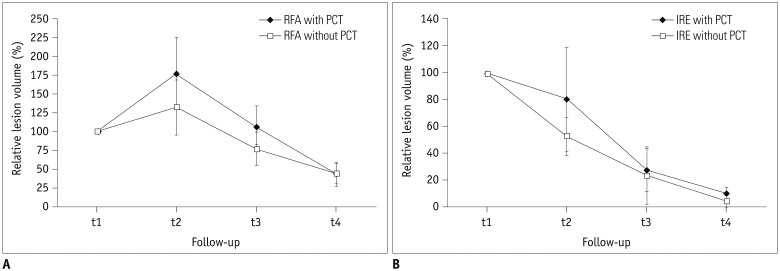
A total of 111 examinations in the arterial phase and 115 in the venous phase were included in the study because some examinations were only performed in the venous phase. The mean ablation volume at t1 was set as 100%. A significant difference between the relative volume changes in IRE and RFA lesions in all time intervals (t1–t4) was observed based on Student's t test assuming unequal variances. Detailed results are illustrated in Table 2 and Figure 1. At t2, mean lesion's volume was 134.9 ± 31.2% in the arterial phase and 146.1 ± 49.6% in the venous phase of their initial volume after RFA, whereas lesion volume was 70.1 ± 38.6% in the arterial phase and 70.4 ± 29.9% in the venous phase relative to the initial ablation volume in the IRE group. All lesion volumes decreased in the course of time and, at t4, the mean volume of RFA lesions was 39.6 ± 15.5% in the arterial phase and 45.3 ± 14.6% in the venous phase of their initial volume. Thereby RFA lesions remained significantly larger than the IRE lesions, which measured 7.5 ± 5.7% in the arterial phase and 9.7 ± 5.1% in the venous phase of their initial volume. In early follow-up (t1–t2), an increase in ablation volume was noted in the RFA group, whereas a decrease in the volume of the ablation zone was detected in the same time-period. In the later follow-up (t2–t4), the volume decrease was significantly more extensive in the IRE group compared to the RFA group, ultimately leading to a lesion volume of 9.7% of the initial volume in the IRE group compared to 45.3% in the RFA group.
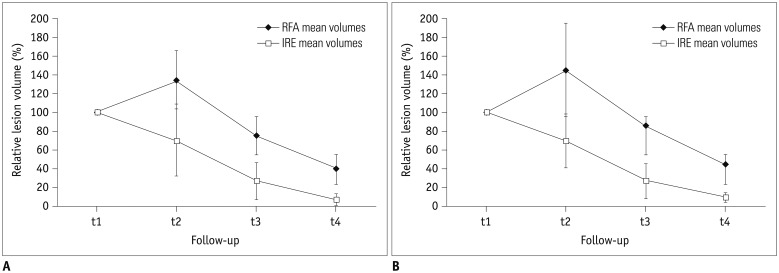 | Fig. 1Relative changes in ablation volumes after RFA and IRE based on CT datasets in arterial phase (A) and venous phase (B).t1 = day 0, t2 = day 1–7, t3 = day 8–55, t4 = after day 55. CT = computed tomography, IRE = irreversible electroporation, RFA = radiofrequency ablation
|
Table 2
Influence of Treatment Type (IRE vs. RFA) on Measured Ablation Volume in Follow-Up CT-Imaging
![]()
A multivariate regression model was fitted on the data and the ablation volume was modeled dependent on the time interval (t1–t4) and ablation modality, both the independent variables, the time interval (t1–t4) and ablation modality yielded p values < 0.001. The results are also displayed in Figure 1.
Influence of the Patient's Age and Sex on Ablation Volume
122 data sets of IRE patients and 106 data sets of RFA patients were included for studying the influence of the patient's age and sex on ablation volume. The ablation volume (dependent variable) was modeled dependent on both time interval (t1–t4), ablation modality, sex (first model) and time-interval (t1–t4), ablation modality and age (second model). Neither sex (p = 0.694) nor age (p = 0.570) were found to be significant in the multivariate regression model.
Rim Enhancement of Ablation Zone Lesions
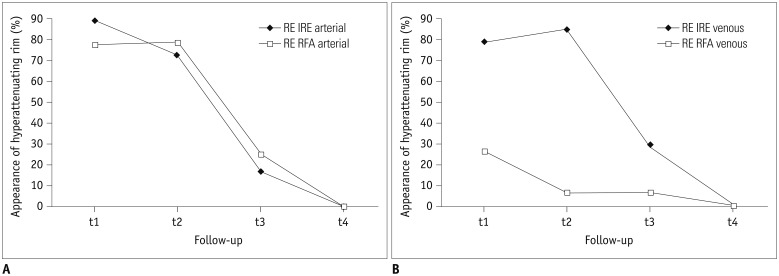
All the IRE and RFA data sets were analyzed for the presence of contrast-enhancement surrounding the ablation zone, i.e., rim enhancement. At t1, a rim enhancement was found in most of the lesions (89%/79% for IRE, 78%/26% for RFA in the arterial/the venous phase). The enhancement was persistent at t2 (73%/85% for IRE, 79%/7% for RFA in the arterial/the venous phase) and disappeared mostly at t3 (17%/28% for IRE, 25%/7% for RFA in the arterial/venous phase). At t4, no case of rim enhancement was observed both in the IRE group and the RFA group in the arterial and the venous contrast phase. Fisher's exact test showed no significant association between ablation mode and appearance of rim enhancement in the arterial phase for any time interval (pt1–pt4 > 0.05). After RFA, rim enhancement was rarely observed in the venous contrast phase, whereas it was detected significantly more often at t1 and t2 (pt1 = 0.003, pt2 < 0.001) in the IRE group of patients. The results are visualized in Figure 2.
Typical changes in the ablation areas during the course of follow-up after IRE and RFA are displayed in Figure 3.
 | Fig. 3Typical appearance of ablation zones in CT follow-up, venous phase.
A–C. Tumor treated with IRE. A. Imaging of lesion in patient with hepatic metastasis of breast cancer. B. Imaging of lesion on first day after treatment with IRE. Note substantial rim-like contrast enhancement. C. Imaging of lesion six months after IRE treatment. D–F. Tumor treated with RFA. D. Imaging of lesion in patient with hepatic metastasis of colorectal cancer. E. Imaging of lesion on first day after treatment with RFA. F. Imaging of lesion six months after RFA treatment. Arrows mark tumors in A, D and ablation zones in B, C, E, F.
|
Influence of Platinum-Based Chemotherapy on Ablation Volume
122 data sets of IRE patients and 97 data sets of RFA patients were included for analyzing the influence of PCT on ablation volume. In this section, the ablation volume (dependent variable) was modeled dependent on the time interval (t1–t4), ablation modality, and history of PCT as well as an interaction effect between PCT and time-interval (t1–t4). Neither history of PCT (p = 0.288) nor the interaction term (p = 0.126) were statistically significant. Removal of the history of PCT (the main effect), out of the regression model yielded a significant interaction term between RFA and chemotherapy (p = 0.004), whereas the interaction term between IRE and chemotherapy was not statistically significant (p = 0.288). The results are illustrated in Figure 4.
Go to :
DISCUSSION
Irreversible electroporation is a new, promising ablation technique with several advantages compared to hyperthermal ablation technique (910111213). Due to the non-thermal effect of tumor destruction, IRE is not susceptible to the heat-sink-effect near large vessels. In all the percutaneous tumor therapies, imaging follow-up is essential to confirm complete ablation and rule out local tumor progression. Typical features of local tumor progression in RFA or MWA include an increase in ablation zone size and/or peripheral focal enhancement in the course of follow-up after treatment. Therefore changes in the ablation volume of ablative lesions as well as their contrast-enhancement features are important to be considered when evaluating follow-up imaging after tumor ablation. In radiologic-pathologic studies, heterogeneous findings after IRE were described regarding the appearance of the ablation zone (214). So far, none of the reported studies have demonstrated mid- and long-term CT volumetric results after IRE in humans. Initially, Rubinsky et al. (4) found the rapid resolution of the lesions without any quantization. Dollinger et al. (6) measured a mean volume reduction to 29% of the initial value after 4.7 months in portal venous phase CT. To date, only experimental data by Li et al. (7) provided a prospective comparison of the evolution of RFA and IRE ablation zones in a swine model. In order to evaluate the volume changes in ablation zones following hepatic IRE, we compared the respective ablation volumes to volumes after RFA in the same time interval after the procedure.
In RFA, a typical volume reduction of 12–24% after 2–4 weeks of ablation and of 50% after 4 months is described in the literature (15161718). Our results confirmed these findings: the reduction was 15–25% after 8–55 days and 40–45% of the initial lesion after day 55 in the RFA group. Interestingly, our results show an initial increase in the RFA lesion's size after day 1–7 (135–146%) (Fig. 1), corresponding to the well-known edematous reaction after RFA (1920). Compared to RFA-lesions, volume reduction in IRE-lesions after ablation was significantly higher. Furthermore, IRE lesions remained significantly smaller after day 55. On an average, during the first seven days after ablation, a decrease in the lesion volume from 100% to 70% was observed and it further decreased to 7–9% of the initial volume after day 55. Compared to RFA, the relative decrease in the lesion size was higher in the chronic phase as well, which could be explained by the type of cell death induced by IRE compared to RFA. In RFA, areas of coagulation necrosis transform into fibrotic scars (19212223), whereas several studies demonstrated that major cause of cell death after IRE is apoptosis (224). After apoptosis, phagocytes remove dead cells without any inflammatory response and without leaving a fibrotic scar. Since extracellular structures are spared in IRE, the remaining interstitial matrix facilitates repopulation with hepatocytes (25).
A significant effect of PCT in the history of the patients on lesion volume after RFA could be observed in the regression analysis. There was a clear association between the relative decrease of lesion size and history of prior PCT in general. After hepatotoxic chemotherapy, hepatocytes are damaged by intracellular oxidative stress, which leads to impairment in energetic metabolism and membrane rigidification (26). Thereby previously damaged hepatocytes are unable to recover similarly to undamaged cells after RFA. Nevertheless, there was no significant influence of PCT on ablation zones after IRE, which could also be explained based on apoptotic cell death and therewith different regenerative processes (25). In a variety of ways, apoptotic cells avoid interaction with the surrounding tissue (27). Neighboring cells, whether damaged by PCT or not, are therefore not essentially involved in the process of remodeling. Multivariate regression analysis did not reveal any influence of patient's age or sex on the ablation zone volumes.
For both RFA and IRE, a hyperintense rim enhancement on contrast-enhanced CT scans after intervention showing a hyperemic tissue reaction is well known (21728). We could confirm these findings in our present study; most of the RFA and IRE patients developed a hyperattenuating rim-like area in the early follow-up. At t1, a rim-like enhancement was observed in 78% of RFA lesions and 89% of IRE lesions. No difference was observed between the IRE group and RFA group concerning the appearance of a rim-like enhancement in the arterial phase (p > 0.05). Interestingly, the peripheral rim enhancement was rarely seen in the venous phase after RFA at t1 (26%). On the contrary, in the IRE group, rim-enhancement was detected in 79% of cases in the venous phase at t1 and in 85% of cases at t2.
We could detect a significant correlation between ablation mode and appearance of the rim enhancement for early follow-up CT scans in the venous phase (t1, p = 0.003; t2, p < 0.001). Especially in the arterial phase, the appearance of the rim enhancement was comparable after IRE and RFA, most likely representing a nonspecific tissue reaction-irrespectively of the ablation modality. Differences in the regenerative process of IRE and RFA seem to be reflected in the difference of rim-like hyperperfusion in the venous phase in the early follow-up (t1–t2).
Our study had several limitations: Since IRE is a comparatively new ablation modality; we depended on a rather small number of rather heterogeneous patients with different primary tumors. Due to the organizational reasons, some patients could not meet the preset follow-up scheme so a few follow-up examinations were changed or canceled; others could not be included in the chemotherapy analysis because of unclear chemotherapy in their patient's history. The process of cell death, as well as regenerative processes after IRE, is not yet completely understood. Therefore, further studies need to be performed to correlate image features with histological changes to properly attribute these features.
As the present study was a retrospective clinical study, patients were not enrolled for RFA or IRE in a randomized fashion but assigned to IRE when tumors were close to structures at risk, e.g., bile ducts, portal vein or bowel. Therefore a selection bias may attribute to the results. Nevertheless, not total ablation volumes but relative changes in the ablation volumes were exploited. Hence, we cannot assume the local factors in the liver that could influence these relative changes.
In order to confirm our results, multicenter trials would be desirable to reevaluate the changes in the volumes of the ablation zones after IRE in a larger patient cohort.
In conclusion, the decrease in the lesion volume was significantly more rapid and more profound in patients treated with IRE at all analyzed time intervals compared to RFA. Furthermore, a significant increase in the ablation zone in early follow-up (t1–t2) after RFA could be observed, which was not the case for IRE.
A significant influence of prior PCT on lesion's volume reduction after RFA was observed. This correlation was not detected in the patient group treated with IRE.
Rim enhancement occurred frequently after both RFA and IRE in the early follow-up after treatment. In the early follow-up, rim enhancement was persistent in the venous phase in IRE, which was not the case for RFA.
Go to :
 XML Download