

 PDF
PDF ePub
ePub Citation
 Print
Print


INTRODUCTION
Preparation of implant sites affects the primary stability of implants that is necessary for a proper and long-lasting osseointegration. Using a bone site preparation technique for dental implant placement could lead to the best primary implant stability possible. Indeed, a good primary stability allows smaller micromotions between implant and bone1 and therefore enables optimal condition for implant osseointegration; on the contrary, low values of primary stability could lead to fibrointegration and early implant failure.
Different methods to monitor the stability of an implant and various techniques to prepare the implant placement site have been described.2 The right choice could increase the primary stability, particularly in low-density bone. Friberg et al.3 recommended the use of undersized drilling (the drill having a smaller diameter than that of the implant) to optimize bone density and consequently implant stability. In a recent systematic review of the literature, evidences on biomechanical, biologic, and clinical outcomes of undersized surgical preparation protocols in dental implant surgery were discussed and it was concluded that, from a biomechanical standpoint, an undersized drilling protocol is effective in increasing insertion torque in low-density bone.4 Regarding the biologic response, healing after undersized implant placement is comparable to that occurring in the non-undersized surgical drilling protocol over the long-term. Finally, performing an undersized drilling protocol on low-density bone is a clinically safe procedure.4 Indeed, it is well known that the undersized surgical technique not only results in higher primary implant stability, but also produces more translocated bone particles, thus having a positive influence on the osteogenic response.5 The choice of an adapted surgical approach, by undersizing the implant bed preparation in poor bone sites, has shown better osseointegration and greater implant stability in animal studies.6789
Previous studies101112 have been conducted by our group to validate the use of an instantaneous torque measuring implant motor. A study on bovine ribs by Iezzi et al.11 showed that the average torque (Cm), measured when a special probe was screwed into the implant site at an intermediate step of the site preparation, i.e. when its diameter could still be adapted by the surgeon to accommodate the implant, correlated significantly with the histomorphometric bone density. These findings indicated that the Cm parameter could be a reliable measure of bone density. Subsequently, a study on polyurethane foam blocks having different density and simulating the range of density of the maxillae provided consistent results; a significant linear correlation was observed between the Cm parameter and the density of blocks, and Cm-density calibration curves could be calculated.12 The above-mentioned results were also in agreement with those achieved in the clinical setting on 3704 subjects by 39 different operators, showing that bone density measurements were operator-independent10 and that the system could effectively discriminate among four areas in the maxillae having different bone densities. Therefore, the specific bone density measurement system may be used as an intra-operative diagnostic system. As those density measurements are performed at an intermediate step of the implant site preparation, the oral surgeon can still change the site preparation protocol according to the registered density in order to enhance the implant primary stability (for example, choosing to undersize the site etc.), and therefore adapt the implant site preparation protocol to the specific bone quality. Degidi et al.13 recommended assessing primary stability by calculating the integral of the torque-time curve at implant insertion, defined as Variable Torque Work (VTW) or Insertion Energy (IE), i.e. the total energy required for placing the fixture. They also showed on bovine ribs that VTW could better detect those cases where sufficient primary stability could be achieved even in softer bone.13 Our group showed that the Integral (I) of the torque-depth curve measured at implant placement by the implant motor significantly correlated with the bone-to-implant contact (BIC).14 Results of this work were also consistent with those achieved in the clinical setting by Capparé,15 who showed that the integral correlated significantly with the BIC of undersized implants retrieved fifteen minutes after insertion. The integral has also been shown to be effective in measuring primary stability at implant insertion and to be more sensitive to bone density variations than the insertion torque (IT) and the implant stability quotient (ISQ) in an in vitro study on polyurethane foam blocks.16 Indeed, I and IE are dynamic parameters and they register changes in the bone density and therefore in the resistance along the implant tunnel. 161718 In this context, further characterization of the properties of these dynamic parameters as primary stability measures is desirable. It is yet not known whether the integral may convey reliable information about BIC at insertion, which is the bone-to-implant contact area immediately after implant placement, in implant sites that have been undersized or tapped. Reliable information could aid clinicians in the choice of the implant site preparation protocol to achieve the best primary stability possible; this, in turn, might allow better detection of early- or immediate-loading prosthetic rehabilitation cases and reduced risk of prosthetic failure.
The aim of the present investigation was to achieve a better understanding of the relation among BIC, bone density, and implant primary stability when measured using the Integral (I), even when implant sites were undersized or tapped. The null hypothesis of this study was that the integral cannot allow changes in primary stability and BIC when implant sites are prepared according to a standard protocol, tapped or undersized.
MATERIALS AND METHODS
This in vitro study was performed at the Implant Retrieval Center of the Department of Medical, Oral and Biotechnological Sciences of the University of Chieti-Pescara, Chieti, Italy.
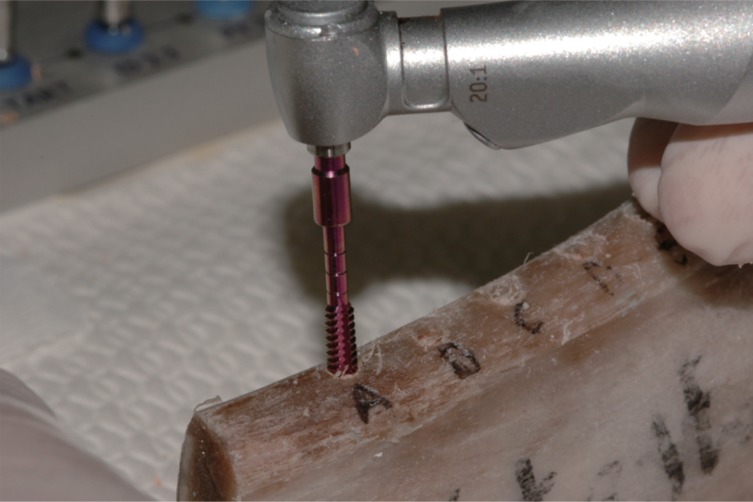
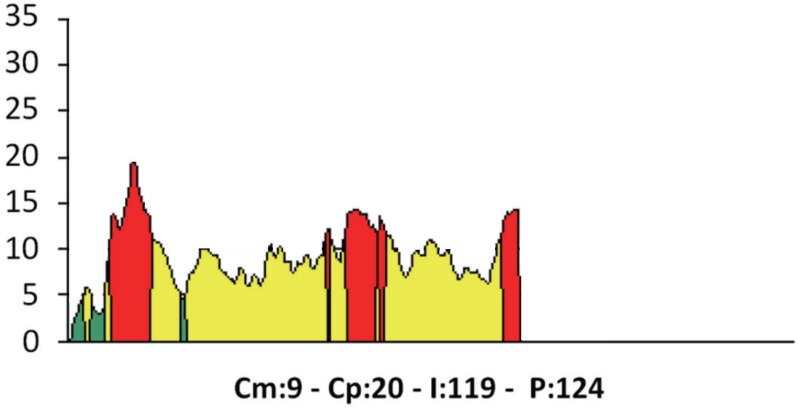
Nine segments of bovine ribs were used. The periosteum was removed from all bone segments, and the samples were regularized using a diamond saw (Precise 1 Automated, Assing, Rome, Italy).19 The surgical procedures were undertaken by experienced operators (DDS and PA) using the manufacturer's drills. A total of 40 bone implant sites were prepared. A computerized implant motor (TMM2, IDI Evolution, Concorezzo, Milano, Italy) was used for the intra-operative analysis of bone density of the different osseous sites. The measurements were done using a special 2 mm wide reading drill, featuring equal 3 mm-spaced threads shaped as a 1-degree reverse cone (patented). Briefly, the procedure was as follows. A definition of the insertion depth and direction of the perforations was done. A first pilot drill having a diameter of 2.2 mm was used for the perforation of the cortical bone, and then a second triflute drill with a diameter of 2.3 mm was used for bone site preparation up to a depth of 12 mm. Then the cortex of the upper portion of the bone specimens was removed using a 3.0 mm reamer drill. The implant motor was switched into its “read mode” and the special reading drill, rotating at a preset speed (35 rpm), was used to evaluate the bone density1112 of the bone site up to the pre-drilled depth (Fig. 1). The measurements were displayed both as numbers and as graphs (Fig. 2). The surgical motor was used to make the following evaluations:
Cm (average torque) (Ncm): the average torque of the resistance in function of depth, i.e. the parameter measuring bone density1112;
Cp (peak torque) (Ncm): the point of highest resistance in function of depth (i.e., the maximum torque measured along the bone tunnel);
I (Ncm2/100): the integral of the function resistance/depth (i.e., the area bounded by the resistance/depth function graph);
P: depth measured as tenths of a millimeter;
Graph of the instantaneous torque (ordinate)/depth (abscissa);
N: sequence numbers of the different measurements.
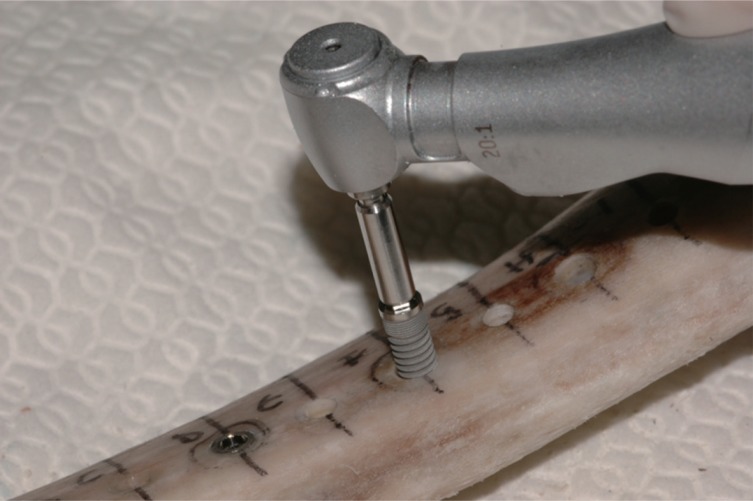
These measurements were performed for each implant site. Site preparation was as follows: for undersized sites (14 sites), a 3.0 mm-diameter twist drill was used; standard-prepared sites (13 sites) were prepared according to the manufacturer's instructions using a 3.2 mm-diameter twist drill; tapped sites (13 sites) were prepared using a 3.2 mm-diameter twist drill followed by a 3.6 mm bone tap. In all cases, a 4.0 mm countersink drill was used to finalize the sites. Twist and countersink drills were made of surgical stainless steel, while tapping drills were made of titanium. All drills used in the present study had a polished surface. A total of 40 dental implants (Stone, IDI Evolution, 3.75 × 12 mm), having their surface roughened by double acid etching, were then inserted in each of the different prepared sites (Fig. 3). The Cm, Cp, I, P parameters were recorded again during the insertion using the computerized implant motor.
After implant placement, the bone specimens were immersed in 10% buffered formalin and processed to obtain thin ground sections with the Precise 1 Automated System (Assing, Rome, Italy).19 They were dehydrated in an ascending series of alcohol rinses and embedded in a glycolmethacrylate resin (LR White, London Resin, Berkshire, UK). After polymerization, the specimens were sectioned with a high-precision diamond disc at about 150 microns and ground down to about 30 microns. Then, the slides were stained with acid fuchsine and toluidine blue. Histologic and histomorphometric analyses were performed under a light microscope (Laborlux S, Leitz, Wetzlar, Germany), connected to a high-resolution video camera (3CCD, JVC KYF55B, JVCs, Milan, Italy), and interfaced with a monitor and PC (Intel Pentium III 1200 MMX, Intels, Santa Clara, CA, USA). A digitizing pad was connected with this optical system (Matrix Vision GmbH, Oppenweiler, Germany) with a histomorphometry software package furnished with image capturing capabilities (Image-Pro Plus 4.5, Media Cybernetics Inc., Immagini & Computer Snc, Milano, Italy). Histomorphometric evaluation of the BIC percentages was performed for all implants.
Data were reported as mean ± standard deviation (SD). The three groups of data were first checked for homogeneity of the bone density (Cm) by means of a one-way ANOVA test. As the three means were found to be homogenous (P = .92, see also results section), one-way ANOVA tests were performed to investigate whether the histomorphometric measurements of BIC and the I values recorded by the implant motor at implant placement were, on average, different among the three groups. If this were the case, ad-hoc Holm-Bonferroni tests were performed to assess which of the couples of parameters were or were not significantly different. In order to investigate the dependence of BIC and I from bone density (Cm), the best-fitting lines correlating BIC and I to Cm and the corresponding Pearson correlation coefficients (r values) were calculated by means of linear regression analysis. Best-fitting lines were forced to pass through the axis origin under the rationale that both BIC and I were expected to be null if bone density was null. In order to compare the dependence of BIC and the I from density under the different implant site preparation conditions, slopes of the best-fitting curves were compared through ANCOVA tests.20 If slopes were found to be significantly different, their percent difference was calculated using the formula ((Slope 2 − Slope 1) / Slope 1) ×100, and the corresponding standard deviation was calculated using the formula of propagation of errors.21 Finally, the correlation between BIC and I was investigated calculating the Pearson r correlation coefficient between these two variables for each of the three types of site preparation. Correlations and statistical comparisons were considered significant when P < .05.
RESULTS
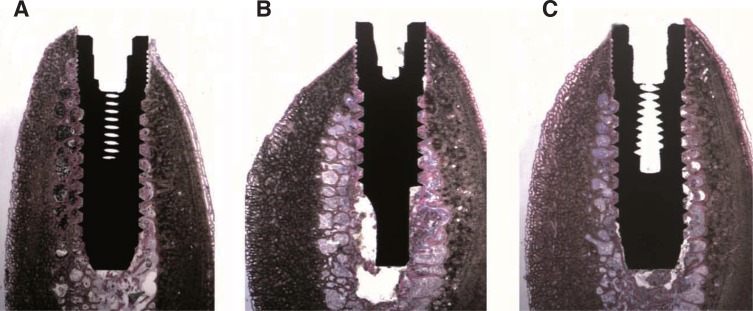
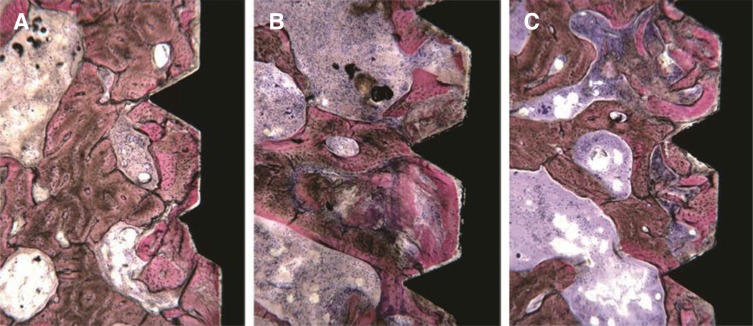
At low magnification, in the undersized sites, bone tissue and bone chips surrounding most of the implant surface could be observed; thin bone trabeculae in close proximity with the implant surface were evident only in the areas where the cancellous bone was present. In the standard preparation, small bone trabeculae surrounding the implant surface could be seen. In the tapped sites, small bone trabeculae and bone chips surrounding the implant surface could be detected (Fig. 4).
At high power in the undersized sites, bone tissue in contact with the implant surface was present. In most of the cases, the bone structure seemed not impaired, but in some fields small crushed bone chips (small fractured bone trabeculae) were evident. In the standard preparation, the implant was in contact with small bone trabeculae, which were not impaired in some fields, while in other they appeared slightly deformed and followed the implant concavities. In some fields, bone chips could be seen near the implant threads. In the tapped sites, a greater amount of bone chips pushed by the preparation close to the implant surface could be observed. Only in some fields, the implant surface was in contact to intact bone trabeculae (Fig. 5).
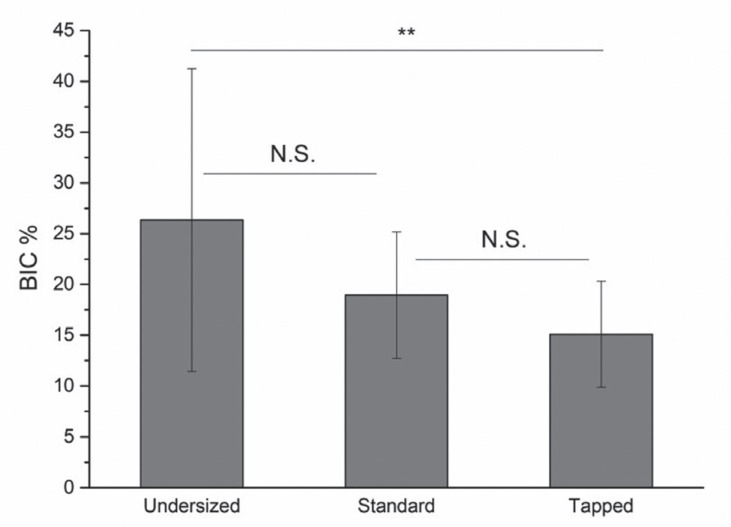
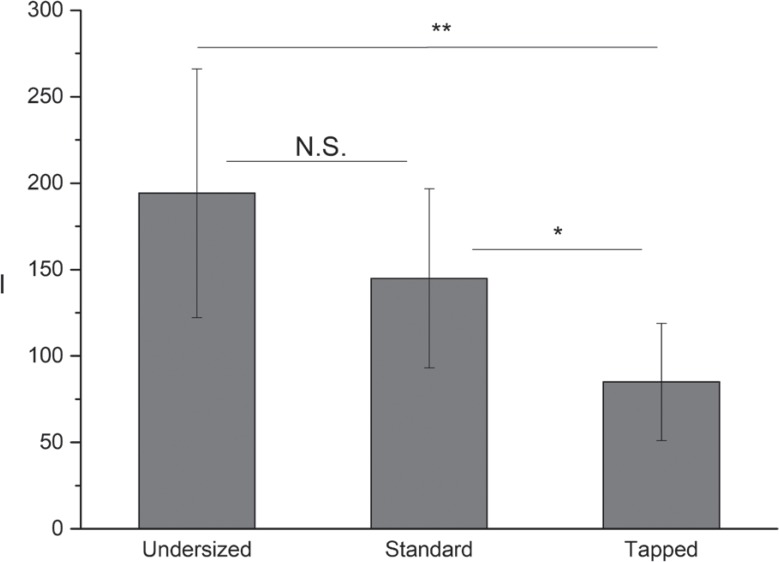
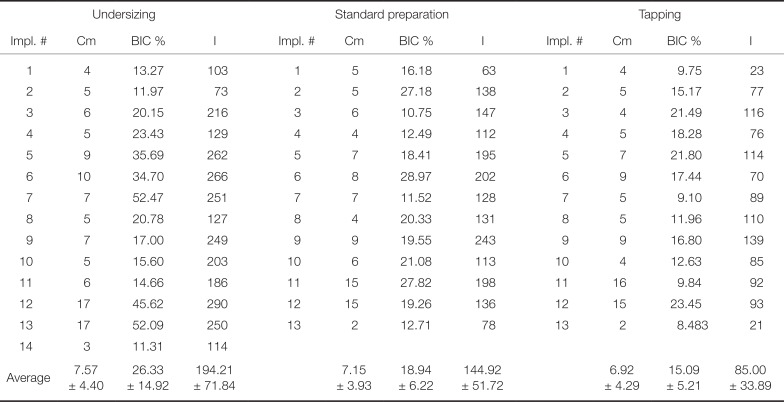
Histomorphometric BIC measurements and the corresponding Cm and I values are reported in Table 1. ANOVA tests showed that the three groups of data were homogenous as far as bone density, measured by the Cm parameter, was concerned (P = .92); the three Cm values being 7.57 ± 4.39 Ncm; 7.15 ± 3.93 Ncm; and 6.92 ± 4.29 Ncm for the undersized, standard, and tapped sites, respectively. ANOVA tests showed that both BIC and I values were significantly different under the three site preparation conditions (Fig. 6 and Fig. 7, P = .02 and P < .001, respectively).
Concerning BIC, post-hoc Holm-Bonferroni tests showed that while the BIC corresponding to undersized sites was significantly greater than that corresponding to tapped ones (P = .01), it was not significantly different from that corresponding to standard prepared sites (P = .15), and that the BIC corresponding to standard prepared sites was not significantly higher than that corresponding to those being tapped (P = .59).
The I value corresponding to the undersized sites was significantly greater than that corresponding to the standard ones (P < .001) and greater than that corresponding to sites undergoing tapping (P = .03). The I corresponding to sites undergoing standard preparation was significantly greater than that of sites being tapped (P = .02).
Under all conditions, i.e. undersizing, standard preparation, or tapping, linear regression analysis showed a high degree of correlation between BIC and bone density (r = 0.949, r = 0.894, r = 0.848, respectively). Equations of the lines that best fit the experimental points (Fig. 8), achieved by regression analysis, were as follows: undersizing (squares), BIC = (3.29 ± 0.29) Cm; standard preparation (circles), BIC = (2.21 ± 0.30) Cm; tapping (triangles), BIC = (1.70 ± 0.29) Cm. The three lines showed different slopes. The covariance analysis showed that the slopes of the lines corresponding to standard preparation and tapping were not significantly different from each other (P = .23), while both were significantly different from that corresponding to undersizing (P = .02 and P = .001, respectively). The slope of the line corresponding to undersizing was 48.8 ± 24.1% greater than that corresponding to standard preparation, i.e. for a unitary increase of bone density, the BIC increase observed was on average 48.8% greater when the sites were undersized than when they were conventionally prepared. On the other hand, the increases in BIC observed, for a unitary increase in bone density, were not significantly different when switching from tapping to standard preparation. The three lines could be seen as the motor calibration curves, for the system under investigation (bovine ribs, cylindrical implants), providing the expected BIC as a function of the bone density measured preoperatively at the implantation site.
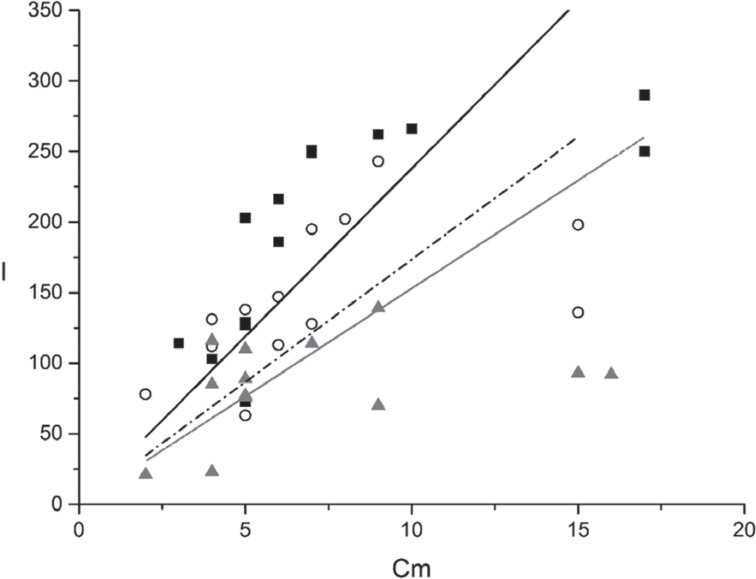
Under all conditions, linear regression analysis showed a high degree of correlation also between I and Cm, the Pearson's r coefficient being r = 0.933, r = 0.911, and r = 0.854 for undersizing, standard preparation, and tapping, respectively. Equation of the lines that best fit the experimental points (Fig. 9) were as follows: undersizing (squares), I = (22.32 ± 2.26) Cm; standard preparation (circles), I = (17.35 ± 2.19) Cm; tapping (triangles), I = (9.77 ± 1.64) Cm. The three lines showed different slopes. The covariance analysis showed the slopes of the lines corresponding to standard preparation and tapping were not significantly different from each other (P = .21), while both were significantly different from that corresponding to undersizing (P = .005 and P = .001, respectively). The slope of the line corresponding to undersizing was 28.6 ± 21.8% greater than that of the line corresponding to standard preparation, i.e. for a unitary increase of bone density, the average I increase for undersized sites was 28.6% greater than that observed when sites where conventionally prepared, while the increases in I observed for a unitary increase in bone density were not significantly different when switching from tapping to standard preparation.
Correlation analysis between BIC and I showed that the two quantities had a high degree of correlation under all the three investigated conditions, the correlation coefficients being r = 0.938, r = 0.943, and r = 0.938 for undersizing, standard preparation, and tapping, respectively.
DISCUSSION
Results of the present study showed a significant linear correlation between the I and BIC immediately after implant insertion, supporting the previous studies by Iezzi14 and by Capparé,15 i.e. that the I measured by the micromotor is a site-specific intraoperative measurement of BIC during implant insertion. Further, they showed that a significant linear correlation could be observed also when implant sites were undersized or tapped, i.e. that the I could be used as a site-specific intraoperative measurement of BIC during implant insertion even in these two conditions. All those evidences1415 supported the use of the torque-measuring implant motor as a reliable aid to measure BIC at implant placement in all the possible site preparation conditions.
Average BIC did not vary significantly either between tapped and standard-prepared sites, or between standard-prepared and undersized sites. The difference was found to be significant only when comparing the average BIC of implants placed into undersized sites to that of implants inserted into the tapped ones. Additionally, when a site was tapped, rather than standard-prepared, BIC was not expected to vary significantly, as the diameter of the tunnel being drilled did not change significantly and the reamer created only a better lodging for the implant threads.
On the other hand, it should be remembered that BIC and I have two different physical meanings; while BIC quantifies the bone-to-implant contact, I measures the total energy exchanged between the implant and the surrounding bone at implant placement. This energy dissipates in two ways, a) as the friction between the implant and the bone while the implant screws into the site, and b) as elastic and non-elastic deformations of bone while it accommodates the implant itself. If bone density increases, both BIC and the energy needed to place the implant into its final position are expected to increase. The two quantities are, therefore, correlated as confirmed by the results of the present study. Yet, as they have two different physical meanings, different site preparations may affect them differently. Differences in site preparation may have a greater effect on the energy exchange than on BIC, as they will make the implant cause a different degree of friction and bone deformation (i.e. of elastic and non-elastic energy exchanges) during placement. When a site is standard-prepared, rather than tapped, implant threads will exert more friction and force, leading to local bone deformation on the surrounding bone. Again, when a site is undersized rather than standard-prepared, friction and deformation, and consequently the energy needed to place the implant into its final position, will increase significantly. This might explain why, different from the average BIC, the average I was found to increase significantly when the preparation was changed from tapping to standard preparation, and from standard preparation to undersizing. Similar considerations may clarify why undersizing caused a smaller increase in the slope of the I-Cm than that observed in the BIC-Cm line (28.6% vs. 48.8%). While the friction between the site walls and the implant is expected to be directly correlated with bone density, elastic and non-elastic bone deformations are not; accordingly, the I value might be less sensitive to density variations than BIC, and the I-Cm slopes be consequently smaller than those of the BIC-Cm lines.
The absence of any difference in the slope of the I-Cm and BIC-Cm curves when the implant sites were tapped instead of standard preparation is consistent with the previous data. Changes in bone density are not expected to affect average BIC in a significantly different way when sites are tapped or standard-prepared. However, a change in bone density may cause a greater effect on BIC when sites are undersized as local compression may induce local bone collapsing around the implant and a consequent BIC increase. In undersized sites, the energy needed to place an implant is greater than in standard prepared or tapped sites; this may explain the differences in the I, which is a function of resistance/depth, between undersized vs standard and tapped, the latter showing closer results.
In the whole, our observations suggest that the I may convey information on primary implant stability, as I also measures the dynamic exchange of energy between the implant and the surrounding bone during implant placement. These observations are consistent with the previous findings showing that the Insertion Energy (i.e. (I)) could better detect those cases where sufficient primary stability can be achieved even in softer bone13 and that the Insertion Energy might also be a better aid than RFA or IT measurements to detect primary stability enhancement provided by underpreparation.18
Moreover, the present study shows that linearity between the I and bone density holds even if the implants sites are undersized or tapped. Accordingly, it can be hypothesized that a rational relation could be found between the extent and modality of undersizing and the corresponding increase of I and of primary stability. Such relation might provide a pivotal support to the oral surgeon when placing implants, as it might allow estimation of the extent of undersizing needed to maximize primary stability. This would, in turn, be of aid to plan and safely perform the immediate or early loading of the dental prosthesis. Further studies should be granted to further investigate this relation, which should also rely on in-depth analysis of how torque-depth diagrams, collected at insertion, change when undersizing and tapping are carried out. It is reasonable to expect that tapping the first cortical layer would change, according to the actual volumetric ratio between cancellous and cortical bone, as well as density of cancellous one, when the maximum torque at insertion is measured. In general, current studies concerning dynamic energy exchange between the implant and the surrounding bone have still not taken into consideration the shape of the torque-time or torque-depth plot; this should definitively be the subject of further studies.
Even if the results of the present study suggested that such a relation existed, they could not be generalized to all implant systems as different implant shapes (cylindrical, conical) and thread designs might have a different effect on the BIC-Cm and I-Cm relations. Primary implant stability and BIC are also known to depend on the implant surface roughness;2223 accordingly, implants with different surface texture and roughness might also have a different effect on the BIC-Cm and I-Cm relations. No studies have been carried out, to the best authors' knowledge, on the effect of the drills' surface on implant stability. This should be the subject of further studies. Moreover, the bone model used in the present study, i.e. bovine ribs, may not fully duplicate all the mechanical properties and anatomic features (cortical thickness and cancellous bone density) of the human maxillae. Finally, results of the present study showed that the used instantaneous torque measuring micro motor provided results that are consistent with previous observations, indicating that it is a reliable measuring instrument to be used to perform further investigations.
CONCLUSION
Measuring the I at implant insertion provided reliable information about the immediate BIC and implant primary stability even if tapping or undersizing are carried out. The linear relations found between the parameters under investigation suggested that a rational relation could be found between the extent and modality of undersizing and the corresponding increase of the I and, consequently, of primary stability. This piece of information may help the surgeon determine the extent of undersizing needed to achieve the proper implant primary stability, according to the planned loading protocol. Further studies should be performed to investigate how different implant designs may affect the relation between bone density, BIC, and I, even on different bone models.

 XML Download