Abstract
Purpose
This study was performed to investigate the epidemiological trend of rotavirus acute gastroenteritis (RV-AGE) in children. Methods: A retrospective review was performed in patients (1 month to 18 years of age) with acute gastroenteritis at KEPCO Medical Center from September 2004 to August 2013. Comparative analyses were performed based on periods: pre-vaccine (2004-2006) and post-vaccine (2008-2012) in all patients; 2004–2006 (period A), 2007–2009 (period B) and 2010–2012 (period C) in patients under 5 years of age. Results: Proportion of RV-AGE decreased from 25.0% (337/1,346) in pre-vaccine period to 20.8% (459/2,210) in post- vaccine period (rate ratio (RR), 0.83 [95% CI, 0.73–0.93]; P=0.0029). The median age of patients with RV-AGE in post- vaccine period (2.6 years) was significantly (P<0.0001) higher than that in pre-vaccine period (1.6 years). In patients hos-pitalized with AGE, proportion of RV-AGE was significantly reduced in patients 6 to 23 months old (RR, 0.62 [95% CI, 0.51–0.75]; P<0.0001). Significant decline in proportion of RV-AGE was observed in patients under 5 years of age: period A, 26.9% (308/1,144); period B, 22.7% (295/1,299); period C, 20.6% (186/902) (P=0.0007). After the introduction of rotavirus vaccine, a significant decreasing trend of RV-AGE proportion was observed in patients 6 to 11 months old (P=0.0018) and 12 to 23 months old (P=0.0152). Conclusion: Decrease in RV-AGE proportion and increase in age of patients with RV-AGE were observed after the intro-duction of rotavirus vaccine in this single center study. Continued and systematic surveillance is needed to assess the impact of rotavirus vaccine.
Go to : 
References
1. World Health Organization. Vaccines and diseases, Rotaviruses. Available at. http://www.who.int/immunization/diseases/rotavirus/en/[accessed. on 11 Jun 2014].
2. Kim JS, Kang JO, Cho SC, Jang YT, Min SA, Park TH, et al. Epidemiological profile of rotavirus infection in the Republic of Korea: results from prospective surveillance in the Jeongeub District, 1 July 2002 through 30 June 2004. J Infect Dis. 2005; 192(Suppl 1):S49–56.

3. Kawai K, O'Brien MA, Goveia MG, Mast TC, El Khoury AC. Burden of rotavirus gastroenteritis and distribution of rotavirus strains in Asia: a systematic review. Vaccine. 2012; 30:1244–54.

4. World Health Organization. Meeting of the Strategic Advisory Group of Experts on immunization, October 2009 – conclusions and recommendations. Weekly epidemiological record. 2009; 84:517–32.
5. The Korean Pediatric Society. [Rotavirus Vaccine]. Lee HJ, editor. Immunization Guideline. 7th ed.Seoul: The Korean Pediatric Society;2006. p. 184–94.
6. Korea Centers for Disease Control and Prevention. National immunization survey in South Korea, 2013. Public Health Weekly Report. 2014; 7:449–54.
7. Leshem E, Moritz RE, Curns AT, Zhou F, Tate JE, Lopman BA, et al. Rotavirus vaccines and health care utilization for diarrhea in the united states (2007–2011). Pediatrics. 2014; 134:15–23.

8. Tate JE, Haynes A, Payne DC, Cortese MM, Lopman BA, Patel MM, et al. Trends in national rotavirus activity before and after introduction of rotavirus vaccine into the national immunization program in the United States, 2000 to 2012. Pediatr Infect Dis J. 2013; 32:741–4.

9. Payne DC, Vinje J, Szilagyi PG, Edwards KM, Staat MA, Weinberg GA, et al. Norovirus and medically attended gastroenteritis in U.S. children. N Engl J Med. 2013; 368:1121–30.

10. Tate JE, Panozzo CA, Payne DC, Patel MM, Cortese MM, Fowlkes AL, et al. Decline and change in seasonality of US rotavirus activity after the introduction of rotavirus vaccine. Pediatrics. 2009; 124:465–71.

11. Parez N, Giaquinto C, Du Roure C, Martinon-Torres F, Spoulou V, Van Damme P, et al. Rotavirus vaccination in Europe: drivers and barriers. Lancet Infect Dis. 2014; 14:416–25.

12. Gastanaduy PA, Curns AT, Parashar UD, Lopman BA. Gastroenteritis hospitalizations in older children and adults in the United States before and after implementation of infant rotavirus vaccination. JAMA. 2013; 310:851–3.

13. Anderson EJ, Shippee DB, Weinrobe MH, Davila MD, Katz BZ, Reddy S, et al. Indirect protection of adults from rotavirus by pediatric rotavirus vaccination. Clin Infect Dis. 2013; 56:755–60.

14. Lopman BA, Curns AT, Yen C, Parashar UD. Infant rotavirus vaccination may provide indirect protection to older children and adults in the United States. J Infect Dis. 2011; 204:980–6.

15. Korea Centers for Disease Control and Prevention. Mole cular epidemiology of group A rotavirus infection in the Republic of Korea. Public Health Weekly Report. 2013; 6:228–233.
16. Korea Centers for Disease Control and Prevention. Molecular epidemiology of group A rotavirus infection in Korea. Public Health Weekly Report. 2008; 1:325–8.
17. Korea Centers for Disease Control and Prevention. Available at. http://www.cdc.go.kr/CDC/info/CdcKrInfo0503.jsp?menuIds=HOME001-MNU1175-MNU0048-MNU0051. [accessed on 11 Jun 2014].
18. Choi UY, Lee SY, Ma SH, Jang YT, Kim JY, Kim HM, et al. Epidemiological changes in rotavirus gastroenteritis in children under 5 years of age after the introduction of rotavirus vaccines in Korea. Eur J Pediatr. 2013; 172:947–52.
19. Centers for Disease Control and Prevention. National, state, and local area vaccination coverage among children aged 19–35 months–United States, 2011. MMWR Morb Mortal Wkly Rep. 2012; 61:689–96.
20. Centers for Disease Control and Prevention. National, state, and local area vaccination coverage among children aged 19–35 months – United States, 2012. MMWR Morb Mortal Wkly Rep. 2013; 62:733–40.
21. Koran Centers for Disease Control and Prevention. Available at. http://www.cdc.go.kr/CDC/info/CdcKrInfo0201.jsp?menuIds=HOME001-MNU1155-MNU1083-MNU1375-MNU0025&cid=20768. [accessed on 11 Jun 2014].
Go to : 
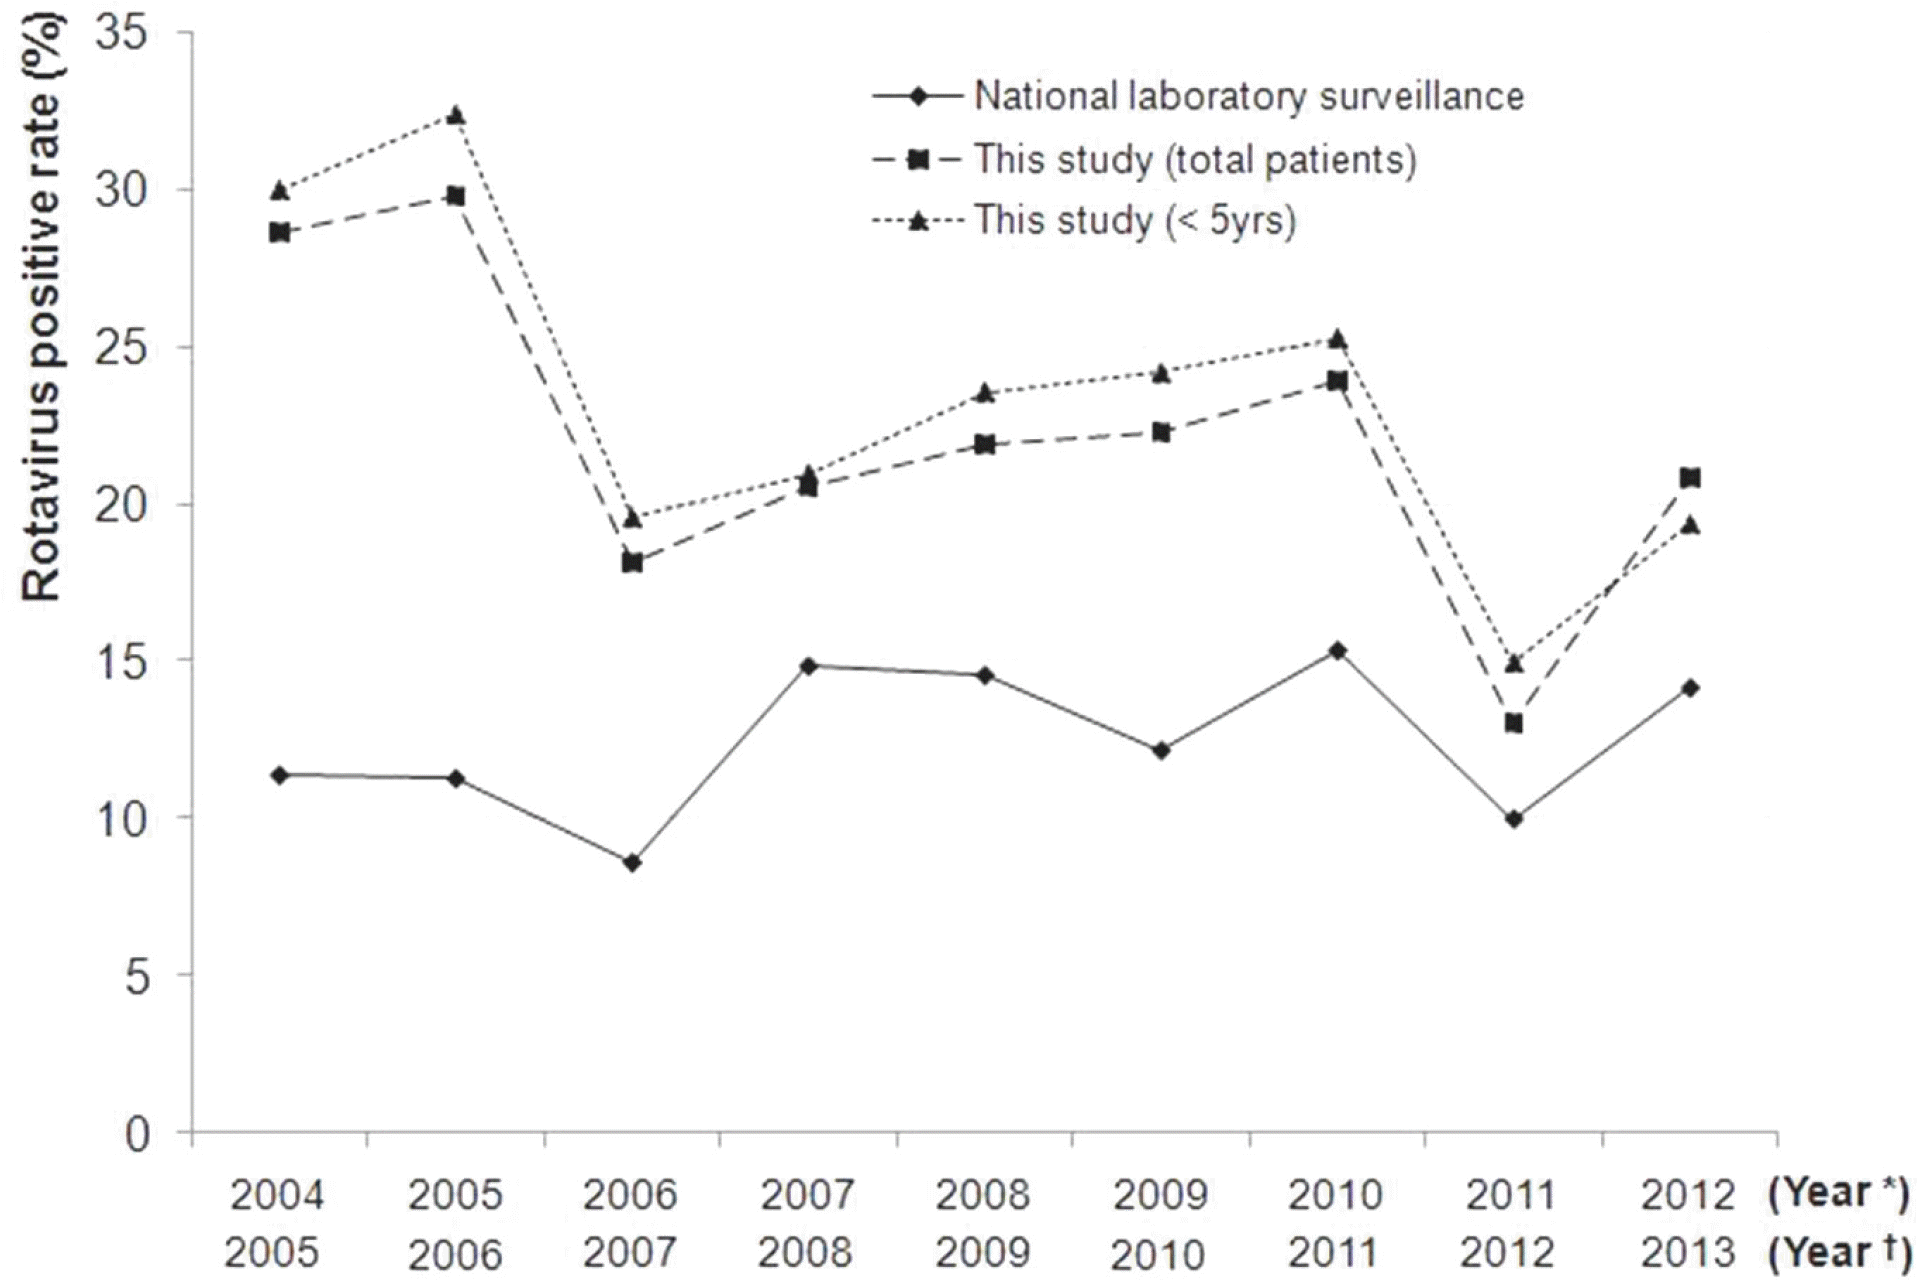 | Fig. 1.Distribution of rotavirus positive rate.∗ In this study: From 2004–2005 to 2012–2013 (ex. 2004 Year=September 2004 to August 2005).† In national laboratory surveillance: From 2005 to 2013(ex. 2005 Year=January 2005 to December 2005) (Source from reference 15, 16 and 17). |
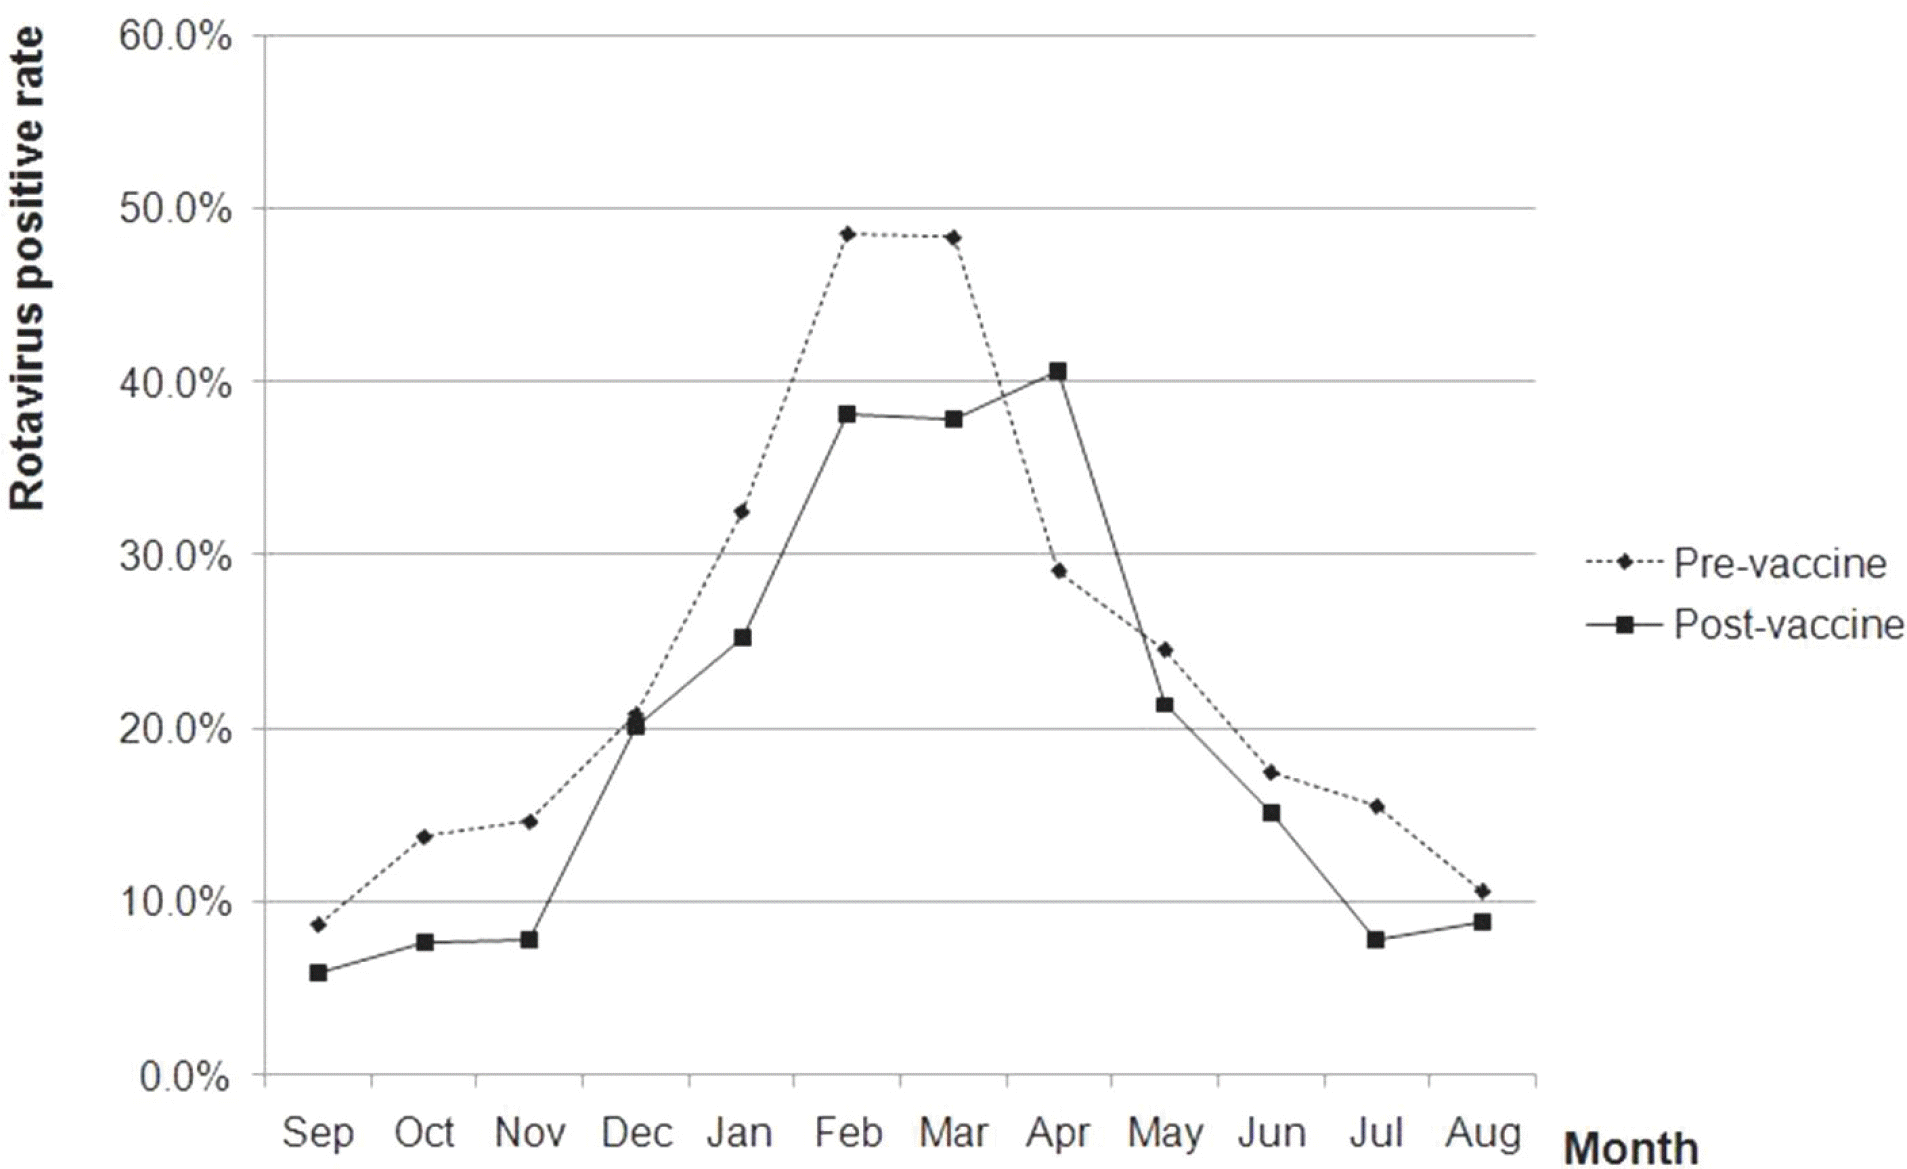 | Fig. 2.Monthly distribution of rotavirus positive rate in pre (2004–2006) and post (2008–2012) vaccine period. |
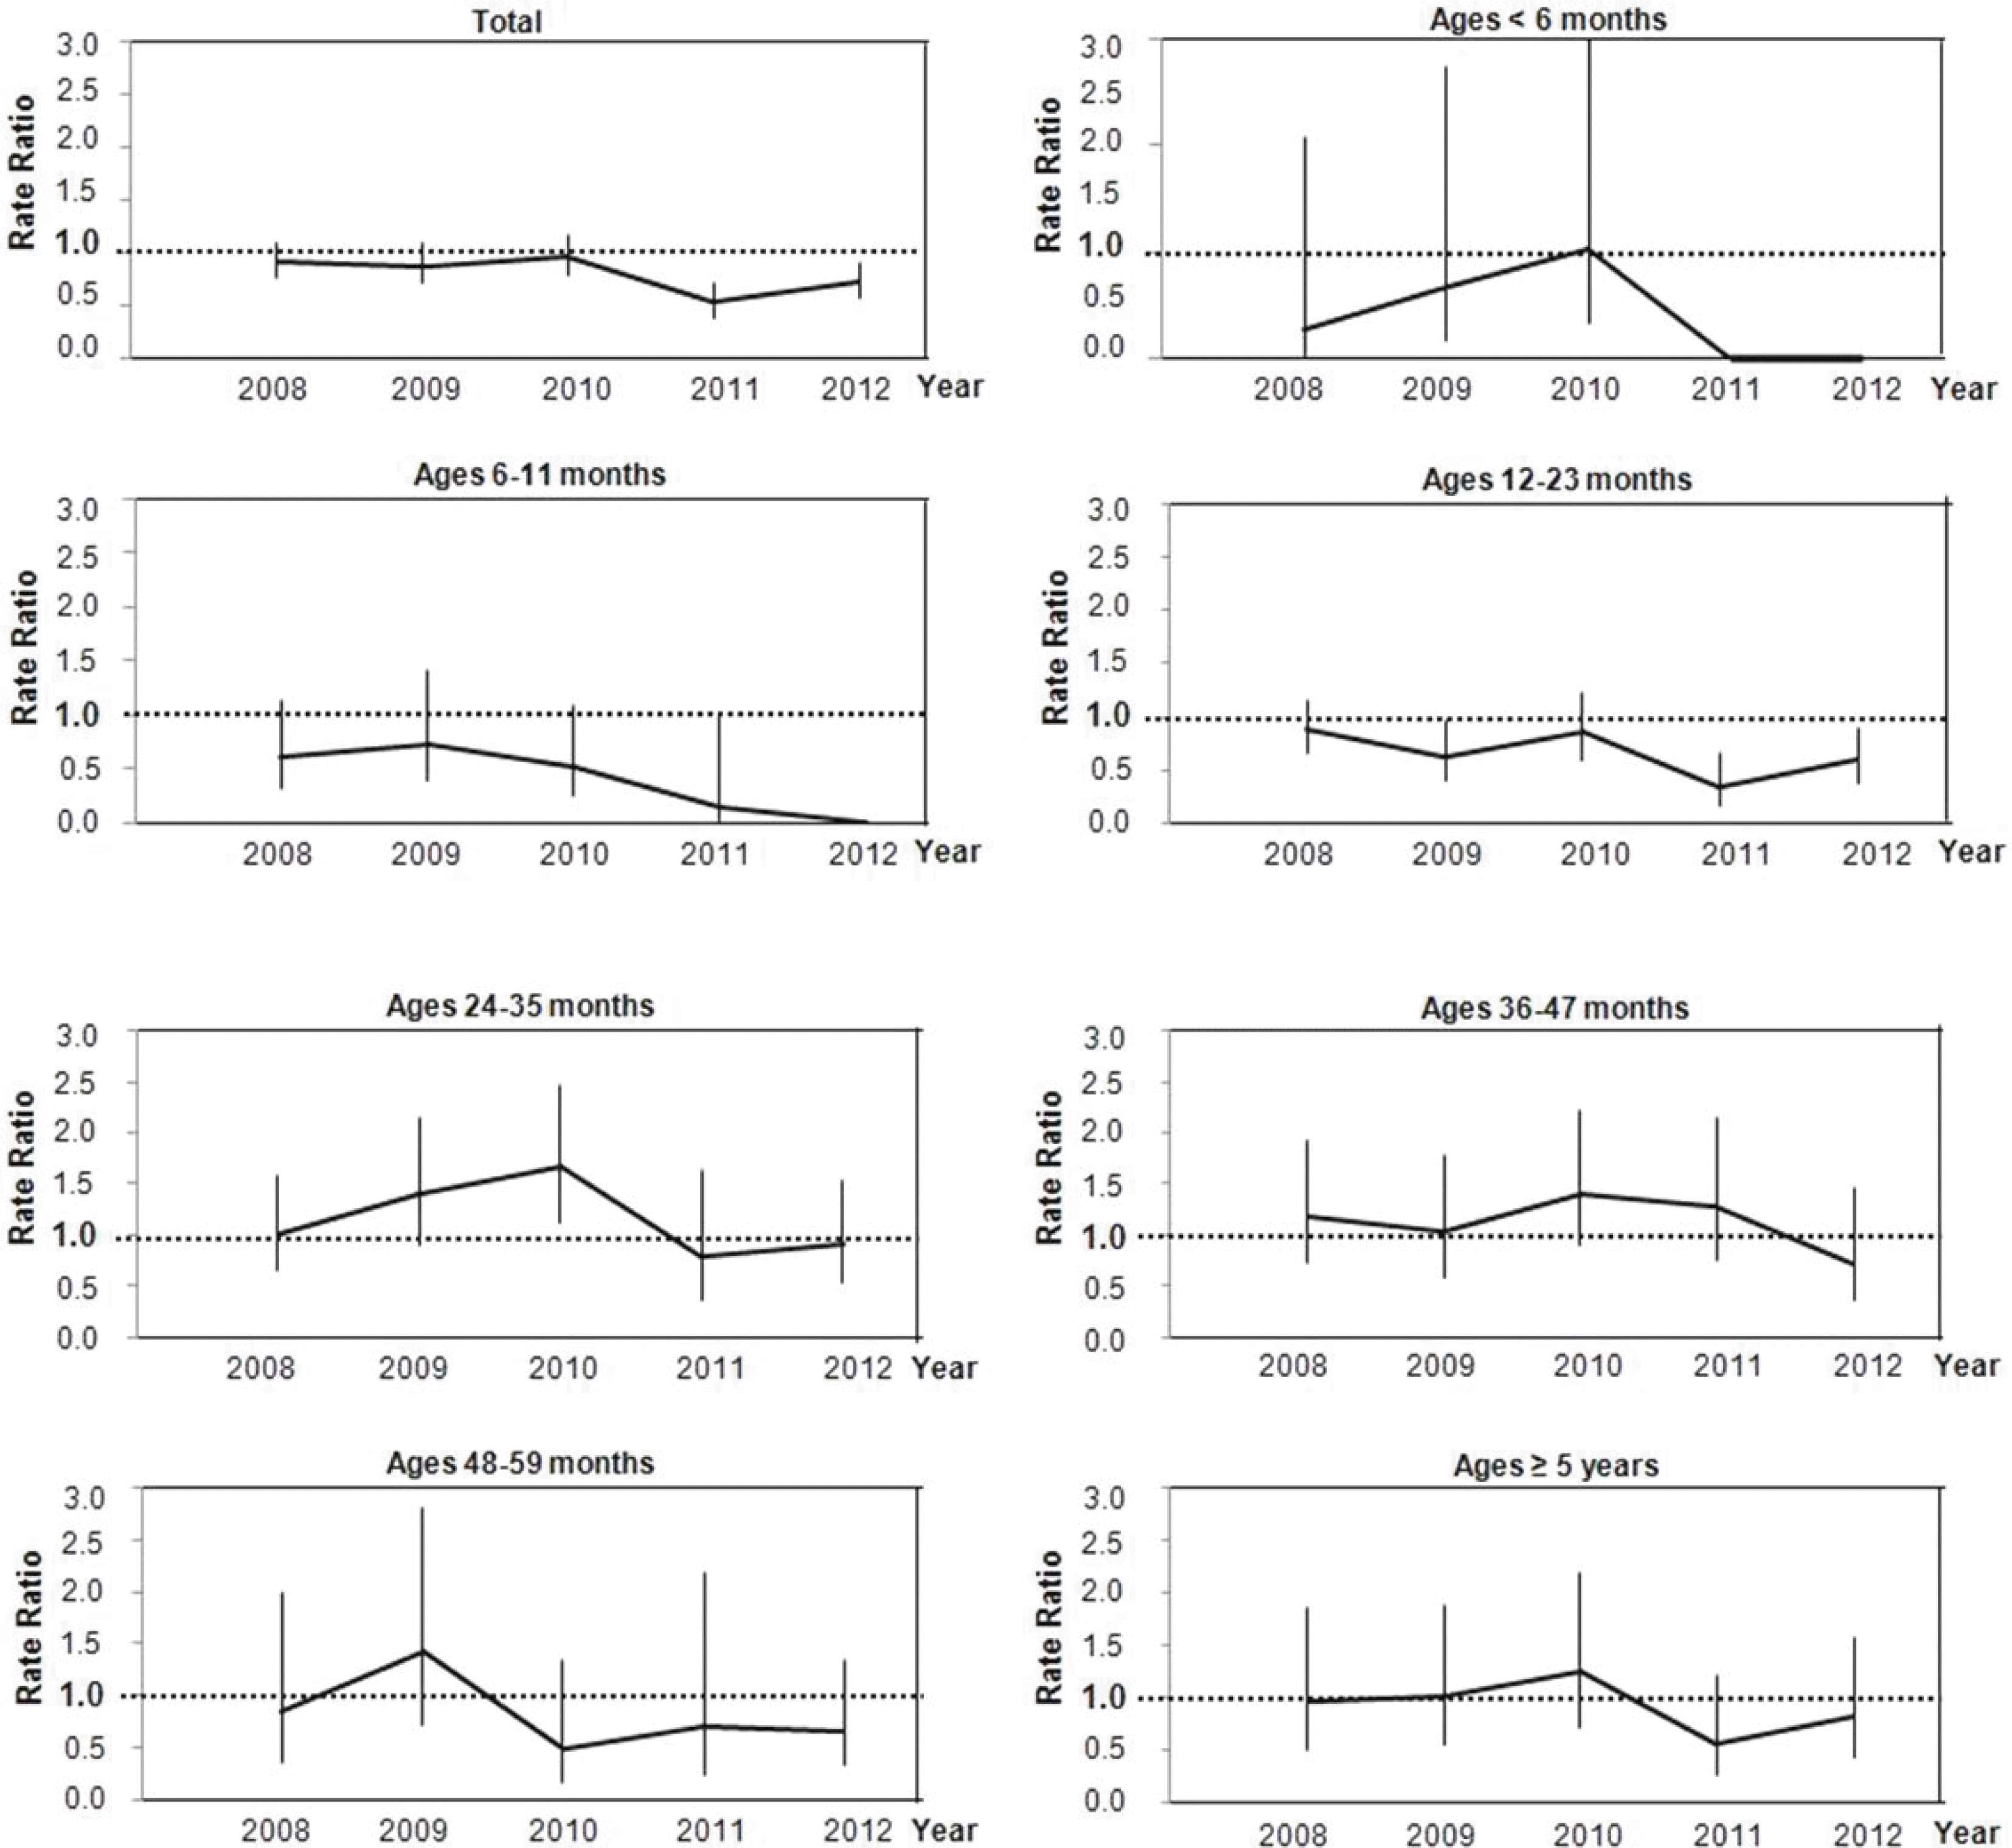 | Fig. 3.Rate ratio of age-specific rotavirus gastroenteritis in patients hospitalized with acute gastroenteritis: from 2008 to 2012 vs. pre-vaccine period (2004–2006). Vertical bars indicate the 95% confidence intervals. |
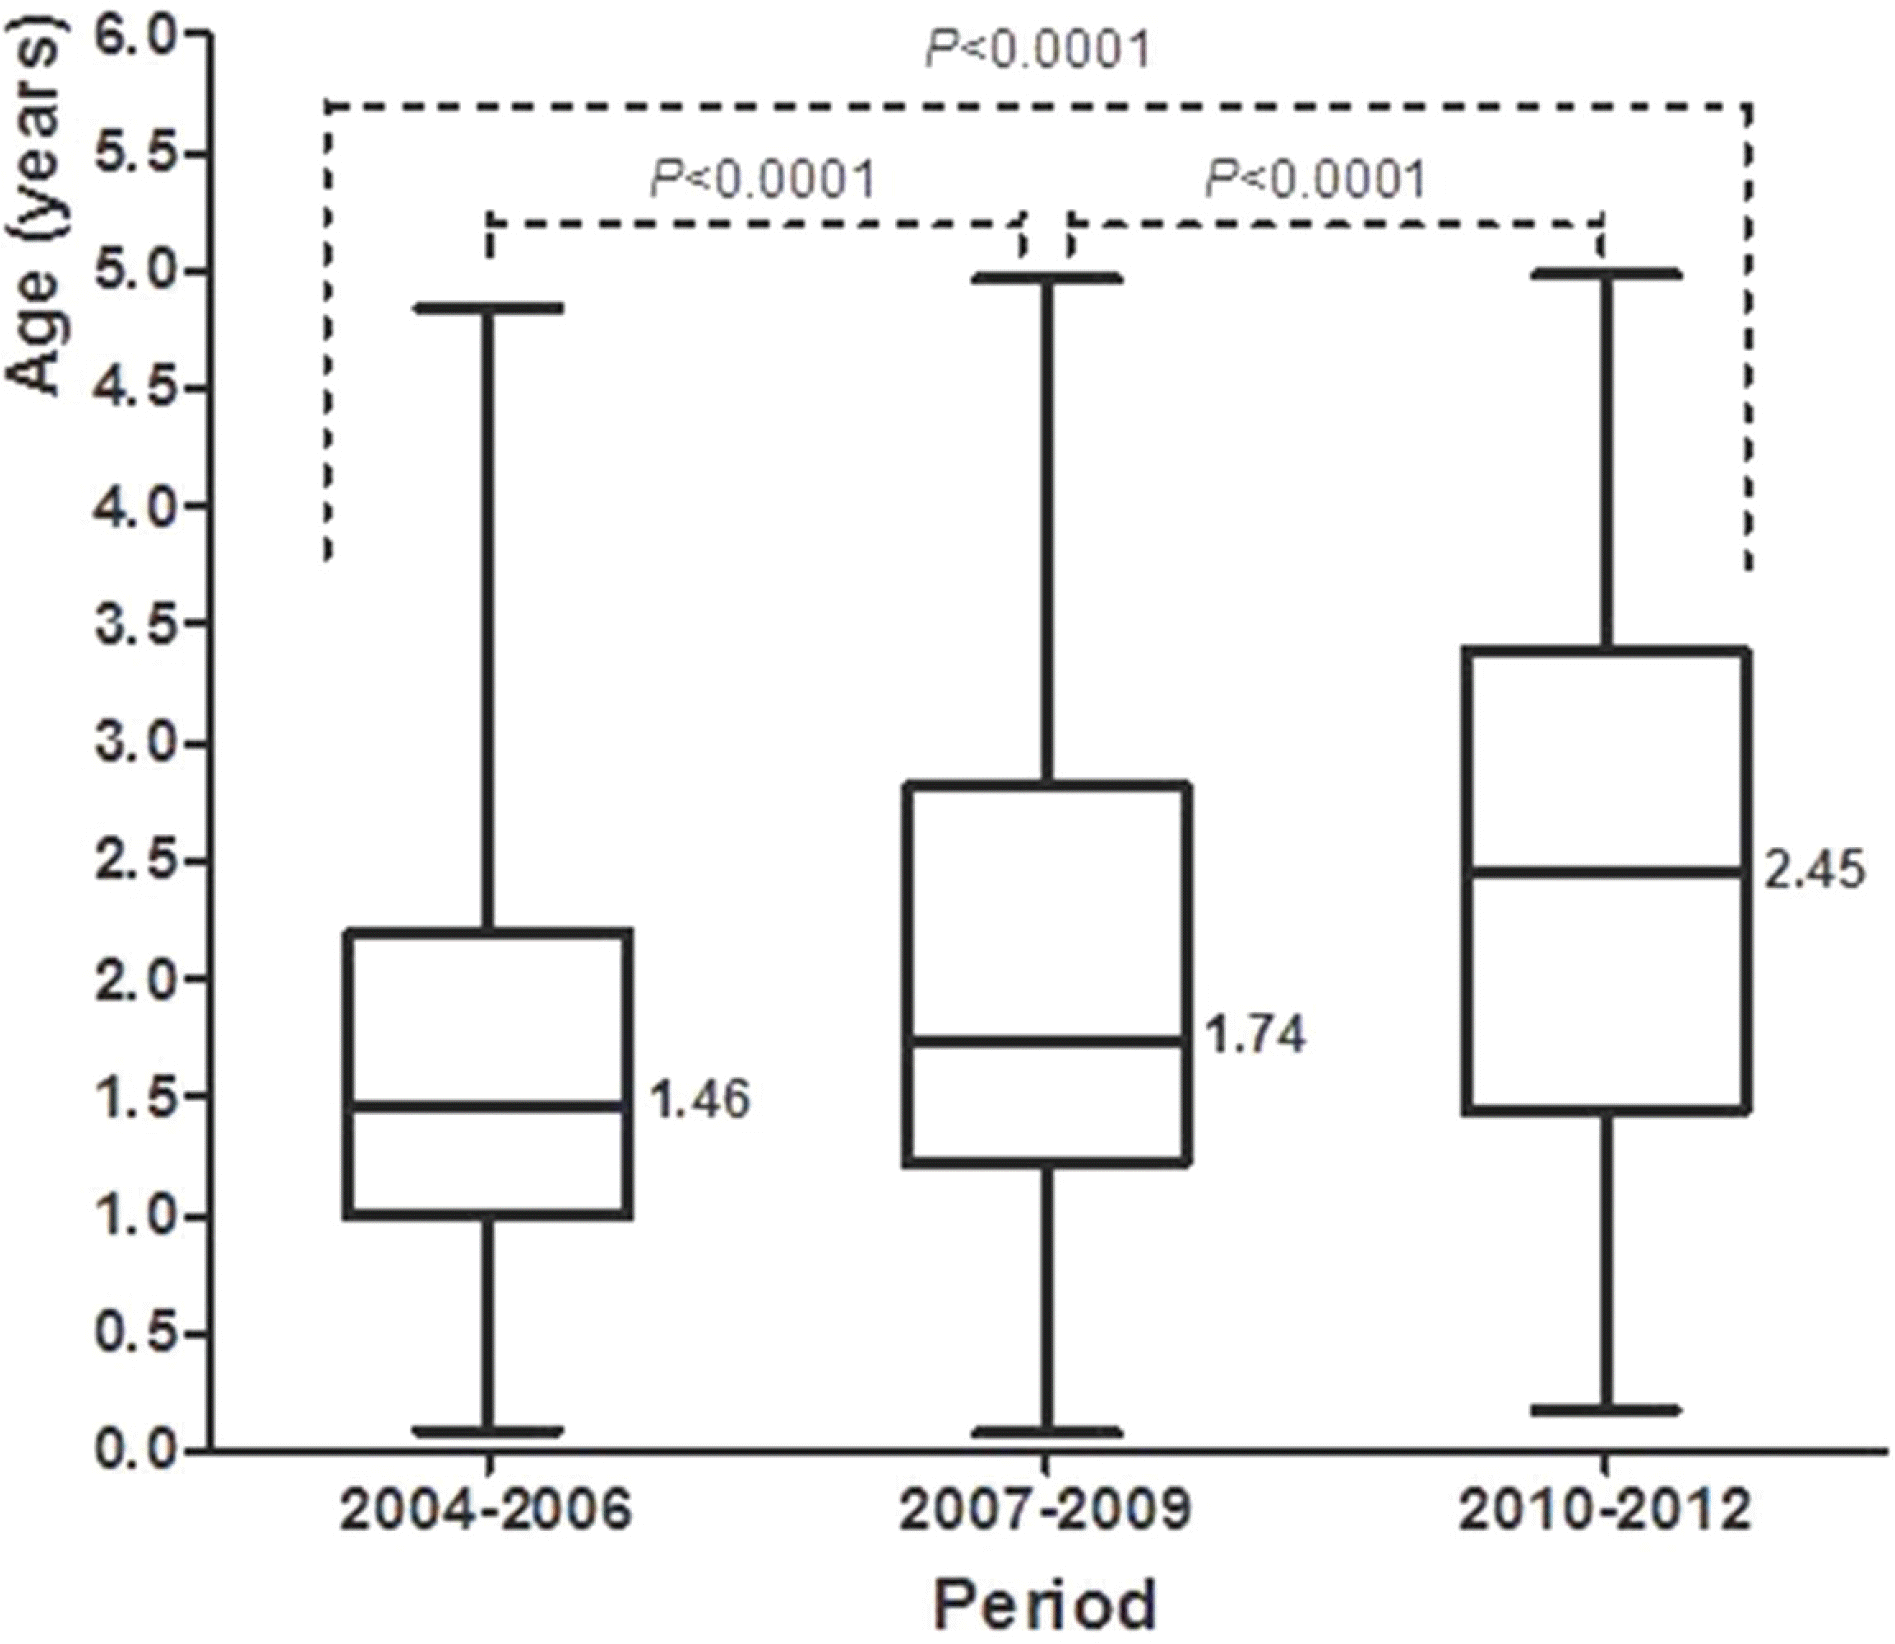 | Fig. 4.Comparison of age distribution of patients with rotavirus gastroenteritis (under 5 years of age). The box plot provides the median value with minimum, maximum, 25th and 75th percentiles. |
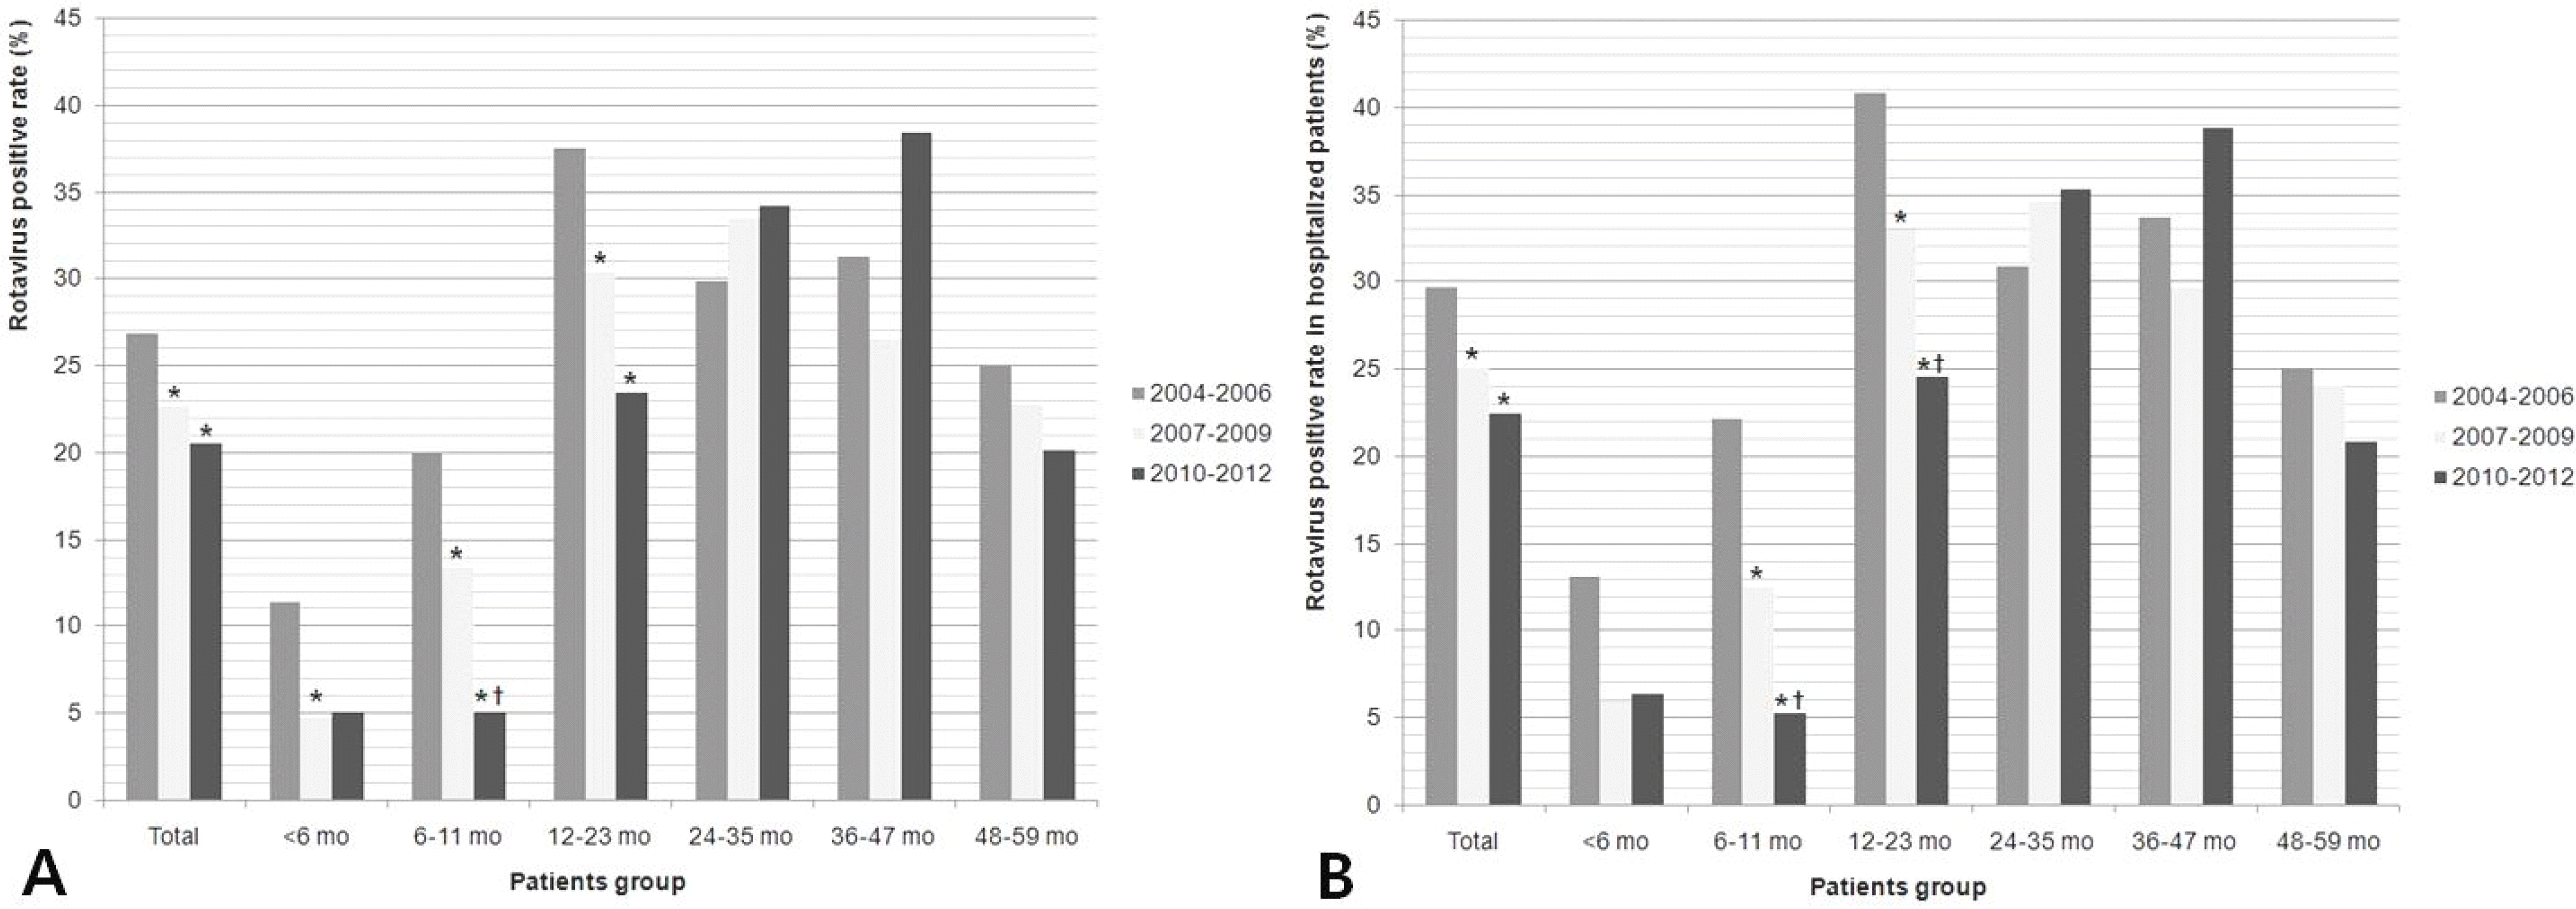 | Fig. 5.Rotavirus positive rate in patients with acute gastroenteritis (A) and in patients hospitalized with acute gastroenteritis (B) (under 5 years of age).∗ Indicate P<0.05 for decline in the positive rate or proportion of hospitalization as compared with the rate in the pre-vaccine period (2004–2006).† Indicate P<0.05 for decline in the rate as compared with the rate in the transition period (2007–2010). |
Table 1.
Comparison of Rotavirus Gastroenteritis between Pre- and Post-Vaccine Period
| Pre-vaccine period (2004–2006) | Post-vaccine period (2008–2012) | P-value | |
|---|---|---|---|
| No. of patients | 337 | 459 | |
| Age, median, years (range) | 1.6 (0.09–15.8) | 2.6 (0.08–18.5) | <0.0001 |
| Rotavirus positive rate, % | 25.0 | 20.8 | 0.0035 |
| Age subgroup∗,% | |||
| <6 months | 11.5 | 5.5 | 0.0560 |
| 6–11 months | 20.0 | 9.5 | 0.0001 |
| 12–23 months | 37.6 | 26.1 | 0.0004 |
| 24–35 months | 29.9 | 33.8 | 0.4492 |
| 36–47 months | 31.3 | 35.9 | 0.5120 |
| 48–59 months | 25.0 | 22.2 | 0.7200 |
| 5–9 years | 17.9 | 21.7 | 0.0011 |
| 10–18 years | 3.9 | 7.7 | 0.0112 |
| Proportion of hospitalized patients, % | 27.4 | 22.3 | 0.0019 |
| Age subgroup∗,% | |||
| <6 months | 13.2 | 6.3 | 0.1243 |
| 6–11 months | 22.2 | 9.6 | 0.0001 |
| 12–23 months | 40.9 | 28.4 | 0.0005 |
| 24–35 months | 30.9 | 35.6 | 0.4181 |
| 36–47 months | 33.7 | 38.2 | 0.5787 |
| 48–59 months | 25.0 | 23.9 | 0.8561 |
| ≥5 years | 14.5 | 13.4 | 0.6936 |
Table 2.
Epidemiological Trends of Rotavirus Gastroenteritis from 2007 to 2012
| Year | 2007 | 2008 | 2009 | 2010 | 2011 | 2012 | P-value |
|---|---|---|---|---|---|---|---|
| Positive rate, % | 20.5 | 21.9 | 22.3 | 23.9 | 13.0 | 20.8 | 0.1987† |
| % Decrease from 2004 to 2006 | 22.0 | 14.2 | 11.0 | 4.7 | 48.1 | 17.1 | |
| Age, median, years (range) | 1.7 | 1.8 | 2.6 | 2.6 | 3.5 | 3.6 | <0.0001‡ |
| (0.1–10.4) | (0.2–11.2) | (0.08–16.5) | (0.2–16.9) | (0.3–10.7) | (1.0–18.5) | ||
| Age subgroup∗,% | |||||||
| <6 months | 3.6 | 5.7 | 6.5 | 8.3 | 3.8 | 0.0 | 0.9858† |
| 6–11 months | 12.0 | 12.8 | 16.9 | 10.8 | 1.9 | 0.0 | 0.0018† |
| 12–23 months | 32.5 | 32.9 | 22.5 | 30.7 | 12.9 | 26.4 | 0.0152†† |
| 24–35 months | 33.8 | 29.4 | 37.9 | 46.7 | 22.6 | 26.5 | 0.6477† |
| 36–47 months | 17.0 | 34.0 | 30.8 | 43.8 | 41.9 | 26.7 | 0.0723† |
| 48–59 months | 17.2 | 19.4 | 31.3 | 9.5 | 20.0 | 32.4 | 0.3129† |
| 5–9 years | 19.0 | 17.5 | 27.6 | 27.5 | 11.8 | 23.8 | 0.8718†† |
| 10–18 years | 8.3 | 6.1 | 2.1 | 8.0 | 2.6 | 25.9 | 0.0381† |


 PDF
PDF ePub
ePub Citation
 Print
Print


 XML Download