Abstract
Purpose
We undertook this study to investigate discrepancies in C-reactive protein (CRP) and erythrocyte sedimentation rate (ESR) values, and variations following intravenous immunoglobulin (IVIG) therapy in Kawasaki disease (KD).
Methods
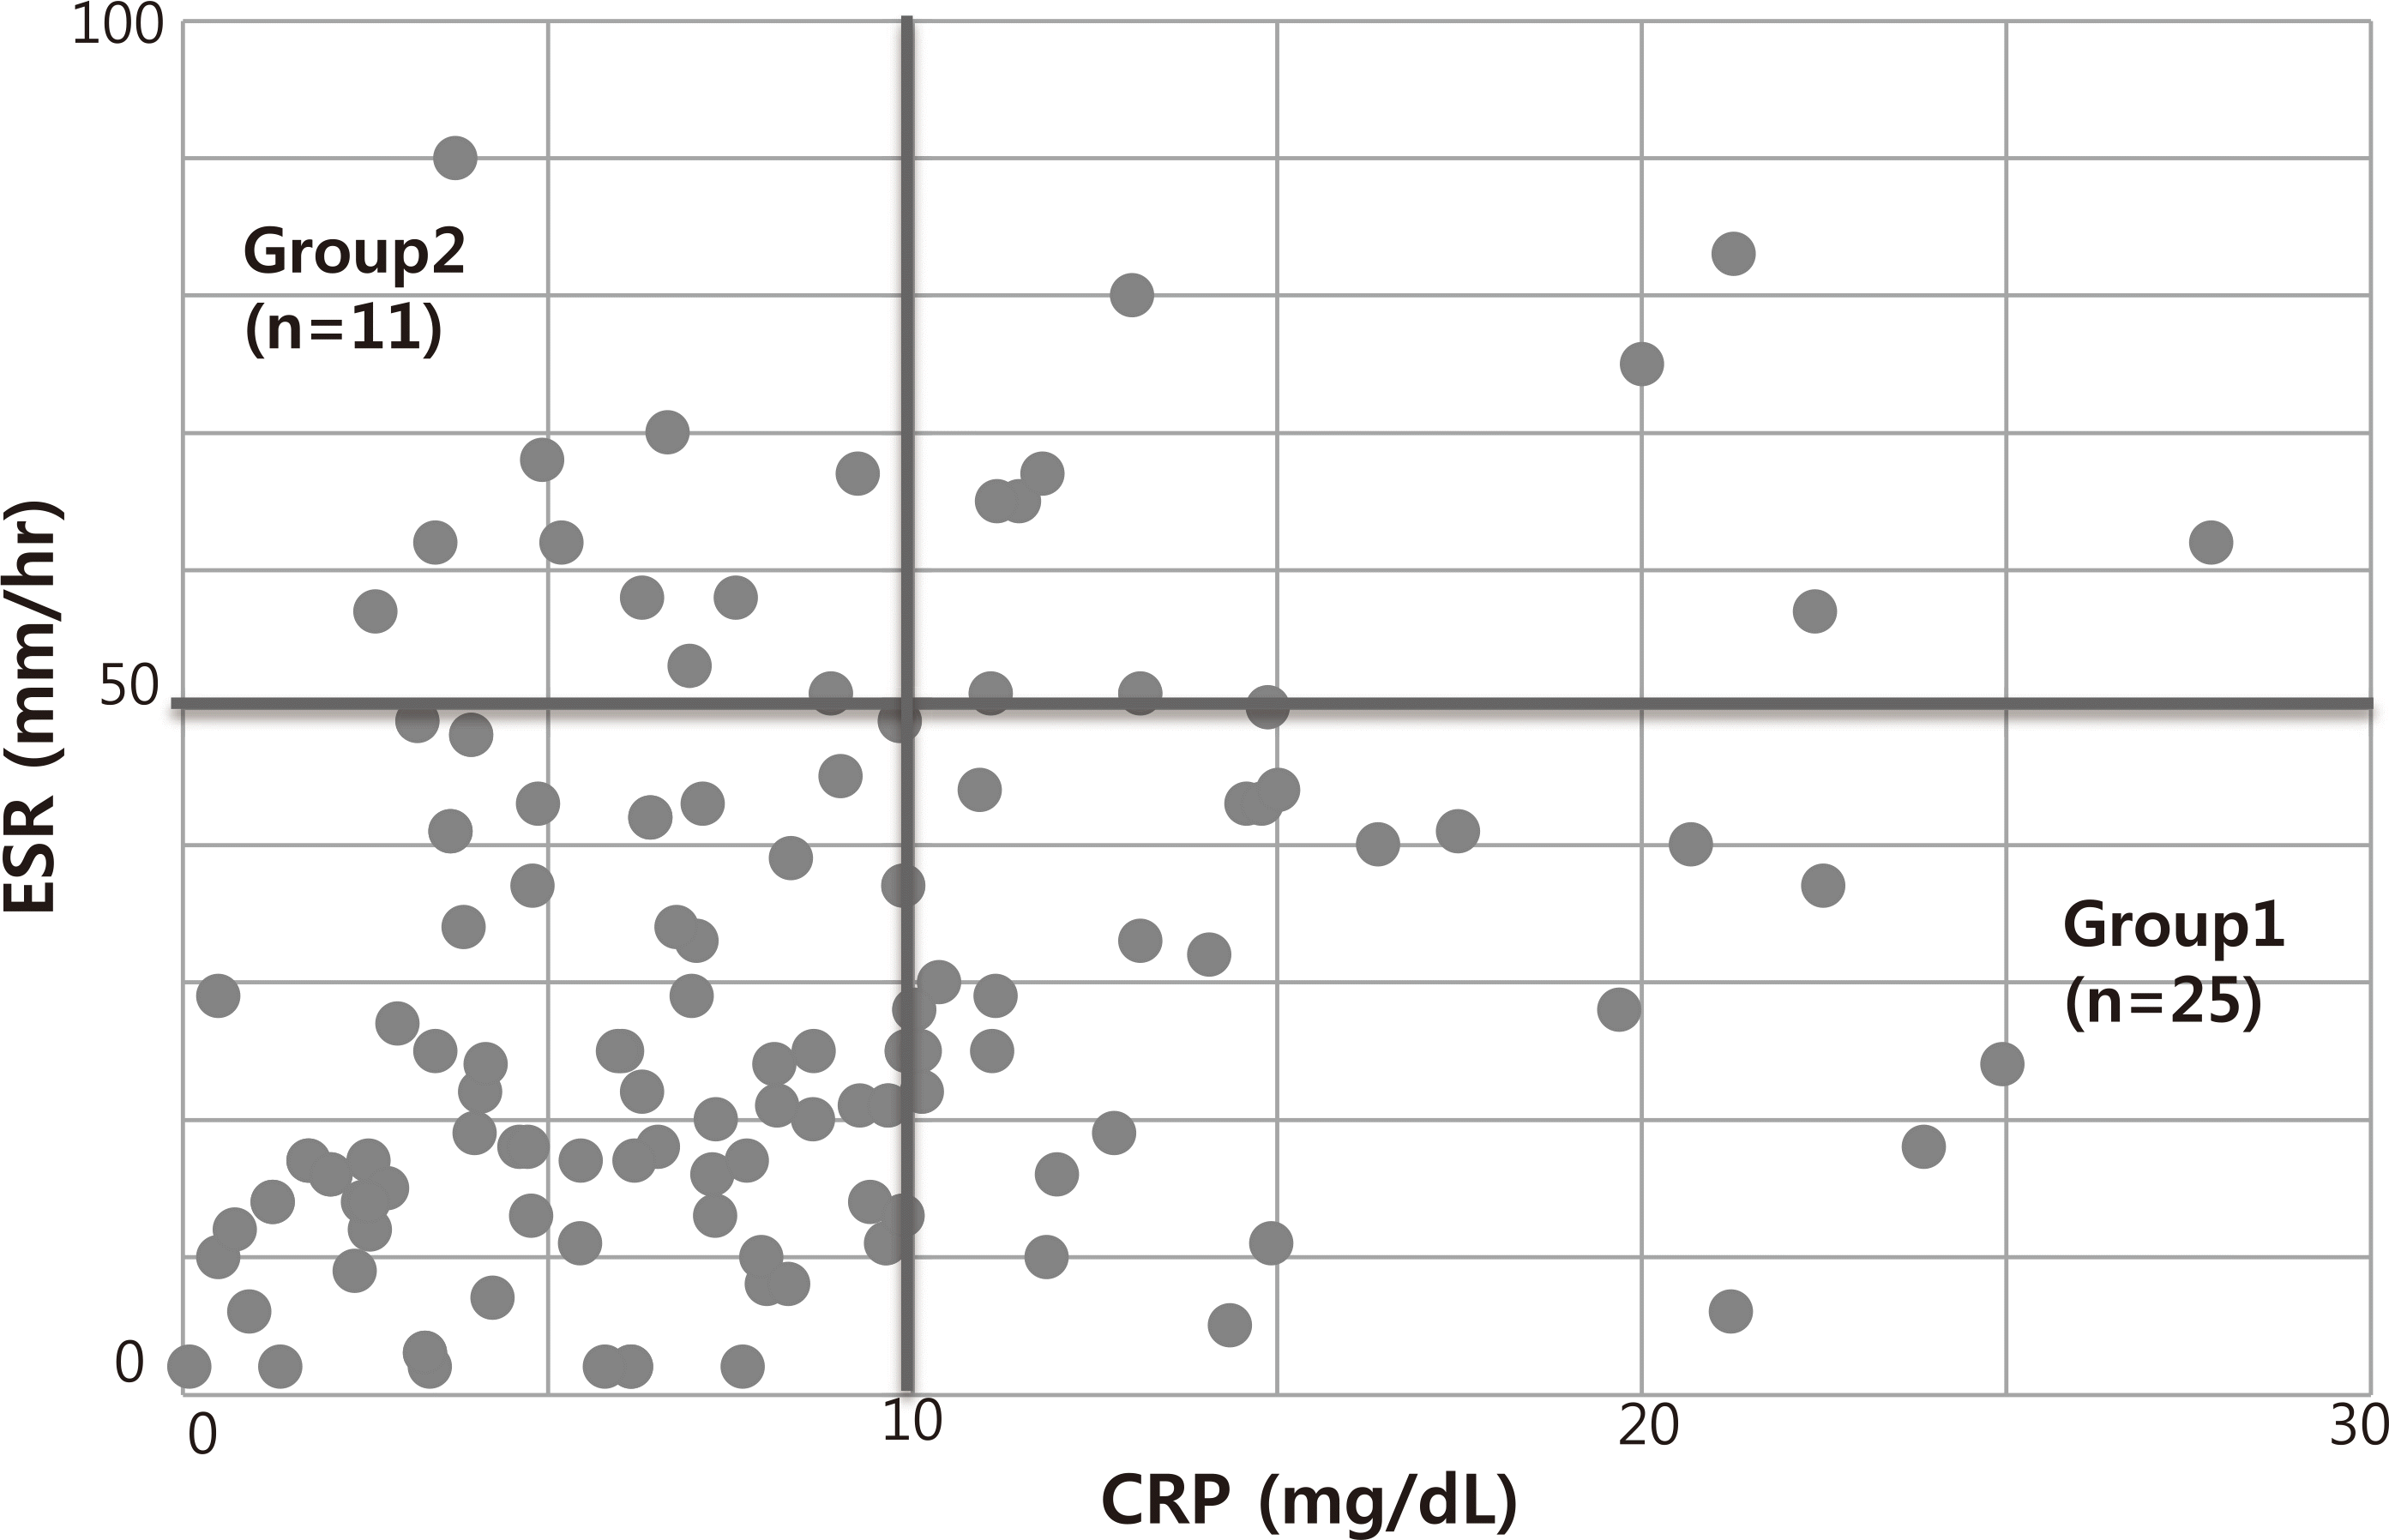
A total of 123 KB patients were retrospectively enrolled. Patients were treated with IVIG 2 g/kg at 2 to 9 days after disease onset. We obtained white blood cell (WBC) count, percentage of neutrophils (% neutrophils), CRP, ESR, and N-terminal pro-brain natriuretic peptide (NT—proBNP) values before and 48 to 72 hours after IVIG treatment. Discrepancy was defined as CRP 210 mg/dL and ESR <50 mm/ hr (Group 1), 0r CRP <10 mg/dL and ESR 250 mm/hr (Group 2).
Results
Thirty-six of 123 subjects (29.2%) had a discrepancy: 25 (20.3%) in Group 1 and 11 (8.9%) in Group 2. In Group 1, 15 patients (60%) had fever for <5 days (early presenter) and 10 (40%) had fever for 25 days (late presenter). There were six early presenters (55%) and five late presenters (45%) in Group 2. Late presenters had higher ESR than early presenters (34.31210 mm/hr vs. 26.3:193 mm/hr, P=0.029). After IVIG treatment, elevated WBC count, % neutrophils, CRP, and NT—proBNP levels normalized. In contrast, ESR increased from 37_4i21_9 mm/hr t0 48.0i22.7 mm/hr (n=36, P:0.0S1).
Conclusions
A discrepancy may be related to the duration of fever. Due to discrepancies in CRP and ESR values in acute KD, both should be measured to assess the degree of inflammatory activity before |V|G treatment. After IVIG treatment, the ESR should not be used as a marker of response to therapy in KD.
Go to : 
REFERENCES
1. Lee H, Kim H, Kim HS, Sohn S. NT-proBNP: a new diagnostic screening tool for Kawasaki disease. Korean I Pediatr. 2006; 49:539–44.
2. Anderson MS, Burns I, Treadwell TA, Pietra BA, Glode MP. Erythrocyte sedimentation rate and C-reactive protein discrepancy and high prevalence of coronary artery abnormalities in Kawasaki disease. Pediatr Infect Dis J. 2001; 20:698–702.

3. Dajani AS, Taubert KA, Gerber MA, Shulman ST, Ferrieri P, Freed M, et al. Diagnosis and therapy of Kawasaki disease in children. Circulation. 1993; 87:1776–80.

4. Lee G, Lee SE, Hong YM, Sohn S. Is high-dose aspirin necessary in the acute phase of Kawasaki disease? Korean Circ J. 2013; 43:182–6.

5. Research committee on Kawasaki disease. Report of subcommittee on standardization of diagnostic criteria and reporting of coronary artery lesions in Kawasaki disease. Tokyo. Japan: Ministry of Health and Welfare;1984.
6. Newburger JW, Takahashi M, Gerber MA, Gewitz MH, Tani LY, Burns IC, et al. Diagnosis, treatment, and longterm management of Kawasaki disease: a statement for health professionals from the Committee on Rheumatic Fever, Endocarditis and Kawasaki Disease, Council on Cardiovascular Disease in the Young. American Heart Association. Circulation. 2004; 110:2747–71.

7. Kawasaki T. Acute febrile mucocutaneous syndrome with lymphoid involvement with specific desquamation of the fingers and toes in children. Jpn I Allergy. 1967; 16:178–222.
8. Young B, Gleeson M, Cripps AW. C-reactive protein: a critical review. Pathology. 1991; 23:118–24.

Go to : 
 | Fig. 1.Comparison of C-reactive protein (CRP) and erythrocyte sedimentation rate (ESR) at presentation. |
Table 1.
Comparison of Basic Characteristics between Groups 1 and 2
Abbreviations: IVIG Intravenous Immunoglobulin; CRP, L-reactive protein; ESR, erythrocyte sedimentation rate. Data are expressed as mean±SD or number. Group 1 includes 25 patients with CRP 210 mg/dL and ESR <50 mm/hr, and group 2 includes 11 patients with CRP <10 mg/dL and ESR≥50 mm/hr at presentation.
Table 2.
Relationship between Fever Duration and Groups
| Group1CRP ≥1O mg/dL and ESR <50 mm/hr | Group 2 CRP <10 mg/dL and ESR ≥50 mm/hr | |
|---|---|---|
| Fever duration <5 days | 15 | 6 |
| Fever duration ≥5 days | 10 | 5 |
| Total | 25 | 11 |
Table 3.
Comparison between the Early and Late Presenters in 123 patients
Table 4.
Comparison between Pre- and Post-Intravenous Immunoglobulin Laboratory Values in 123 patients


 PDF
PDF ePub
ePub Citation
 Print
Print


 XML Download