Journal List > Allergy Asthma Immunol Res > v.10(1) > 1095779

Kennedy and Faulhaber: Respiratory Function and Symptoms Post Cold Air Exercise in Female High and Low Ventilation Sport Athletes

Abstract

Purpose

Cold weather exercise is common in many regions of the world; however, it is unclear whether respiratory function and symptom worsen progressively with colder air temperatures. Furthermore, it is unclear whether high-ventilation sport background exacerbates dysfunction and symptoms.

Methods

Seventeen active females (measure of the maximum volume of oxygen [VO2max]: 49.6±6.6 mL·kg-1·min-1) completed on different days in random order 5 blinded running trials at 0℃, -5℃, -10℃, -15℃, and -20℃ (humidity 40%) in an environmental chamber. Distance, heart rate, and rating of perceived exertion (RPE) were measured within each trial; forced expiratory volume in 1 second (FEV1), forced vital capacity (FVC), forced expiratory flow at 25%-75% (FEF25-75), and forced expiratory flow at 50% (FEF50) were measured pre- and post-test (3, 6, 10, 15, and 20 minutes). Respiratory symptoms and global effort were measured post-test spirometry.

Results

Mean decreases were found in FEV1 (4%-5% at 0℃, -5℃, -10℃, and -15℃; 7% at -20℃). FEF25-75 and FEF50 decreased 7% and 11% at -15℃ and -20℃, respectively. Post-exertion spirometry results were decreased most at 3 to 6 minutes, recovering back to baseline at 20 minutes. Respiratory symptoms and global effort significantly increased at -15℃ and -20℃ with decreased heart rate. High-ventilation sports decreased function more than low-ventilation participants but had fewer symptoms.

Conclusions

These results indicate that intense exercise at cold air temperatures up to -20℃ is achievable; however, greater effort along with transient acute bronchoconstriction and symptoms of cough after exercising in temperatures colder than -15℃ are likely. It is recommended that individuals cover their mouth and reduce exercise intensity to ameliorate the effects of cold weather exercise.

INTRODUCTION

The available evidence regarding whether cold air physical activity and exercise affects the respiratory system (function, injury, and symptoms) is limited. It is agreed that there are potential risks associated with cold air exercise (respiratory problems, hypothermia, and frostbite)1 and recommendations such as cover your mouth or do not exercise in temperatures less than -15℃23 exist. However, the recommendations especially those regarding “safe” exercise temperature are not based on controlled studies of graded cold exposure during exercise.
In healthy fit adults only, a few well controlled environmental chamber studies have examined how cold air exercise influences physiological measures4 or respiratory inflammation, function, and symptoms.56 First, it was shown that intermittent moderate intensity exercise over a 2-hour period at a severe ambient temperature of -23℃ does not lead to cough during or after the cold exercise exposure, but does increase airway inflammatory markers.5 Cold air reduces exercise performance and maximal oxygen consumption47 and decreases post-exercise spirometry results after 8 minutes of all out running at -18℃ in exercise-induced bronchoconstriction (EIB)-positive participants as well.6 Thus, the collective present evidence indicates that both ambient air colder than -18℃ in combination with heavy ventilation exercise has a significant acute effect on exercise tolerance, oxygen consumption, and respiratory function, although decreased respiratory function has only been found in individuals that have been diagnosed with EIB.
Other factors may also play a role in the acute response to cold air exercise, including prolonged high ventilation, during training and competition where these “high ventilation athletes (HVAs)” show more bronchial hyperresponsiveness (BHR) than non-HVAs (lack of “sustained periods of high aerobic and ventilatory demand” during training or competition).8 Furthermore, HVAs that train and compete in the cold have the combinative effect of inspiring large volumes of cold59 and especially dry air10 which leads to significant respiratory symptoms.1112 These respiratory symptoms include “post-exertion cough,”13 wheeze, chest tightness, and excess mucus14 regardless of whether the athlete is BHR positive or not.715
Thus, the primary aim of this study was to determine the influence of intense exercise (sufficient to induce hyperventilation) at different subzero temperatures on acute post-exercise respiratory function and respiratory symptoms. Secondly, we aimed to understand whether those individuals that would participate in “high ventilation” type sports differed in their response compared to participants whom would not be described as participating in “high ventilation” type sports. It was hypothesized that with a decrease in air temperature, the severity of post-exercise respiratory dysfunction will be increased and that the incidence/types of respiratory symptoms will increase. We also hypothesized that participants with prolonged high ventilation in training and competition will show increased respiratory dysfunction and symptoms at the same temperature compared to low ventilation participants.

MATERIALS AND METHODS

Participants and experimental design

Seventeen aerobically fit (measure of the maximum volume of oxygen (VO2max) >40 mL/kg/min) females between the ages of 18 and 30 who were used to hard exercise bouts were recruited. Females were recruited because: 1) females have a higher prevalence of BHR and hyperpnea16 and 2) are more mechanically constrained during hyperpnea leading to greater potential EIB and airway inflammation than age/fitness matched males.17 Exclusion criteria included heightened symptoms of EIB and cough during low or moderate intensity cold weather activity/training or had a previous history of adverse respiratory symptoms due to severe intensity exercise (regardless of the temperature the adverse respiratory symptoms occurred at). Participants were excluded if their predicted baseline values were <80% forced expiratory volume in 1 second (FEV1)/forced vital capacity (FVC) ratio or FEV1 <70%.18 All participants had normal baseline FEV1 and FVC values for their age, height, and gender. The study received Institutional Research Ethics Board approval and participants provided informed consent prior to starting the study.
This study was a repeated measures design with the same exercise protocol repeated in 5 different ambient air conditions (0℃, -5℃, -10℃, -15℃, and -20℃) with a relative humidity of 40%. The exercise protocol was based on a previously reported exercise protocol designed to induce heavy ventilation that is tolerable in both warm and cold conditions.6

Description of tests

Participants completed a graded exercise test (GXT) to fatigue in ambient laboratory conditions (3-minute stages starting at 6 km/hr increasing 1 km/hr to volitional fatigue at a standard grade of 5%) where expired gas analysis was measured continuously (Oxycon Pro, Care Fusion, Germany). Heart rate (PS 800; Polar, Kempele, Finland) and oxygen saturation (finger pulse oximeter, Pulsox-3i; Konica Minolta, Tokyo, Japan) were measured continuously and Borg scale rating of perceived exertion (RPE)19 was measured at the end of each work stage. The speed of the last completed full work stage was the target intensity for the subsequent cold air exercise bouts. This workload was chosen based on previous research which showed that 8 minutes of running at 5.3% grade at a speed which induced measure of the peak volume of oxygen (VO2peak) results in heavy ventilation.720 Baseline and post-exercise spirometry were completed at the time points 3, 6, 10, 15, and 20 minutes which are common time points for the measurement of spirometry post exertion.7
For each cold air exercise bout, participants exercised in a custom environmental chamber digitally controlled (Siemens AG, Munich, Austria) for both temperature and humidity. The chamber contained a customized treadmill (h/p/cosmos sports & medical gmbh, Nuβdorf, Germany) with an ambient operating range of 35℃ to -25℃. For each cold air trial, 1 investigator was with the participant in the chamber and 1 investigator was in the control room operating the treadmill and ensuring the temperature was constant. Participants were blinded to the temperature for each trial and cold air trials were randomly assigned to each participant. Before entering the chamber, participant's pre-trial spirometry was completed and then the participant was outfitted with a heart rate strap. Each cold air trial included 5 minutes of easy walking at that air temperature to reduce any cold pressor effect that might occur21 before starting their exercise bout. The exercise bout for each cold air condition consisted of 5 minutes of walking at 1% grade, then 10 minutes of running at 2 km/hr <VO2max velocity, at 1% grade; followed by a 1-minute transition to the heavy intensity stage (8 minutes at velocity equal to last completed stage in GXT to fatigue, 5% grade). Heart rate and RPE19 was measured once at the end of walking warmup, every 2 minutes during the 10-minute stage of exercise (2 km/hr <VO2max velocity, 1% grade) and at the end of each minute during the heavy intensity stage. The investigator inside the cold chamber manually recorded heart rate and RPE at the time points described previously. For the 8-minute heavy ventilation stage, the control room investigator recorded the distance completed for each cold air trial. In some instances, the speed was reduced due to participant fatigue (speed was reduced by 0.5 km/hr) as an initial reduction and subsequently reduced by another 0.5 km/hr if required to ensure the participant finished the 8-minute stage at each temperature. At the end of the exercise bout, participants exited the environmental chamber to perform post-exercise spirometry at 3, 6, 10, 15, and 20 minutes' post-exercise in accordance with previous methods.6 Post-exercise spirometry was done at a normal indoor ambient temperature of 20℃ and this temperature was consistent in each participant for each exercise trial. Participants were allowed to walk around slowly during the post-exercise bout spirometry measurements in order to provide a typical cool down found after exercise. Participants were allowed to wear temperature appropriate clothing designed for exercise outdoors, including a toque and gloves; however, participants were not allowed to cover the face or mouth in any manner (scarf, buff, hand) nor tuck their chin into their collar cuff. Each participant was allowed to wear their own clothing and was allowed to add/discard clothing during the walking and 10-minute running stages of each cold air exercise trial. This was done to ensure that participants were not unduly influenced by being too cold or too warm during the 8-minute stage of heavy exercise, thus reducing the chance that thermoregulation influenced exercise performance.
The familiarization session included baseline spirometry and VO2max test. The familiarization visit was 48 hours before the first cold air exercise bout. Cold air exercise bouts were a minimum of 24 hours apart completed within 3 weeks. Participants were asked to refrain from heavy meals 6 hours prior to a cold air trial, not to ingest caffeine within 2 hours of a cold air trial and to perform no heavy intensity exercise on the same day prior to a cold air trial. All participants were screened for physical activity readiness using the Physical Activity Readiness Questionnaire (PAR-Q; Canadian Society of Exercise Physiology, Ottawa, Canada). The tests were completed during the months of October, November and December.

Measures

Routine spirometry was completed in the sitting position according to the American Thoracic Society (ATS) guidelines.18 Spirometry was repeated using a portable electronic spirometry device (SP1; Schiller, Linz, Austria) that has been validated against laboratory machines. All tests were performed by trained personnel to ensure consistency of the procedure. The main outcome measures were FEV1, FVC, ratio of FEV1 to FVC (FEV1/FVC), forced expiratory flow at 50% (FEF50), and forced expiratory flow at 25%-75% (FEF25-75). Pre- and post-test changes in spirometry measures were calculated in raw units as well as maximum percentage change: pre-exercise - minimum post-exercise)/(pre-exercise value)×100 based on the protocol published previously.6

Questionnaires

Prior to each cold air exercise bout, a shortened version of an exercise-induced asthma questionnaire evaluating prevalence in Scandinavian healthy and athlete populations22 was administered. The shortened version aimed to discern the impact of the cold air exercise bout on the 4 most common respiratory symptoms associated with BHR: coughing, wheezing, chest tightness/trouble breathing (dyspnea), and excessive mucus secretion. It is noticeable that the administration of this questionnaire was to ask about the post-exercise respiratory symptoms after the previous exercise bout.
All participants were also asked their session-based RPE (10-point scale) at the end of the post-exercise spirometry to determine global exercise stress23 for that exercise bout at that temperature.

Statistical analysis

Descriptive analysis is reported as means and standard deviations. Repeated measures analysis of variance (ANOVA) was run to determine the influence of temperature on maximum reduction of FEV1, FVC, FEF25-75, and FEF50. Repeated measures ANOVA's were used to determine differences in FEV1 between temperatures at each time point post-exercise. Post hoc pairwise comparisons of FEV1 determined differences in FEV1 at post-exercise time points for each condition. Pearson product-moment correlation determined the relationship between aerobic fitness and delta change in respiratory measures. Differences in the prevalence of each symptom and for the sum of symptoms at the given temperature between temperatures were examined using the related samples Cochran's Q non-parametric test. Pairwise comparisons were completed for symptoms where Cochran's Q was significant (uncorrected for alpha). Fisher's exact test from the SPSS crosstab analysis (SPSS Inc., Chicago, IL, USA) was used to determine differences between groups (high ventilation/low ventilation participants) for each symptom summed for all temperatures (overall) and for individual symptoms at each temperature. Statistical analysis was performed using SPSS version 21. A P value of below 0.05 was considered significant.

RESULTS

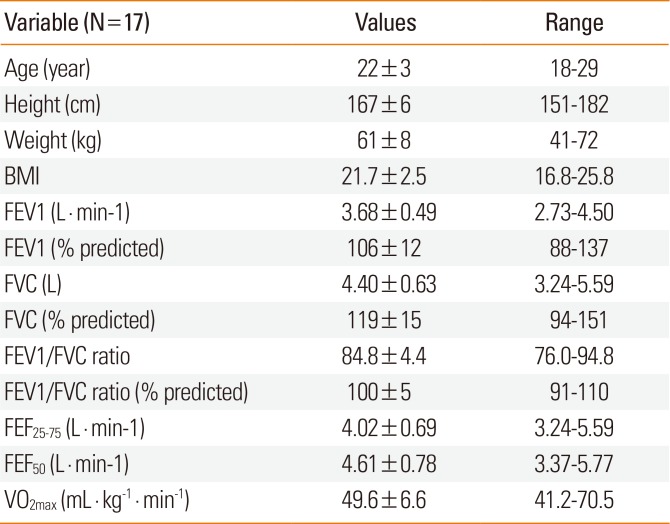
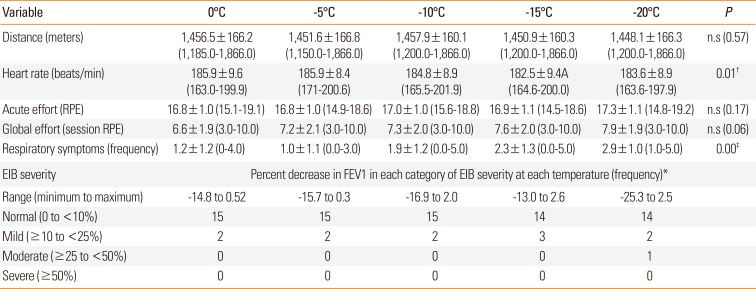
Descriptive data and baseline respiratory function are shown in Table 1. Predicted mean values for FEV1, FVC, and FEV1/FVC ratio were 100% or greater. No participant was below the lower limit of normal for any predicted respiratory measure based on their age, height, and gender.24 The distance run in the 8 minutes of intense exercise was not different between the temperatures (0℃, -5℃, -10℃, -15℃, and -20℃; Table 2). Acute effort (reported as the average RPE on a 15-point scale) for the 8 minutes of intense exercise was not different across the temperatures. Global effort (session-based RPE) tended to increase from 6.6±1.9 at 0℃ to 7.9±1.9 at -20℃ (P=0.06). Heart rate decreased and the frequency of respiratory symptoms increased significantly from 0℃ to -20℃ (pairwise comparisons shown in Table 2). Participants EIB severity class to each cold air exercise trial is also presented in Table 2, As shown in Table 2 most participants were classified as normal. At 0℃, -5℃, and -10℃, 2 participants had a ≥10% decrease in FEV1 (mild EIB). At -15℃ and -20℃, 3 participants had a ≥10% decrease in FEV1 post-exercise with 1 participant classified as moderate EIB at -20℃ (≥25%; Table 2).
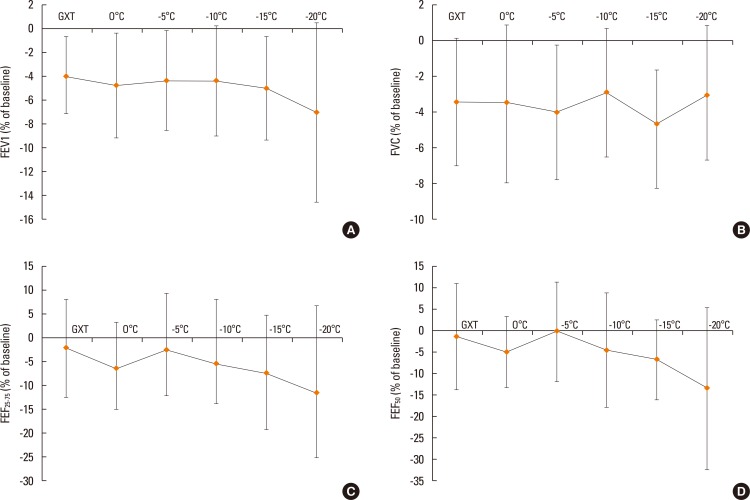
The maximum reduction in FEV1, FVC, FEF25-75, and FEF50 are shown in Fig. 1. There were no significant changes across the temperatures for any spirometry measures. The average decrease in FEV1 was 4% to 5% for the GXT as well as 0℃, -5℃, -10℃, and -15℃. At -20℃, the average decrease in FEV1 was 7% (Fig. 1A). The average decrease in FVC was between 2.9% (-10℃) and 3.5% (0℃) as shown in Fig. 1B. The mean decrease in FEF25-75 was 11.4% and 7.3% at -20℃ and -15℃, respectively (Fig. 1C). At -15℃ and -20℃, FEF50 decrease was significantly greater than that at -5℃ (Fig. 1D).
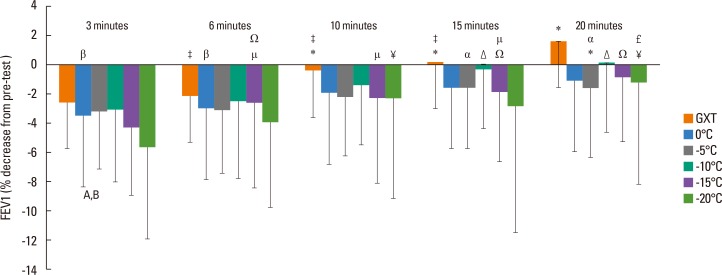
At 3-minute post-exercise, FEV1 reduction at -20℃ was significantly less than those at 0℃ and -10℃ (P<0.05; Fig. 2). There were no differences between temperatures at the other time points (6, 10, 15, and 20 minutes). At each temperature, there was a transient recovery in FEV1 from 3 to 20 minutes. Fig. 2 shows specific pairwise differences between the time points (3, 6, 10, 15, and 20 minutes) at each temperature.
Correlation analysis of FEV1 reduction between cold air temperatures found that FEV1 reduction at 0℃ correlated with those at -5℃, -10℃, -15℃, and -20℃ (r=0.53, 0.82, 0.53, and 0.80, respectively; P<0.05) and that FEV1 reduction at -10℃ was correlated with -15℃ and -20℃ (r=0.60 and 0.63, respectively; P<0.05).
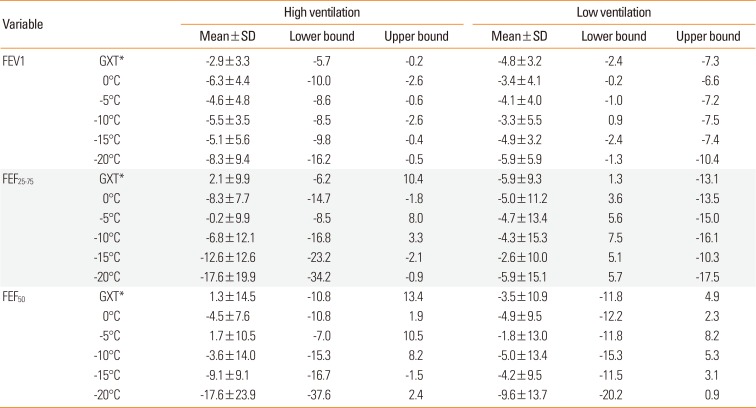
Eight participants met the criteria of a HVA (ventilation is increased for prolonged periods during sport, training, and competition) and 9 were low ventilation athlete (LVA, intermittent, short duration, low aerobic energetic cost).2526 The mean changes in FEV1, FEF25-75, and FEF50 between the groups are shown in Table 3. There were no significant differences between the groups; however, the HVAs had greater reductions in flow (FEF25-75 and FEF50), and the reductions were 2- to 4-fold greater at the colder temperatures (Table 3).
The frequency of symptoms overall that occurred in the 24 hours post-exercise trial was not different between the HVA and LVA groups (23 vs 37, P=0.74); also, the frequency of specific symptoms were not: cough (12 vs 18, P=0.65), wheeze (4 vs 5, P=1.00), chest tightness (3 vs 7, P=0.11), and excessive mucus (4 vs 7, P=0.14). There was no significant difference in the numbers of individual symptoms (cough, wheeze, chest tightness, or mucus) at any temperature between the groups.
The frequency of symptoms in all participants was 8, 6, 16, 14, and 16 at each temperature (0℃, -5℃, -10℃, -15℃, and -20℃, respectively), but the difference was not statistically significant (P=0.14). However, the frequency of cough was increased (3, 2, 8, 10, and 7 participants reported cough post 0℃, -5℃, -10℃, -15℃, and -20℃, respectively) and was different across the temperatures (P=0.00). Pairwise comparison exhibited that cough prevalence was significantly different at 0℃ and -15℃ (P=0.04) as well as -5℃ and -15℃ (P=0.00). Chest tightness prevalence overall across the temperatures was also different; however, no pairwise comparisons of chest tightness prevalence between individual temperatures were significant (1, 1, 1, 1, and 6 at 0℃, -5℃, -10℃, -15℃, and -20℃, respectively; P=0.01). Most symptoms were reported to resolve within 1 hour post-exercise and 3 participants (all from the LVA group) also reported a sore throat at -20℃.

DISCUSSION

To our knowledge, this is the first study to investigate respiratory function and symptoms post-exercise at different sub-zero temperatures in a standardized laboratory environment. We chose 5 different cold air temperatures typical of northern and mountain climates in the fall and winter that are associated with cold weather sport and activity.27 To be as specific as possible in identifying at what temperature respiratory function and/or respiratory symptom prevalence changes significantly, we used 5-degree increments. We hypothesized that intense exercise in the cold would reduce spirometry measures post-exercise and that the magnitude of the reduction would be greater at colder temperatures. At each cold air temperature, FEV1, FVC, FEF25-75, and FEF50 was less than pre-exercise baseline, and FVC had a similar reduction across the temperatures (about 4% at each temperature). FEV1 reduction was similar at 0℃, -5℃, and -10℃ with a greater reduction at -15℃ and a further decrease to 7% at -20℃. FEF25-75 and FEF50 had similar reductions in magnitude across temperatures (Fig. 1C and D) and FEF50 was significantly less at -15℃ and -20℃ compared to -5℃. With spirometry measures as shown in Fig. 1, there was wide variability and the variability increased at colder temperatures. This illustrates that individual respiratory responses to exercise in sub-zero temperatures can vary widely. Compared to previous investigations that examined cold air exposure in healthy individuals at different temperatures: -1℃ or -23℃, respectively; 2829 as well as elite runners free of asthma,30 the mean reduction in spirometry measures was similar to ours. However, in EIB-positive individuals exposed to cold air and exercise at -3℃ or -18℃ post-exercise,631 FEV1 reduction was >20% compared to 4% in our study.
The ambient relative humidity for our cold air trials was approximately 40% (30%-44%), and thus the potential airway drying that might provoke bronchoconstriction was less than if inhaling dry air.29 However, 40% relative humidity at 22℃ increases FEV1 fall post-exercise 2-fold compared to humid conditions.32 This is due to total water content in cold air decreasing proportionately from warm to very cold air.26 In this study the actual water contents were 2.00, 1.43, 0.92, 0.38, and 0.26 g/m3 for 0℃, -5℃, -10℃, -15℃, and -20℃, respectively, at 40% relative humidity. This means, for example, that -20℃ air holds 99% less total water content compared to 0℃ and that the total water content in any sub-zero is very low.33 This highlights the acute physiological stress of cold air inhalation on the airway which leads to both drying and cooling of the airway, especially with increased ventilation in cold climates.3 This cooling and drying can lead to bronchoconstriction,3 although the time course of respiratory function recovery post-exercise in cold air is not clear.
Previous investigations have shown that, post-exercise challenge, the greatest reduction is within 5 minutes post recovery back to baseline by 30 minutes.634 However, in these investigations only 1 cold air condition is provided, and thus our data provides insight into where the peak reduction occurs across the range of sub-zero temperatures (0℃, -5℃, -10℃, -15℃, and -20℃). As shown in Fig. 2 at each temperature the 3- and 6-minute values were significantly less than the 20-minute value for FEV1, which indicates that, with graded cold exposure, the recovery period is similar across sub-zero temperatures. From the perspective of physical activity, these results indicate that, even in very cold weather, post-exercise reductions in respiratory function are transient and should recover fully within 20 minutes. It must be noted that the pre and post spirometry measures were taken at ambient laboratory temperature and previous research has indicated that inhalation of ambient laboratory air following a cold air trial can increase EIB.35 Farley et al.29 have suggested that this rewarming burden that occurs post-exercise is proportional to the magnitude of the cold air exercise and is caused by greater water loss rate during the post exertion ambient conditions. Thus, these results, especially the colder air trials, likely increased airway drying post exertion, and cold air trial methods should consider that the post exertional environment will influence the degree of airway narrowing.35
Our secondary purpose aimed to understand if HVAs would increase respiratory dysfunction and symptoms because HVAs are at greater risk of EIB.25 As shown in Table 3, the mean reduction in respiratory function for the high ventilation group was larger at -15℃ and -20℃ compared to the low ventilation group (especially FEF25-75 and FEF50). To our knowledge, this is the first investigation to systematically analyze the airway response of high versus low ventilation participants and thus provides novel insight into the influence that accumulated high ventilation over years can have on acute hyperresponsiveness of the airway36 and to cold air.3 Furthermore, there were 2 cold air endurance athletes (1 biathlete and 1 Nordic skier) and their response to the different cold air temperatures, especially at -15℃ and -20℃, was greater compared to the other HVAs (2- to 2.5-fold greater reduction in FEV1, FEF25-75, and FEF50) which is in keeping with others examining cold weather athletes such as Nordic skiers and biathletes.2 In addition the cold air endurance athletes had a pursed lip breathing pattern and distinct wheeze (onset earlier in -15℃ and -20℃) compared to others. It is likely that the cold pressor is associated with facial cooling3 and that the large decrease in airway temperature when breathing cold air (-19℃) at high flow rates37 affects these cold air athletes to a greater magnitude than non-cold air HVAs.
Reported symptoms were fewer in the HVA group overall and individually compared to LVA participants. Previous research has shown that HVA athletes report higher incidences of respiratory symptoms during exercise based on a retrospective questionnaire for exercise history.838 However, no previous research has compared the acute influence of cold air exercise sufficient to induce symptoms in HVAs vs LVAs until now. There was a wide range of symptoms experienced for each group (0-11 for the LVA and 0-6 for the HVA) expressed in relative terms, showing that the LVA group had 4.1 symptoms per person compared to the HVA group (2.8 symptoms). This symptom data contrasts the expected response based on previous research where HVA individuals have more symptoms8 and BHR due to training and competition ventilation requirements.2638 Thus, although speculative, it seems likely that acute response to intense cold air exercise may cause more symptoms in LVA compared to HVA individuals. Further research with a larger cohort of LVA and HVA athletes should examine the occurrence of symptoms post intense exercise sufficient to induce hyperpnea in both warm and cold air conditions.
The exertional data provides additional insight into the influence of cold air exercise on perceived effort. Similar to other studies investigating high intensity exercise and respiratory function,31 our participants were close to their maximum heart rate (mean heart rate was 95%, 95%, 94%, 93%, and 93% of heart rate max during the 8-minute stage at 0℃, -5℃, -10℃, -15℃, and -20℃ cold air trials, respectively). Exercise heart rate at intensities between 92%-97% has been described as severe intensity with an associated blood lactate concentration ranging from 6 to 10 mmol/L.39 This suggests that participants were above the respiratory compensation threshold (typically between 85%-90% of heart rate max in well trained runners;40 thus, hyperpnea was likely induced in each cold air trial. Interestingly, heart rate was significantly lower at the colder temperatures (Table 2) probably due to the cutaneous vasoconstriction cascade41 where increased stroke volume and depressed heart rate have been found at rest.42 Mechanisms by which this cascade shifts local muscle metabolism to a greater anaerobic condition at colder temperatures remain to be determined; however, a shift in metabolism would explain the greater acute effort (Borg scale RPE) and global effort (session based RPE) as shown in Table 2. Others have shown reduced VO2 in severe cold and reduced time to fatigue, suggesting a shift to reduced economy (velocity/L of oxygen consumption) and surmising that this reduced economy occurs around -15℃.4643 In this project, O2 cost was not measured directly, and thus we could not directly determine how energy metabolism for the same given intensity shifted at colder temperatures. However, the reduced heart rate in combination with increased acute effort and post effort evaluation (session based RPE) suggests that anaerobic energy is increased at colder temperatures.
Exercise in progressively colder temperatures increased bronchoconstriction in physically active females who participated in high or low ventilation sports. The magnitude of constriction as measured by FEF25-75 and FEF50 was greater in HVAs especially at a temperature of -15℃ and -20℃. This is in keeping with others whom have found that EIB magnitude is greater in temperatures lower than -15℃. Furthermore, the frequency of post exertional symptoms increased significantly at -15℃ and -20℃ and symptoms of cough, chest tightness, and sore throat were reported more often at cold temperatures, which have been linked to cold air inhalation.29
From the viewpoint of physical activity, exercise in the cold in healthy females may cause bronchoconstriction and females participating in lower ventilation activities may be more susceptible to EIB and post-exercise symptoms. Based on this research, it is likely that, upon cessation of exercise, respiratory function should recover within 20 minutes in an indoor environment. Further work is required to understand the best post exertion environment; however, low humidity normal room temperature is probably better based on previous research.35 It is recommended that covering the mouth and reducing temperatures to lower than -15℃ will be effective preventative measures to reduce EIB and symptoms for both acute and chronic influence of cold weather exercise. Finally, these results are applicable to healthy female adults. Such results that can be applied to adult males, children, and youth sport participants remain to be determined and should be the focus of future research.

Notes

There are no financial or other issues that might lead to conflict of interest.

References

1. Bergeron MF, Bahr R, Bärtsch P, Bourdon L, Calbet JA, Carlsen KH, et al. International Olympic Committee consensus statement on thermoregulatory and altitude challenges for high-level athletes. Br J Sports Med. 2012; 46:770–779. PMID: 22685119.
crossref
2. Carlsen KH. Sports in extreme conditions: the impact of exercise in cold temperatures on asthma and bronchial hyper-responsiveness in athletes. Br J Sports Med. 2012; 46:796–799. PMID: 22906782.
crossref
3. Koskela HO. Cold air-provoked respiratory symptoms: the mechanisms and management. Int J Circumpolar Health. 2007; 66:91–100. PMID: 17515249.
crossref
4. Quirion A, Laurencelle L, Paulin L, Therminarias A, Brisson GR, Audet A, et al. Metabolic and hormonal responses during exercise at 20 degrees, 0 degrees and -20 degrees C. Int J Biometeorol. 1989; 33:227–232. PMID: 2613366.
5. Larsson K, Tornling G, Gavhed D, Müller-Suur C, Palmberg L. Inhalation of cold air increases the number of inflammatory cells in the lungs in healthy subjects. Eur Respir J. 1998; 12:825–830. PMID: 9817153.
crossref
6. Stensrud T, Berntsen S, Carlsen KH. Exercise capacity and exercise-induced bronchoconstriction (EIB) in a cold environment. Respir Med. 2007; 101:1529–1536. PMID: 17317135.
crossref
7. Stensrud T, Mykland KV, Gabrielsen K, Carlsen KH. Bronchial hyperresponsiveness in skiers: field test versus methacholine provocation? Med Sci Sports Exerc. 2007; 39:1681–1686. PMID: 17909392.
8. Parsons JP, Kaeding C, Phillips G, Jarjoura D, Wadley G, Mastronarde JG. Prevalence of exercise-induced bronchospasm in a cohort of varsity college athletes. Med Sci Sports Exerc. 2007; 39:1487–1492. PMID: 17805078.
crossref
9. Strauss RH, McFadden ER Jr, Ingram RH Jr, Jaeger JJ, Stearns DR. Enhancement of exercise-induced asthma by cold air. N Engl J Med. 1977; 297:743–747. PMID: 895804.
crossref
10. Anderson SD, Daviskas E. The mechanism of exercise-induced asthma is …. J Allergy Clin Immunol. 2000; 106:453–459. PMID: 10984363.
crossref
11. Turmel J, Bougault V, Boulet LP. Seasonal variations of cough reflex sensitivity in elite athletes training in cold air environment. Cough. 2012; 8:2. PMID: 22449054.
crossref
12. Bougault V, Turmel J, Boulet LP. Bronchial challenges and respiratory symptoms in elite swimmers and winter sport athletes: airway hyperresponsiveness in asthma: its measurement and clinical significance. Chest. 2010; 138:31S–37S. PMID: 20363843.
13. Eichner ER. Asthma in athletes: scope, risks, mimics, trends. Curr Sports Med Rep. 2008; 7:118–119. PMID: 18477865.
14. Rundell KW, Im J, Mayers LB, Wilber RL, Szmedra L, Schmitz HR. Self-reported symptoms and exercise-induced asthma in the elite athlete. Med Sci Sports Exerc. 2001; 33:208–213. PMID: 11224807.
crossref
15. Rundell KW, Wilber RL, Szmedra L, Jenkinson DM, Mayers LB, Im J. Exercise-induced asthma screening of elite athletes: field versus laboratory exercise challenge. Med Sci Sports Exerc. 2000; 32:309–316. PMID: 10694112.
crossref
16. Langdeau JB, Day A, Turcotte H, Boulet LP. Gender differences in the prevalence of airway hyperresponsiveness and asthma in athletes. Respir Med. 2009; 103:401–406. PMID: 19027280.
crossref
17. McClaran SR, Harms CA, Pegelow DF, Dempsey JA. Smaller lungs in women affect exercise hyperpnea. J Appl Physiol (1985). 1998; 84:1872–1881. PMID: 9609779.
crossref
18. Miller MR, Hankinson J, Brusasco V, Burgos F, Casaburi R, Coates A, et al. Standardisation of spirometry. Eur Respir J. 2005; 26:319–338. PMID: 16055882.
19. Borg GA. Psychophysical bases of perceived exertion. Med Sci Sports Exerc. 1982; 14:377–381. PMID: 7154893.
crossref
20. Stensrud T, Carlsen KH. Can one single test protocol for provoking exercise-induced bronchoconstriction also be used for assessing aerobic capacity? Clin Respir J. 2008; 2:47–53. PMID: 20298304.
crossref
21. Castellani JW, Young AJ, Ducharme MB, Giesbrecht GG, Glickman E, Sallis RE, et al. American College of Sports Medicine position stand: prevention of cold injuries during exercise. Med Sci Sports Exerc. 2006; 38:2012–2029. PMID: 17095937.
22. Heir T, Oseid S. Self-reported asthma and exercise-induced asthma symptoms in high-level competitive cross-country skiers. Scand J Med Sci Sports. 1994; 4:128–133.
crossref
23. Herman L, Foster C, Maher MA, Mikat RP, Porcari JP. Validity and reliability of the session RPE method for monitoring exercise training intensity. South Afr J Sports Med. 2006; 18:14–17.
crossref
24. Pellegrino R, Viegi G, Brusasco V, Crapo RO, Burgos F, Casaburi R, et al. Interpretative strategies for lung function tests. Eur Respir J. 2005; 26:948–968. PMID: 16264058.
25. Rundell KW, Slee JB. Exercise and other indirect challenges to demonstrate asthma or exercise-induced bronchoconstriction in athletes. J Allergy Clin Immunol. 2008; 122:238–246. PMID: 18678339.
crossref
26. Holzer K, Brukner P. Screening of athletes for exercise-induced bronchoconstriction. Clin J Sport Med. 2004; 14:134–138. PMID: 15166901.
crossref
27. Cappaert TA, Stone JA, Castellani JW, Krause BA, Smith D, Stephens BA, et al. National Athletic Trainers' Association position statement: environmental cold injuries. J Athl Train. 2008; 43:640–658. PMID: 19030143.
crossref
28. Evans TM, Rundell KW, Beck KC, Levine AM, Baumann JM. Airway narrowing measured by spirometry and impulse oscillometry following room temperature and cold temperature exercise. Chest. 2005; 128:2412–2419. PMID: 16236903.
crossref
29. Farley RD, Albazzaz MK, Patel KR. Role of cooling and drying in hyperventilation induced asthma. Thorax. 1988; 43:289–294. PMID: 3406916.
crossref
30. Helenius IJ, Tikkanen HO, Sarna S, Haahtela T. Asthma and increased bronchial responsiveness in elite athletes: atopy and sport event as risk factors. J Allergy Clin Immunol. 1998; 101:646–652. PMID: 9600502.
31. Rundell KW, Spiering BA, Baumann JM, Evans TM. Effects of montelukast on airway narrowing from eucapnic voluntary hyperventilation and cold air exercise. Br J Sports Med. 2005; 39:232–236. PMID: 15793094.
crossref
32. Stensrud T, Berntsen S, Carlsen KH. Humidity influences exercise capacity in subjects with exercise-induced bronchoconstriction (EIB). Respir Med. 2006; 100:1633–1641. PMID: 16446080.
crossref
33. Cole P. Further observations on the conditioning of respiratory air. J Laryngol Otol. 1953; 67:669–681. PMID: 13109356.
crossref
34. Carlsen KH, Engh G, Mørk M. Exercise-induced bronchoconstriction depends on exercise load. Respir Med. 2000; 94:750–755. PMID: 10955749.
crossref
35. McFadden ER Jr, Lenner KA, Strohl KP. Postexertional airway rewarming and thermally induced asthma. New insights into pathophysiology and possible pathogenesis. J Clin Invest. 1986; 78:18–25. PMID: 3722374.
crossref
36. Kippelen P, Anderson SD. Airway injury during high-level exercise. Br J Sports Med. 2012; 46:385–390. PMID: 22247295.
crossref
37. McFadden ER Jr, Pichurko BM, Bowman HF, Ingenito E, Burns S, Dowling N, et al. Thermal mapping of the airways in humans. J Appl Physiol (1985). 1985; 58:564–570. PMID: 3980358.
crossref
38. Parsons JP, Mastronarde JG. Exercise-induced bronchoconstriction in athletes. Chest. 2005; 128:3966–3974. PMID: 16354868.
crossref
39. Sylta Ø, Tønnessen E, Seiler S. Do elite endurance athletes report their training accurately? Int J Sports Physiol Perform. 2014; 9:85–92. PMID: 23921186.
crossref
40. Esteve-Lanao J, San Juan AF, Earnest CP, Foster C, Lucia A. How do endurance runners actually train? Relationship with competition performance. Med Sci Sports Exerc. 2005; 37:496–504. PMID: 15741850.
crossref
41. Stocks JM, Taylor NA, Tipton MJ, Greenleaf JE. Human physiological responses to cold exposure. Aviat Space Environ Med. 2004; 75:444–457. PMID: 15152898.
42. Raven PB, Niki I, Dahms TE, Horvath SM. Compensatory cardiovascular responses during an environmental cold stress, 5 degrees C. J Appl Physiol. 1970; 29:417–421. PMID: 5459907.
crossref
43. Sandsund M, Faerevik H, Reinertsen RE, Bjermer L. Effects of breathing cold and warm air on lung function and physical performance in asthmatic and nonasthmatic athletes during exercise in the cold. Ann N Y Acad Sci. 1997; 813:751–756. PMID: 9100966.
crossref
Fig. 1

Delta maximum decrease for FEV1 (A), FVC (B), FEF25-75 (C), and FEF50 (D) at GXT (ambient laboratory temperature 23℃; relative humidity 50%), 0℃, -5℃, -10℃, -15℃, and -20℃ (relative humidity 40%). FEV1, forced expiratory volume in 1 second; FVC, forced vital capacity; FEF25-75, forced expiratory flow at 25%-75%; FEF50, forced expiratory flow at 50%; GXT, graded exercise test.

aair-10-43-g001
Fig. 2

Delta change for FEV1 at each time point at each temperature condition expressed as percent change from pre-test baseline. Results are mean±SD (n=17) and significance was set at P<0.05. FEV1, forced expiratory volume in 1 second; SD, standard deviation. A, 3 minutes 0℃ and -20℃ diff; B, -10℃ and -20℃ diff (P<0.05); GXT=0.01, pairwise comparisons with differences as follows. *3 minutes diff than 10, 15, 20 minutes, 20 minutes diff than 6, 10 and 15 minutes; 0℃=0.01, pairwise comparisons with differences as follows; β20 minutes diff than 3 and 6 minutes; -5℃=0.08, pairwise comparisons with differences as follows; *3 diff than 20 minutes; α6 minutes diff than 15 and 20 minutes; -10℃=0.00, pairwise comparisons with differences as follows: Δ3, 6, and 10 minutes diff than 15 and 20 minutes; -15℃=0.00, pairwise comparisons with differences as follows: Ω3 minutes diff than 6, 15, and 20 minutes; µ20 minutes diff 15, 10, and 6 minutes; -20℃=0.03, pairwise comparisons with differences as follows: ¥3 minutes diff than 10 and 20 minutes; £6 minutes and 20 minutes diff.

aair-10-43-g002
Table 1

Baseline subject characteristics taken from the GXT

aair-10-43-i001
Variable (N=17) Values Range
Age (year) 22±3 18–29
Height (cm) 167±6 151–182
Weight (kg) 61±8 41–72
BMI 21.7±2.5 16.8–25.8
FEV1 (L · min-1) 3.68±0.49 2.73–4.50
FEV1 (% predicted) 106±12 88–137
FVC (L) 4.40±0.63 3.24–5.59
FVC (% predicted) 119±15 94–151
FEV1/FVC ratio 84.8±4.4 76.0–94.8
FEV1/FVC ratio (% predicted) 100±5 91–110
FEF25-75 (L · min-1) 4.02±0.69 3.24–5.59
FEF50 (L · min-1) 4.61±0.78 3.37–5.77
VO2max (mL · kg-1 · min-1) 49.6±6.6 41.2–70.5

Data reported as mean±SD and range reported as minimum-maximum value for each measure. Spirometry taken as pre-test values taken after participant had completed all questionnaires on that first visit.

GXT, graded exercise test; BMI, body mass index; FEV1, forced expiratory volume in 1 second; FVC, forced vital capacity; FEF25-75, forced expiratory flow at 25%-75%; FEF50, forced expiratory flow at 50%; VO2max, measure of the maximum volume of oxygen; SD, standard deviation.

Table 2

Distance run (meters), mean heart rate (beats/min), mean acute effort (RPE), global effort assessed post-exercise (session based RPE), and respiratory symptoms (frequency of different reported symptoms reported in the 24 hours post-exercise at that temperature) at each temperature

aair-10-43-i002
Variable 0℃ −5℃ −10℃ −15℃ −20℃ P
Distance (meter) 1,456.5±166.2 (1,185.0–1,866.0) 1,451.6±166.8 (1,150.0–1,866.0) 1,457.9±160.1 (1,200.0–1,866.0) 1,450.9±160.3 (1,200.0–1,866.0) 1,448.1±166.3 (1,200.0–1,866.0) n.s (0.57)
Heart rate (beats/min) 185.9±9.6 (163.0–199.9) 185.9±8.4 (171–200.6) 184.8±8.9 (165.5–201.9) 182.5±9.4 (164.6–200.0) 183.6±8.9 (163.6–197.9) 0.01
Acute effort (RPE) 16.8±1.0 (15.1–19.1) 16.8±1.0 (14.9–18.6) 17.0±1.0 (15.6–18.8) 16.9±1.1 (14.5–18.6) 17.3±1.1 (14.8–19.2) n.s (0.17)
Global effort (session RPE) 6.6±1.9 (3.0–10.0) 7.2±2.1 (3.0–10.0) 7.3±2.0 (3.0–10.0) 7.6±2.0 (3.0–10.0) 7.9±1.9 (3.0–10.0) n.s (0.06)
Respiratory symptoms (frequency) 1.2±1.2 (0–4.0) 1.0±1.1 (0.0–3.0) 1.9±1.2 (0.0–5.0) 2.3±1.3 (0.0–5.0) 2.9±1.0 (1.0–5.0) 0.00
EIB severity Percent decrease in FEV1 in each category of EIB severity at each temperature (frequency)*
Range (minimum to maximum) −14.8 to 0.52 −15.7 to 0.3 −16.9 to 2.0 −13.0 to 2.6 −25.3 to 2.5
Normal (0 to <10%) 15 15 15 14 14
Mild (≥10 to <25%) 2 2 2 3 2
Moderate (≥25 to <50%) 0 0 0 0 1
Severe (≥50%) 0 0 0 0 0

Data reported as mean±SD for all measures except respiratory symptoms (frequency) with associated ranges (minimum-maximum) for each measure at each temperature (0℃, -5℃, -10℃, 15℃, and -20℃).

RPE, rating of perceived exertion; EIB, exercise-induced bronchoconstriction; FEV1, forced expiratory volume in 1 second; SD, standard deviation.

*Based on proposed classification of (Price, Hull, & Ansley, 2014) Significance set at P<0.05; -15℃ different than 0℃, -5℃, -10℃, and -5℃ different than -20℃; -15℃ different than 0℃, -5℃, -20℃, and -10℃ different than -5℃.

Table 3

Group mean±SD (expressed as % reduction from pre-trial value) with 95% CI for high ventilation (n=8) and low ventilation participants (n=9) for FEV1, FEF25-75, and FEF50 at each condition (Laboratory test, 0℃, -5℃, -10℃, -15℃, and -20℃)

aair-10-43-i003
Variable High ventilation Low ventilation
Mean±SD Lower bound Upper bound Mean±SD Lower bound Upper bound
FEV1 GXT* −2.9±3.3 −5.7 −0.2 −4.8±3.2 −2.4 −7.3
0℃ −6.3±4.4 −10.0 −2.6 −3.4±4.1 −0.2 −6.6
−5℃ −4.6±4.8 −8.6 −0.6 −4.1±4.0 −1.0 −7.2
−10℃ −5.5±3.5 −8.5 −2.6 −3.3±5.5 0.9 −7.5
−15℃ −5.1±5.6 −9.8 −0.4 −4.9±3.2 −2.4 −7.4
−20℃ −8.3±9.4 −16.2 −0.5 −5.9±5.9 −1.3 −10.4
FEF25-75 GXT* 2.1±9.9 −6.2 10.4 −5.9±9.3 1.3 −13.1
0℃ −8.3±7.7 −14.7 −1.8 −5.0±11.2 3.6 −13.5
−5℃ −0.2±9.9 −8.5 8.0 −4.7±13.4 5.6 −15.0
−10℃ −6.8±12.1 −16.8 3.3 −4.3±15.3 7.5 −16.1
−15℃ −12.6±12.6 −23.2 −2.1 −2.6±10.0 5.1 −10.3
−20℃ −17.6±19.9 −34.2 −0.9 −5.9±15.1 5.7 −17.5
FEF50 GXT* 1.3±14.5 −10.8 13.4 −3.5±10.9 −11.8 4.9
0℃ −4.5±7.6 −10.8 1.9 −4.9±9.5 −12.2 2.3
−5℃ 1.7±10.5 −7.0 10.5 −1.8±13.0 −11.8 8.2
−10℃ −3.6±14.0 −15.3 8.2 −5.0±13.4 −15.3 5.3
−15℃ −9.1±9.1 −16.7 −1.5 −4.2±9.5 −11.5 3.1
−20℃ −17.6±23.9 −37.6 2.4 −9.6±13.7 −20.2 0.9

There were no significant differences between groups.

SD, standard deviation; CI, confidence interval; FEV1, forced expiratory volume in 1 second; FEF25-75, forced expiratory flow at 25%-75%; FEF50, forced expiratory flow at 50%; GXT, graded exercise test; VO2max, measure of the maximum volume of oxygen.

*GXT is VO2max laboratory test performed in ambient laboratory conditions (22℃, 40% relative humidity).

TOOLS
Similar articles