

 PDF
PDF ePub
ePub Citation
 Print
Print


Abstract
Purpose
Asthma is one of the most common chronic conditions, and its prevalence has been increasing in recent decades. Social economic status is a well-known risk factor for asthma. This study was performed to investigate the relationship between social economic status and asthma in Korean children.
Methods
Data were acquired from 4,397 children, aged under 18 years who participated in the Fifth Korea National Health and Nutrition Examination Surveys, which was conducted from 2010 to 2012. The presence of asthma was based on self-reported, physician-diagnosed asthma in the Health Interview Surveys.
Results
The prevalence of pediatric asthma was 5.3%, while the prevalence of atopic dermatitis in children was 14.0%. In univariate analysis, asthmatic children tended to be male, to be older, to have asthmatic mothers, to suffer from atopic dermatitis and to live in urban areas (P<0.05). The parents’ marital status, employment status, education level, and the number of household members were not associated with pediatric asthma. In logistic regression analysis, older age, male sex, maternal asthma, pediatric atopic dermatitis, and urban residence were associated with a higher prevalence of childhood asthma (P<0.01).
Conclusion
Socioeconomic status was not an important risk factor for asthma in Korean children in our study. It is conceivable that socioeconomic factor could affect the asthma prevalence in a different manner in each country. Further studies are warranted to ex-plore mechanisms responsible for the association between socioeconomic status and asthma in children.
Go to : 
REFERENCES
1. Backman H, Raisanen P, Hedman L, Stridsman C, Andersson M, Lind-berg A, et al. Increased prevalence of allergic asthma from 1996 to 2006 and further to 2016-results from three population surveys. Clin Exp Allergy. 2017; 47:1426–35.

2. Lundback B, Backman H, Lotvall J, Ronmark E. Is asthma prevalence still increasing? Expert Rev Respir Med. 2016; 10:39–51.
3. Lee SI. Prevalence of childhood asthma in Korea: international study of asthma and allergies in childhood. Allergy Asthma Immunol Res. 2010; 2:61–4.
4. Kim SY, Jung JY, Park MS, Kang YA, Kim EY, Kim SK, et al. Increased prevalence of self-reported asthma among Korean adults: an analysis of KNHANES I and IV data. Lung. 2013; 191:281–8.
5. Guarnieri M, Balmes JR. Outdoor air pollution and asthma. Lancet. 2014; 383:1581–92.
6. Ahluwalia SK, Matsui EC. The indoor environment and its effects on childhood asthma. Curr Opin Allergy Clin Immunol. 2011; 11:137–43.
7. Eder W, von Mutius E. Hygiene hypothesis and endotoxin: what is the evidence? Curr Opin Allergy Clin Immunol. 2004; 4:113–7.
8. Kuo CH, Kuo HF, Huang CH, Yang SN, Lee MS, Hung CH. Early life exposure to antibiotics and the risk of childhood allergic diseases: an update from the perspective of the hygiene hypothesis. J Microbiol Immunol Infect. 2013; 46:320–9.
9. Litonjua AA, Carey VJ, Weiss ST, Gold DR. Race, socioeconomic factors, and area of residence are associated with asthma prevalence. Pediatr Pulmonol. 1999; 28:394–401.
10. Georgy V, Fahim HI, El-Gaafary M, Walters S. Prevalence and socioeconomic associations of asthma and allergic rhinitis in northern [corrected] Africa. Eur Respir J. 2006; 28:756–62.
11. Odhiambo JA, Ng'ang'a LW, Mungai MW, Gicheha CM, Nyamwaya JK, Karimi F, et al. Urban-rural differences in questionnaire-derived markers of asthma in Kenyan school children. Eur Respir J. 1998; 12:1105–12.
12. Woods RK, Burton DL, Wharton C, McKenzie GH, Walters EH, Comino EJ, et al. Asthma is more prevalent in rural New South Wales than metropolitan Victoria, Australia. Respirology. 2000; 5:257–63.
13. Yemaneberhan H, Bekele Z, Venn A, Lewis S, Parry E, Britton J. Prevalence of wheeze and asthma and relation to atopy in urban and rural Ethiopia. Lancet. 1997; 350:85–90.
14. Zhang X, Morrison-Carpenter T, Holt JB, Callahan DB. Trends in adult current asthma prevalence and contributing risk factors in the United States by state: 2000-2009. BMC Public Health. 2013; 13:1156.
15. Harju M, Keski-Nisula L, Georgiadis L, Raatikainen K, Raisanen S, Hei-nonen S. Maternal socioeconomic status and the risk of asthma among offspring. BMC Public Health. 2015; 15:27.
16. Wen HJ, Chiang TL, Lin SJ, Guo YL. Predicting risk for childhood asthma by pre-pregnancy, perinatal, and postnatal factors. Pediatr Allergy Immunol. 2015; 26:272–9.
17. Xu R, DeMauro SB, Feng R. The impact of parental history on children's risk of asthma: a study based on the National Health and Nutrition Examination Survey-III. J Asthma Allergy. 2015; 8:51–61.
18. Rodriguez MA, Winkleby MA, Ahn D, Sundquist J, Kraemer HC. Identification of population subgroups of children and adolescents with high asthma prevalence: findings from the Third National Health and Nutrition Examination Survey. Arch Pediatr Adolesc Med. 2002; 156:269–75.
19. Almqvist C, Worm M, Leynaert B. working group of GA2LEN WP 2.5 Gender. Impact of gender on asthma in childhood and adolescence: a GA2LEN review. Allergy. 2008; 63:47–57.
20. Jie Y, Isa ZM, Jie X, Ju ZL, Ismail NH. Urban vs. rural factors that affect adult asthma. Rev Environ Contam Toxicol. 2013; 226:33–63.
21. Krieger J, Jacobs DE, Ashley PJ, Baeder A, Chew GL, Dearborn D, et al. Housing interventions and control of asthma-related indoor biologic agents: a review of the evidence. J Public Health Manag Pract. 2010; 16(5 Suppl):S11–20.
22. Downs SH, Marks GB, Mitakakis TZ, Leuppi JD, Car NG, Peat JK. Having lived on a farm and protection against allergic diseases in Australia. Clin Exp Allergy. 2001; 31:570–5.
23. Naleway AL. Asthma and atopy in rural children: is farming protective? Clin Med Res. 2004; 2:5–12.
24. Riedler J, Eder W, Oberfeld G, Schreuer M. Austrian children living on a farm have less hay fever, asthma and allergic sensitization. Clin Exp Allergy. 2000; 30:194–200.
25. Aligne CA, Auinger P, Byrd RS, Weitzman M. Risk factors for pediatric asthma. Contributions of poverty, race, and urban residence. Am J Respir Crit Care Med. 2000; 162(3 Pt 1):873–7.
26. Neidell MJ. Air pollution, health, and socioeconomic status: the effect of outdoor air quality on childhood asthma. J Health Econ. 2004; 23:1209–36.
27. Wilson J, Dixon SL, Breysse P, Jacobs D, Adamkiewicz G, Chew GL, et al. Housing and allergens: a pooled analysis of nine US studies. Environ Res. 2010; 110:189–98.
28. Camacho-Rivera M, Kawachi I, Bennett GG, Subramanian SV. Associations of neighborhood concentrated poverty, neighborhood racial/ethnic composition, and indoor allergen exposures: a cross-sectional analysis of los angeles households, 2006-2008. J Urban Health. 2014; 91:661–76.
29. Crump C, Winkleby MA, Sundquist J, Sundquist K. Risk of asthma in young adults who were born preterm: a Swedish national cohort study. Pediatrics. 2011; 127:e913–20.
30. Rosas-Salazar C, Ramratnam SK, Brehm JM, Han YY, Boutaoui N, Forno E, et al. Prematurity, atopy, and childhood asthma in Puerto Ricans. J Allergy Clin Immunol. 2014; 133:357–62.
31. Thakur N, Oh SS, Nguyen EA, Martin M, Roth LA, Galanter J, et al. Socioeconomic status and childhood asthma in urban minority youths. The GALA II and SAGE II studies. Am J Respir Crit Care Med. 2013; 188:1202–9.
32. Hawkins SS, Berkman L. Increased tobacco exposure in older children and its effect on asthma and ear infections. J Adolesc Health. 2011; 48:647–50.
33. Hedman L, Bjerg A, Sundberg S, Forsberg B, Ronmark E. Both environmental tobacco smoke and personal smoking is related to asthma and wheeze in teenagers. Thorax. 2011; 66:20–5.
34. Wang MF, Kuo SH, Huang CH, Chen YJ, Lin SH, Lee CJ, et al. Exposure to environmental tobacco smoke, human E-cadherin C-160A polymorphism, and childhood asthma. Ann Allergy Asthma Immunol. 2013; 111:262–7.
35. Farber HJ, Batsell RR, Silveira EA, Calhoun RT, Giardino AP. The Impact of tobacco smoke exposure on childhood asthma in a medicaid managed care plan. Chest. 2016; 149:721–8.
36. Jayes L, Haslam PL, Gratziou CG, Powell P, Britton J, Vardavas C, et al. SmokeHaz: systematic reviews and meta-analyses of the effects of smoking on respiratory health. Chest. 2016; 150:164–79.
37. Vardavas CI, Hohmann C, Patelarou E, Martinez D, Henderson AJ, Granell R, et al. The independent role of prenatal and postnatal exposure to active and passive smoking on the development of early wheeze in children. Eur Respir J. 2016; 48:115–24.
38. Caraballo RS, Giovino GA, Pechacek TF, Mowery PD. Factors associated with discrepancies between self-reports on cigarette smoking and measured serum cotinine levels among persons aged 17 years or older: Third National Health and Nutrition Examination Survey, 1988-1994. Am J Epidemiol. 2001; 153:807–14.
39. Vartiainen E, Seppala T, Lillsunde P, Puska P. Validation of self reported smoking by serum cotinine measurement in a community-based study. J Epidemiol Community Health. 2002; 56:167–70.
40. Jung-Choi KH, Khang YH, Cho HJ. Hidden female smokers in Asia: a comparison of self-reported with cotinine-verified smoking prevalence rates in representative national data from an Asian population. Tob Control. 2012; 21:536–42.
Go to :
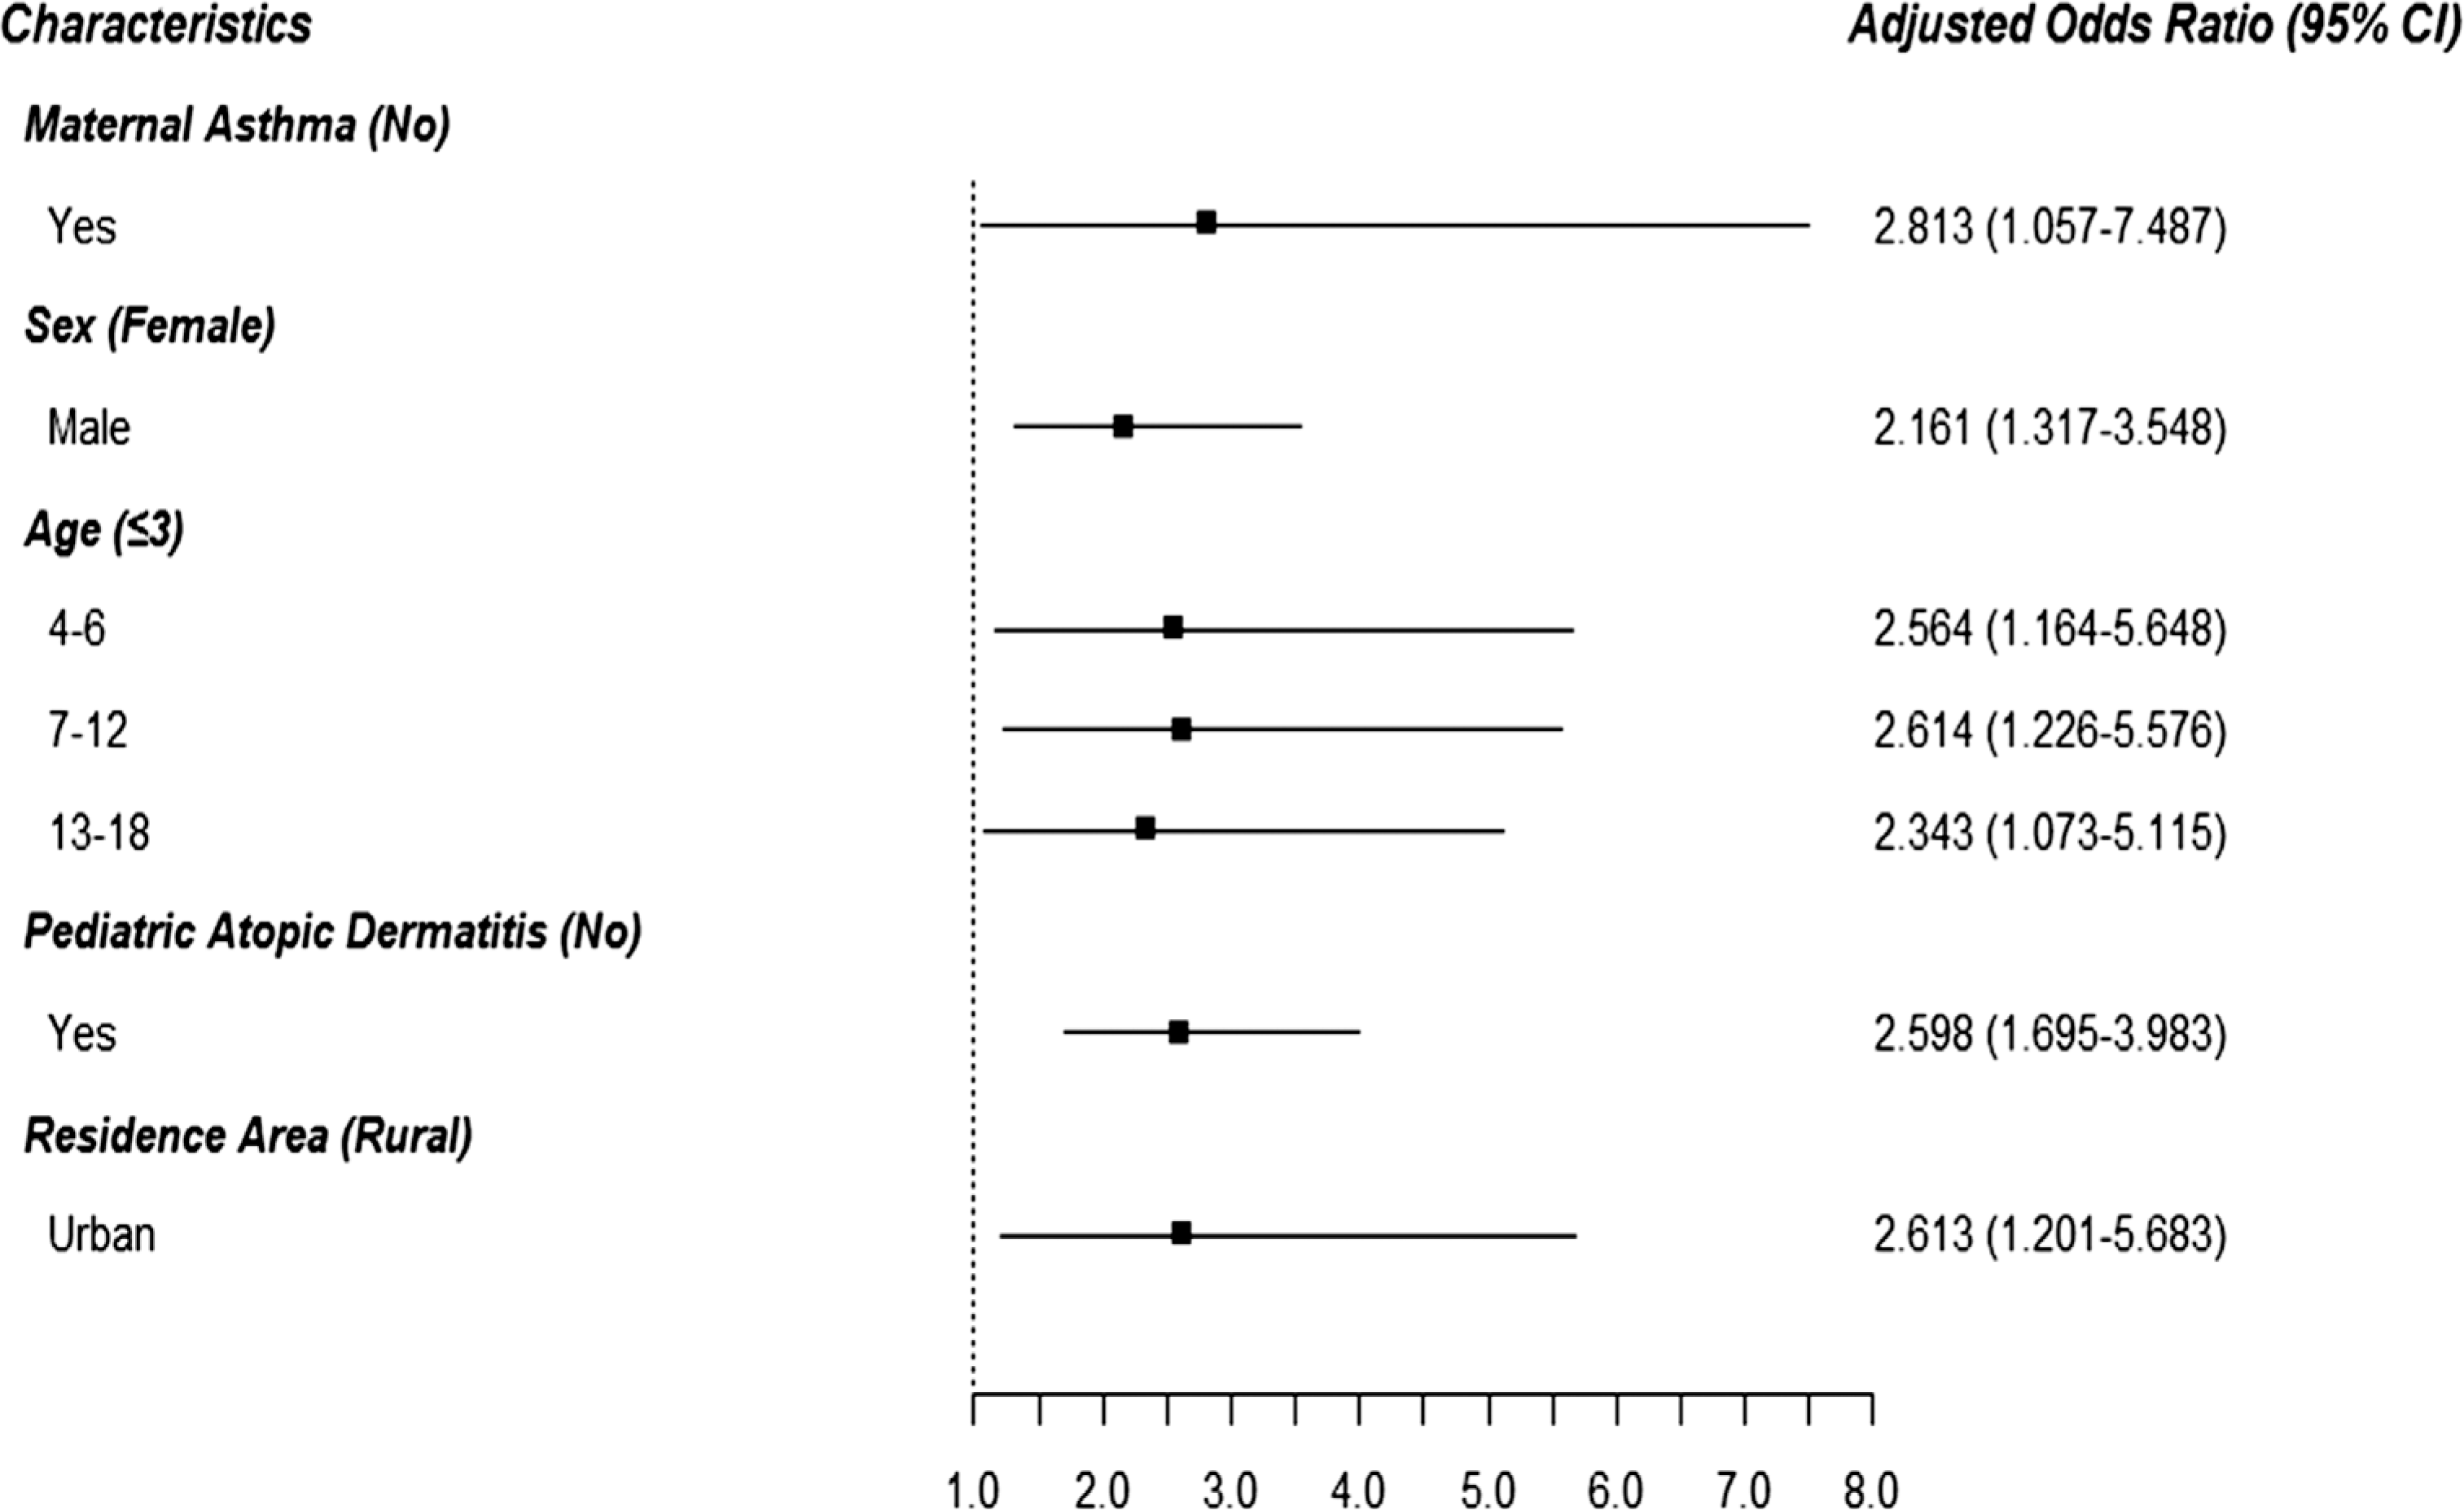 | Fig. 1.Adjusted odds ratios and 95% confidence intervals (CI) for the prevalence of pediatric asthma. Odd ratios for the prevalence of pediatric asthma were adjusted for maternal asthma, children's sex, children's age, pediatric atopic dermatitis, and residence area in the Korean National Health and Nutrition Examination Survey (KNHANES) 2010–2012. |
Table 1.
Baseline characteristics of parents and children
Table 2.
Demographic characteristics according to the presence of pediatric asthma
 XML Download