

 PDF
PDF ePub
ePub Citation
 Print
Print


INTRODUCTION
Cachexia is a wasting disorder that occurs secondarily in patients with chronic diseases such as cancer, congestive heart failure (CHF), and chronic kidney disease [1]. The prevalence of cachexia among patients with cancer is about 50% to 80% [2] and is characterized by involuntary loss of skeletal muscle (with or without loss of fat mass), reduced food intake, and negative energy balance [13]. It is distinct from age-related muscle loss or malnutrition in that it cannot be reversed by increasing nutritional intake, since metabolic dysfunction and increased catabolism play roles in the pathogenesis of cancer cachexia [45].
Parathyroid hormone-related peptide (PTHrP) plays a number of paracrine roles in many tissues under normal conditions [6]. However, when it is secreted by a tumor and enters the circulation, it stimulates bone resorption, leading to hypercalcemia of malignancy [7]. Furthermore, recent studies revealed that PTHrP plays an important role in cancer cachexia by activating thermogenesis via adipose tissue browning, while neutralization of PTHrP blocked wasting of fat and skeletal muscle in mice models with cancer [8].
Previously, we demonstrated that PTHrP was associated with weight loss (WL) in cancer patients, suggesting that PTHrP may be a predictor of cancer cachexia [9]. In this study, we further investigated whether prediction of WL by PTHrP is influenced by other factors such as serum albumin, corrected calcium levels, cancer stage, and performance status (PS).
METHODS
Study design and population
The study population was derived from the SECRET (SEverance CanceR cachExia neTwork) cohort, who were patients treated at a medical oncology department at Severance Hospital, Yonsei University College of Medicine (a tertiary-level cancer treatment center), as previously described [9]. Adults >18 years of age whose serum PTHrP levels were measured between November 2005 and June 2014 (n=624) were considered for inclusion; excluded were patients with missing serum albumin or corrected calcium values and those whose body weight (BW) was not measured repeatedly during the follow-up period. A total of 219 eligible subjects were included in the analysis, with a median follow-up period of 327 days for BW changes (interquartile range [IQR], 188 to 423 days).
Subjects were classified into two groups by serum albumin levels (≥3.7 or <3.7 g/dL), corrected calcium levels (<10.5 or ≥10.5 mg/dL), cancer stage (stage 1 to 3 or stage 4), or PS (Eastern Cooperative Oncology Group [ECOG] 0 to 1 or 2 to 4), respectively. This study was approved by the Institutional Review Board of the Yonsei University Health System, Severance Hospital (No. 4-2015-0246). Informed consent was exempted because personal identifying information was not accessed.
Measurements of clinical and laboratory parameters
Baseline data including age, sex, cancer stage, ECOG PS, and comorbidities such as CHF, chronic obstructive pulmonary disease, diabetes mellitus, and liver cirrhosis were examined through electronic medical records review. Cancer stage was defined according to the American Joint Committee on cancer stage grouping (stage I, II, III, and IV).
Serum PTHrP was quantified by means of immunoradiometric assay (IRMA; Allegro IRMA, Nichols Institute, San Juan Capistrano, CA, USA) [10] with a detection limit of 0.5 pmol/L. Serum calcium, phosphate, albumin, and hemoglobin were measured by standard techniques. Corrected calcium was calculated according to the formula: measured serum calcium+[0.8×(4.0−albumin [g/dL] if serum albumin <4.0)]. Serum creatinine and C-reactive protein (CRP) were examined by Hitachi 7600-110 automated chemistry analyzer (Hitachi Co., Tokyo, Japan). Estimated glomerular filtration rate was determined using Chronic Kidney Disease-Epidemiology Collaboration (CKD-EPI) equation [11].
Definition of weight loss
We measured BW at baseline PTHrP measurement and during follow-up. Body mass index (BMI) was calculated as BW divided by height squared (kg/m2). Lean body mass (LBM) and body fat mass (BFM) were calculated as: LBM (kg)=[9,270×weight (kg)/(6,680+216×BMI)] in males; [9,270×weight (kg)/(8,780+244×BMI)] in females [12]; BFM (%)=[(1.20×BMI)+(0.23×age)−16.2] in males; [(1.20×BMI)+(0.23×age)−5.4] in females [13]. BW change (% BW) was calculated as: [(follow-up weight-baseline weight)/baseline weight]×100. According to the international definition of cachexia [3], clinically meaningful WL was defined as % BW <−5% or baseline BMI <20 kg/m2 plus % BW <−2%.
Statistical analysis
All statistical analyses were performed using SPSS version 20.0 (IBM, Armonk, NY, USA). Baseline characteristics are reported as mean±standard deviation or number (percentage) of patients. Between-group differences were analyzed by independent t test or chi-square test. Change in BW from baseline to follow-up were presented as mean and 95% confidential interval (CI), and paired t test was used to analyze the difference between detailed subgroups. Kaplan-Meier survival curves were used to examine the WL probability in each subgroup and were compared by log-rank tests. The relative risk for WL by PTHrP level was further determined using a multivariate Cox regression model. For all tests, a P<0.05 was considered statistically significant.
RESULTS
Baseline characteristics
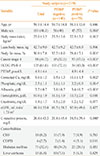
Baseline characteristics of the study population are described in Table 1. Participants were consisted of various cancers of the head and neck, respiratory, gastroesophageal, hepatopancreatobiliary, breast, genitourinary, and hematologic systems (Supplemental Table S1). The mean age was 59.1±14.4 years and 46.1% were male. When stratified by serum PTHrP levels, 140 (63.9%) were PTHrP negative and 79 (36.1%) were PTHrP positive, ranging from 1.1 to 107.0 pmol/L. PTHrP positive subjects showed significantly lower BMI and BFM compared to the negative group. Percentages of advanced cancer (stage 4) and poor PS (ECOG 2 to 4) were also higher in the PTHrP positive group. In laboratory findings, PTHrP positive patients had significantly higher corrected calcium, lower serum phosphate and albumin levels, and elevated CRP levels. Numbers of PTHrP positive patients by cancer sites are shown in Supplemental Table S2.
Comparison of body weight changes by PTHrP and baseline clinical factors
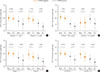
Fig. 1 shows BW changes during the follow-up period classified by serum albumin, calcium levels, cancer stage, and PS. When categorized by albumin levels, BW was reduced by 0.8% to 4.3% (Fig. 1A). WL was greatest in PTHrP positive subjects with hypoalbuminemia, while subjects with negative PTHrP and normal albumin levels experienced the least change in weight. Similar patterns were observed in calcium subgroups (Fig. 1B) and WL was more significant in PTHrP positive subjects regardless of serum corrected calcium levels. When grouped by cancer stage, the prevalence of WL was 0.2%, with the least in subjects with negative PTHrP and cancer stage 1 to 3 (Fig. 1C). In the other three groups, the WL was greater and the differences from baseline were more prominent in stage 4 PTHrP positive subjects. When categorized by PTHrP and PS (Fig. 1D), the pattern of reduced BW reduction showed similar pattern to the other groups.
Independent predictive value of PTHrP for weight loss by subgroup
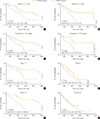
After a median follow-up of 327 days (IQR, 188 to 423), 74 subjects (33.8%) experienced clinically significant WL. To investigate whether prediction of WL by PTHrP is influenced by serum albumin, corrected calcium levels, cancer stage, or PS, further analyses were conducted. In Kaplan-Meier curves showing WL-free probability of each subgroup, PTHrP negative subjects had a 2- to 3-fold significantly better WL-free survival compared to PTHrP positive subjects irrespective of serum albumin, corrected calcium level, and cancer stage (log-rank, P<0.05) (Fig. 2A-F). In patients with stage 4 cancer, the difference was less pronounced, but still statistically significant. When stratified by PS, individuals with better functional capacity (ECOG 0 to 1) were the most influenced by the presence of PTHrP in predicting WL (hazard ratio [HR], 4.00; 95% CI, 3.34 to 20.60) (Fig. 2G). However, patients with poorer PS (ECOG 2 to 4) showed a generally low probability of WL-free survival compared to those who were ECOG 0 to 1, and were not affected by the presence of PTHrP (HR, 1.06; 95% CI, 0.56 to 2.01) (Fig. 2H).
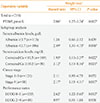
In multivariate Cox regression analysis adjusted for age, baseline BMI, serum albumin, corrected calcium level, cancer stage and PS (Table 2), the presence of PTHrP significantly predicted the WL (HR, 2.06; 95% CI, 1.27 to 3.34) in cancer patients. The effect of PTHrP on WL was more remarkable in subjects with lower albumin levels (HR, 2.49; 95% CI, 1.30 to 4.75), stage 4 cancer (HR, 2.17; 95% CI, 1.15 to 4.11), and better PS (HR, 2.62; 95% CI, 1.22 to 5.63). The effect of PTHrP on WL was attenuated with no statistical significance in normal albumin levels and stage 1 to 3 cancer patients. In addition, regardless of calcium levels, the effect of PTHrP on WL was maintained; however, hypercalcemia and PTHrP positivity showed additive effects on WL ([HR, 1.93; 95% CI, 1.10 to 3.37] and [HR, 3.12; 95% CI, 1.19 to 8.16], respectively).
DISCUSSION
In this study we investigated the differential impact of clinical and laboratory factors on PTHrP-related WL in patients with cancer. By detailed subgroup analyses, we revealed that lower albumin levels (<3.7 g/dL), hypercalcemia (≥10.5 mg/dL), and cancer stage 4 reinforced the effect of PTHrP on WL by 2- to 3- fold. Patients with good nutritional status (albumin ≥3.7 g/dL) or cancer stage 1 to 3 were not significantly affected by PTHrP. In addition, WL occurred within a short period of time in patients who required considerable assistance (ECOG 2 to 4), but the impact of PTHrP on WL was not significant.
Cancer cachexia has been known to negatively impact patients' quality of life, treatment outcome, and survival [4]. Patients with cachexia experience a reduced ability to tolerate chemotherapy or radiotherapy along with a decrease in physical functioning, which finally leads to increased morbidity and mortality and is attributable for 20% of cancer-related deaths [24]. Also, cachexia is associated with psychological stress and increased hospitalization stay and cost [414]. Therefore, while early recognition and proper interventions to delay or reduce the deleterious effects of cachexia are needed, cachexia remains largely under-recognized and untreated [1516].
In our study, the effect of PTHrP on cancer cachexia was potentiated in subjects with hypercalcemia (HR; hypercalcemia 3.12 vs. normocalcemia 1.93). As tumor burden worsened, production of tumor-derived inflammatory cytokines increased and likely collaborated with PTHrP to alter energy regulation into promoting loss of muscle and adipose tissue [17]. Likewise, as hypercalcemia occurs more frequently in widespread metastatic disease, or in the presence of tumor-produced substances such as prostaglandin or osteoclast activating factor [18], the interaction with PTHrP might aggravate wasting in these patients. A previous study also showed that injecting PTHrP produced different effects on WL according to underlying health conditions; healthy mice were not affected by PTHrP, while tumor-bearing mice experienced activation of atrophy-related genes and exacerbation of muscle wasting after PTHrP injection [8]. These findings support the notion that PTHrP action on cancer cachexia might depend on other tumor-derived factors. Also, as anorexia is more common in patients with advanced cancer, poor calorie intake with elevated PTHrP could aggravate cancer cachexia [5].
Regarding the role of nutritional support in cancer patients, the results are controversial [19202122]. A meta-analysis showed that oral nutritional supplements in malnourished cancer patients was helpful to increase fat mass or quality of life, but had no effect on mortality [19]. In contrast, other meta-analysis demonstrated that total parenteral nutrition in cancer patients was beneficial in reducing postoperative surgical complications and operative mortality [20], and some studies revealed that cancer patients with nutritional intervention experienced less WL after treatment [2122]. Although cachexia cannot be fully reversed by nutritional support, our study showed that the adverse effect of PTHrP was greater in patients with low albumin levels, an indication of nutritionally poor status. Therefore, early dietary counseling and proper nutritional supplementation in PTHrP positive individuals should be considered.
Poor PS group did not affected by PTHrP in predicting WL, which is contrary to other findings that PTHrP had a greater influence on patients with poor health status (stage 4 cancer, hypercalcemia, and hypoalbuminemia). There is no conclusive explanation, but PTHrP is thought to have no impact because PTHrP-associated wasting preceded the decline in PS. It is known that browning of adipose tissue and increased energy expenditure occurs in an early pathophysiology in cachexia [23], and that PTHrP is associated with thermogenesis in adipose tissue [8]. Also, there is a steep slope of WL-free probability in ECOG 2 to 4 subjects compared to ECOG 0 to 1 in our Kaplan-Meier curve (Fig. 2G, H), indicating that WL occurred within a shorter period of time by various factors stronger than PTHrP. Therefore, this study results should be limited to patients with good performance.
Our study has some limitations. First, due to the absence of data, we could not evaluate dietary intake, anorexia, or exercise, which can influence weight change. Second, laboratory findings and PS can change over time, but these changes are not reflected in our analyses. Third, as PTHrP is not a universal protein secreted from all types of cancer, our findings should be more focused on PTHrP-producing cancers, such as head and neck, respiratory system, hepatopancreatobiliary, breast, genitourinary, and hematologic malignancy. Despite these limitations, considering the importance of early recognition of cancer cachexia, these findings suggest that patients with certain characteristics are vulnerable to PTHrP-associated WL and may serve to facilitate a comprehensive management approach.
In summary, our results suggest that prediction of WL by PTHrP among patients with cancer might be affected by serum calcium or albumin levels, PS, and cancer stage. Early identification and management of cachexia is needed in PTHrP positive patients, especially those with advanced cancer stage accompanied by hypercalcemia or hypoalbuminemia.
 XML Download