INTRODUCTION
Osteoporosis is a skeletal disorder characterized by bone strength with a predisposition to fracture risk. The property of being able to accurately measure the risk of fracture is of critical importance in determining the appropriate cost thresholds for intervention.[
1] Different guidelines have been developed in different countries to identify treatment thresholds.[
2345678] However, there are noticeable differences between the approaches recommended by these guidelines.[
910]
The fracture-risk assessment tool (FRAX®) system was introduced by the World Health Organization (WHO) Collaboration Centre in Sheffield, United Kingdom, to estimate the 10-year hip and major osteoporotic fracture risk (hip, clinical spine, distal forearm, and proximal humerus).[
11] The FRAX® tool calculates the 10-year fracture risk with and without femoral neck (FN) bone mineral density (BMD) by combining 7 clinical risk factors (pre-fracture fragility, hip fracture of a parent, cigarette smoking, use of systemic glucocorticoids, excessive alcohol intake, body mass index (BMI), rheumatoid arthritis (RA) and other secondary causes) added to age and gender.[
1112] To standardize FRAX® scores, the National Osteoporosis Foundation (NOF) defined intervention threshold values by stating that pharmacological treatment should be started for major osteoporotic fractures at ≥20% and for hip fractures at ≥3%.[
12]
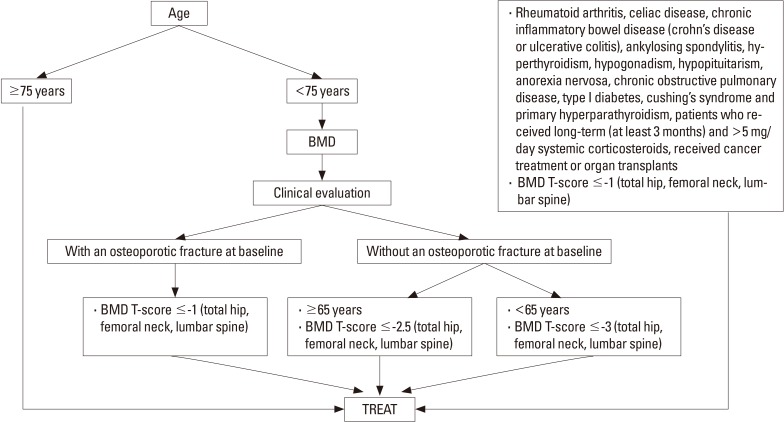
According to the most recent Healthcare Practices Statement (HPS) guidelines published in 2013 by the Turkish Ministry of Health, the criteria for starting pharmacological agent treatment for osteoporosis are stated as follows:[
13]
These agents are prescribed (together with a health report indicating primary disease):
In patients with an osteoporotic fracture when any 1 of the T-values is ≤−1 in the FN or the total hip or the lumbar total (L1-4) in the posteroanterior (PA) BMD measurements taken from the lumbar region,
In patients without osteoporotic fractures aged ≥65 years when any 1 of the T-values is ≤−2.5 in the FN or the total hip or the lumbar total (L1-4) in the PA BMD measurements taken from the lumbar region,
In patients without osteoporotic fractures aged <65 years when any 1 of the T-values is ≤−3 in the FN or the total hip or the lumbar total (L1-4) in the PA BMD measurements taken from the lumbar region,
In patients with RA, celiac disease, chronic inflammatory intestinal disease (Crohn's disease or ulcerative colitis), ankylosing spondylitis, hyperthyroidism, hypogonadism, hypopituitarism, anorexia nervosa, chronic obstructive pulmonary disease, type 1 diabetes, Cushing syndrome, and in those using long-term (>3 months) systemic corticosteroids of >5 mg/day for hyperparathyroidism, those receiving cancer treatment and patients who have undergone organ transplantation, and in secondary developing osteoporosis, when any 1 of the T-values is ≤−1 in the FN or the total hip or the lumbar total (L1-4) in the PA BMD measurements taken from the lumbar region.
In patients aged ≥75 years, it is not necessary to measure BMD when osteoporotic hip fracture is reported.[
13]
The aim of the current study was to evaluate the agreement between the FRAX® treatment recommendations and those in the HPS treatment guidelines for osteoporosis in Turkey and to determine the factors affecting agreement. It was investigated whether the HPS evaluation had better predictive value than FRAX® in the identification of patients to be referred for treatment. The study also aimed to determine the optimal treatment by comparing two different criteria.
Go to :

RESULTS
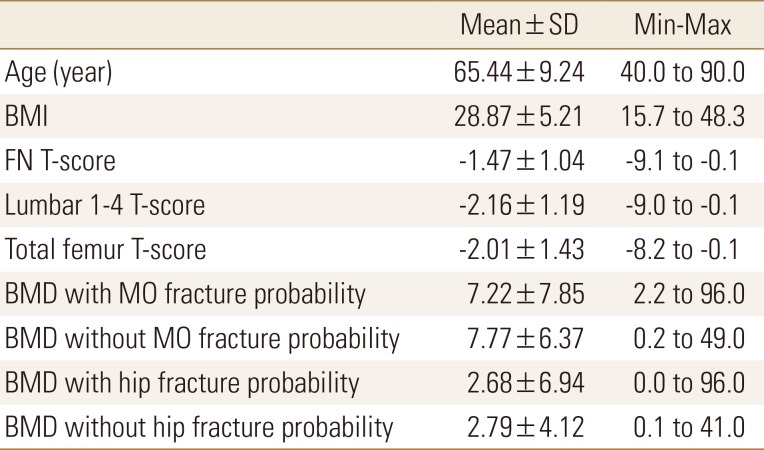
A total of 1,255 patients were included in the study, comprising 161 (12.8%) males and 1,094 (87.2%) females. The mean age of the patients was 65.44±9.24 years, and mean BMI was 28.87±5.21 (
Table 1).
Table 1
Study population baseline characteristics during bone mineral density measurement


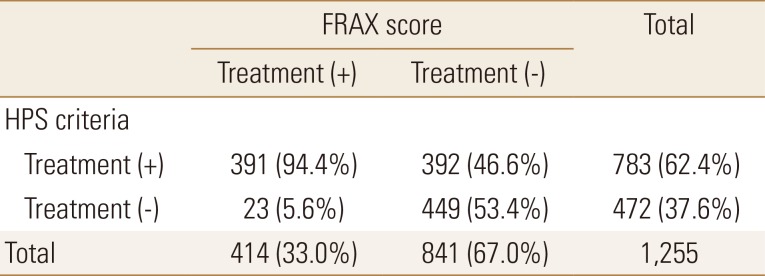
In FRAX®, treatment was recommended for 414 patients (33.0%; FRAX+), and not recommended for 841 (67.0%; FRAX−). In the evaluation according to HPS, treatment was recommended for 783 (62.4%; HPS+), and not recommended for 472 (37.6%; HPS−). Of the 783 HPS+ patients, 391 (49.9%) were FRAX+ and of the 472 HPS− patients, 449 (95.1%) were FRAX−. A statistically significant difference was determined between the treatment recommendations of HPS and FRAX® for all age groups (P<0.001; χ2 test).
This can also be stated as, of the 414 FRAX+ patients, 391 (94.4%) were HPS+, and of the 841 FRAX− patients, 449 (53.4%) were HPS−(
Table 2). Thus 94% of the patients recommended for treatment in FRAX® were also recommended for treatment in HPS. Of the patients not recommended for treatment in FRAX®, only 53% were not recommended for treatment in HPS.
Table 2
Distribution of patients according to treatment recommendations calculated using fracture-risk assessment tool® and Turkey Healthcare Practices Statement guideline


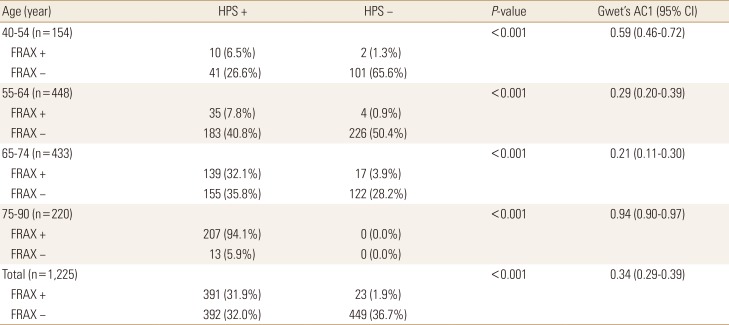
When the patients were evaluated as a whole, disregarding age groups, the level of agreement between HPS and FRAX® was weak (Gwet's AC1=0.34; 95% confidence interval [CI], 0.29–0.39). In the 75 to 90 years age group, there was seen to be almost perfect agreement between HPS and FRAX® (Gwet's AC1=0.94; 95% CI, 0.90–0.97). There were 220 patients in this age group and all were HPS+. Of these 220 patients, 207 (94.1%) were FRAX+. The 13 patients who were not recommended for treatment were all males and the mean FN T-score was −0.98. In the 65 to 74 years age group, there was seen to be minimal agreement between HPS and FRAX® (Gwet's AC1=0.21; 95% CI, 0.11–0.30) (
Table 3).
Table 3
Differences and agreement between Healthcare Practices Statement and fracture-risk assessment tool according to age groups


The major osteoporotic fracture risk value was mean 7.22±7.85 with DXA, and 7.77±6.37 without DXA. The hip fracture risk was mean 2.68±6.94 with DXA, and 2.79±4.12 without DXA (
Table 1). The mean BMI of the HPS+ group (28.33±5.30) was lower than that of the HPS− group (29.76±4.95) (
P<0.001; Welch
t-test). Of the 783 HPS+ patients, 697 (89.0%) were female, and of the 472 HPS− patients, 397 (84.1%) were female. No statistically significant difference was determined between the HPS+ and HPS− groups in respect of gender (
P=0.012; χ
2 test).
Go to :

DISCUSSION
According to the results of this community-based study, the agreement between the HPS treatment guidelines for osteoporosis and the FRAX® scores calculated with and without BMD was at a moderate level. The agreement between HPS and FRAX® according to the treatment threshold was 94.4%. The agreement between the two systems in patients not recommended for treatment was 53.3%. According to the NOF guideline values, osteoporosis therapy is not recommended for a significant proportion of the population, whether FRAX® is calculated with or without BMD. However, the recommendation rates for osteoporosis treatment in the elderly (≥75 years) is very high. These rates are lower compared to the HPS criteria.
When compared with the decision-making strategy based on the current application of HPS, FRAX® was seen to have lowered the intervention threshold in the cohort to 34%. The NOF overall fracture risk thresholds in patients aged ≥75 years old (3%/20%) were exceeded in most patients regardless of risk factors other than age, and almost perfect agreement was seen between the two strategies in this elderly age group (Gwet's AC1=0.94; 95% CI, 0.90–0.97). There were 220 patients in this age group, all were HPS+ and 207 (94.1%) were FRAX+. The 13 patients who were not recommended treatment were all males with a mean FN T-score of −0.98. This difference can be considered to be due to the high FN T-score. The FRAX® approach requires BMD measurement for the majority of elderly females and is recommended to be applied to a greater population than HPS. This renders FRAX® implementation more expensive than HPS. However, there is the possibility of reducing the societal burden of fractures. These analyses could help clinicians and policymakers make more knowledgeable decisions.
Similar to the current study, Goldshtein et al. [
9] determined that the application of the NOF guidelines in females aged ≥75 years required particular care and the absolute fracture risk was exceeded by almost all the females on the basis of age without consideration of other risk factors. Changes in the treatment strategies of males aged >75 years and postmenopausal females could increase the current agreement. One of the weaknesses of the Turkish guidelines is the recommendation to start treatment for all patients over the age of 75 years.
In the 55 to 64 years and 65 to 74 years age groups, there was minimal agreement. The disagreement was generally that while HPS recommended treatment for patients with a T-score ≤−3 in the 55 to 64 years age group and for patients with a T-score ≤−2.5 in the 65 to 74 years age group, these patients were not recommended for treatment in FRAX® (Gwet's AC1=0.29 and 0.21, respectively). The reason for this was that only 10 (6.5%) of the 155 HPS+ FRAX− patients in the 65 to 74 years age group had a FN T-score ≤−2.5. Moreover, in this age group, there were 103 (66.5%) patients with L1-4 T-score ≤−2.5, and 98 (63.2%) patients with a total hip T-score ≤−2.5. This could be related to only using the FN T-score in the FRAX® calculation or that the threshold of the Turkish FRAX® model has not been analyzed.
In the 40 to 54 years age group, agreement was relatively higher (Gwet's AC1=0.59). This can be associated with the high percentage (65.6%) of patients not recommended for treatment in this age group in both strategies. When all the age groups were examined, the treatment recommendations of the HPS criteria were found to be higher. In the comparison of different treatment strategies in literature, differences between treatment recommendations have been determined according to age groups and gender.[
91016] Similarly in the current study, a statistically significant difference was found between the HPS and FRAX® criteria in all age groups (
P<0.001; χ
2 test).
Leslie et al.[
17] reported that both the major osteoporotic fracture risk and the hip fracture risk was greater in females than males, which was similar to the results of the current study. Of the 783 HPS+ patients, 697 (89.0%) were female and of the 472 HPS− patients, 397 (84.1%) were female. A statistically significant difference was determined between HPS+ and HPS− in respect of gender (
P=0.012; χ
2 test). As expected, probability was higher in females than in males.
Järvinen et al.[
18] stated that the pharmacotherapy indications of the FRAX®-based guidelines had been expanded in an inappropriate way and this caused concerns of over-treatment. While the findings of the current study do not confirm this expansion, when compared with current agreement, it could be an indication for revision of the FRAX® calculation according to the country. That the value of FRAX® in therapeutic intervention in Turkish settings is thought to be cost-effective can be associated with it not yet having been adapted according to the repayment and healthcare application perspective. It has been reported that osteoporosis treatment in Greece became cost-effective when the absolute 10-year probability of hip and major osteoporotic fractures in both genders aged <75 years reached 2.5% and 10% respectively and the intervention thresholds recommended in older cases increased to a probability level of 5% for hip fractures and 15% for major osteoporotic fractures.[
19] According to a cost-effective analysis in Switzerland, this rate has been reported as 15% for both males and females (lower than NOF).[
20] In a 2008 study in Japan by Fujiwara et al.[
21], intervention thresholds were published specific to Japan, based on the FRAX® model. The age-specific major osteoporotic fracture risk treatment threshold varied from 5% at age 50 years to 20% at age 80 years. In a study in Korea, fracture probabilities in study participants aged 70 years or older were remarkably lower with the Korean FRAX® model than when the Japanese FRAX model was applied.[
22] Tuzun et al.[
23] reported that a cost-effective analysis for intervention thresholds was necessary in Turkey.
The guidelines in Hong Kong, Japan and Taiwan have included FRAX in the treatments and these recommend treatment for subjects without other indications for treatment (such as prior fractures or BMD below a cut-off) if their FRAX value is above a fixed value regardless of age.[
24] While the Korea guidelines offer criteria for treatment of patients aged over 50 years, who have had a prior fracture and/or have a BMD value of −2.5, FRAX was not taken into consideration.[
2425] Min et al.[
22] found a 50% lower 10-year fracture possibility in the FRAX Korean model than in the Japanese model and determined the difference to be statistically significant. Taiwanese guidelines do not differentiate between osteoporosis and osteopenia but rely on the FRAX treatment threshold, which resulted in a lower percentage of subjects being treated. Nonetheless, the percentage of fracture subjects who would be indicated for treatment and the percentage of non-fractured subjects offered reassurance were similar.[
16] Cheung et al.[
16] reported that the treatment strategies of the NOF and Taiwan guidelines for the protection against fracture in Chinese postmenopausal women showed a poor clinical utility index.
The presence of only clinical risk factors in the Turkish guidelines as evaluation for treatment indication could explain the over-treatment.[
13] As in the Korean guidelines, not considering the clinical risk factors or treatment strategies depending only on T-scores could cause treatment to be overlooked.[
24] These points can be evaluated as a weakness of the guidelines.
One of the osteoporosis risk factors is the body structure.[
26] Pınar et al.[
27] found no significant correlation between BMI and osteoporosis in a study of females aged >45 years. Similarly, Kutlu et al.[
28] also reported no statistically significant relationship between osteoporosis and BMI. In the current study, there was no statistically significant relationship between BMI and the treatment recommendations of HPS criteria (
P<0.001). However, in a study by Robitaille et al.[
29], osteoporosis was determined in 11% of those with BMI <18.5 and in 7.5% of those with ≥30. Burger et al.[
30] showed a strong relationship between increased BMI and high bone density in a prospective study of males aged >50 years.
This study has several limitations. First, there are some limitations associated with the FRAX® model, such as the absence of some important fracture risk factors (falls, bone cycle, mode of dressing, and lifestyle), the limitation of the BMD entry to FN BMD, that the fracture risk could be over or under-estimated, and it is not used in patients who have been treated. A further limitation was that although there is a higher incidence of osteoporosis in female patients, the number of male patients was low.
The FRAX® model has different treatment recommendation rates from HPS. The agreement between them is at a minimal level. The integration and interpretation of FRAX®-based risk evaluation in this condition is reflected in routine clinical systems and may help physicians in prediction. The potential effect of the current HPS treatment guidelines in Turkey is significantly high in patients aged ≥75 years. In the recommendation to start pharmacological treatment which is primarily based on age, there should be evaluation of non-medical interventions for males with preserved bone density and these should be taken into consideration. Therefore, it must not be forgotten that protective and therapeutic algorithms based on age alone can be misleading and patient selection should be applied carefully.
Go to :


 PDF
PDF ePub
ePub Citation
 Print
Print


 XML Download