

 PDF
PDF ePub
ePub Citation
 Print
Print


Fatty infiltration (FI) and muscle atrophy are the two most specific findings seen in magnetic resonance imaging (MRI) of rotator cuff tears. In particular, they are important preoperative factors that are closely associated with the frequency of postoperative retear after repair. In recent systematic review reports, rotator cuffs with higher FI preoperatively had significantly higher retear rates than those with lower FI.123456) Since FI also has a major impact on rotator cuff diseases, accurate assessment of FI is important.7)
The grading system for FI was first proposed in 1994 by Goutallier et al.,8) and this method is still widely used for measuring FI of the rotator cuff.258910111213141516) Originally, FI was assessed with axial computed tomography. However, currently, MRI is the gold standard for the assessment of soft tissue quality and is used as the standard preoperative imaging modality for the clinical diagnosis of rotator cuff tears.171819) FI is currently measured using the Goutallier classification (GC) system that assesses the degree of FI semiquantitatively in a scapular Y-view on an oblique sagittal MRI of the shoulder.
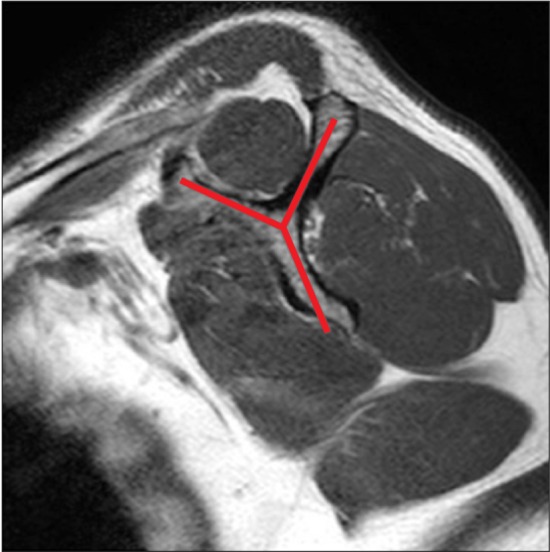
The scapular Y-view refers to the Y shape formed by the scapula and the spine on an oblique sagittal MRI of the shoulder (Fig. 1). The GC system determines the degree of FI of the whole muscle according to the FI grade assessed on a single MRI slice of the scapular Y-view. However, it is unclear whether FI measured from one area based on the size of the rotator cuff tear can represent the degree of FI in the entire rotator muscle. Recently, Vidt et al.20) compared the FI of the rotator cuff on the scapular Y-view to a three-dimensional (3D) measurement of the FI of the whole muscle in 20 individuals. They reported that the single image slice did not accurately represent the 3D measurement values. However, 3D measurement is very inconvenient for operators, and their study included a small number of participants. Prior to the study, there had been no comparative studies on the representative nature of FI obtained by quantitative measurement on a single sagittal MRI slice. Therefore, to supplement the conventional method we have designed a new measurement method using the average values obtained from three sagittal slices including the scapular Y-view and medial and lateral scans relative to the Y-view and assessed the efficacy of the method in an adequate number of participants in this comparative study.
This study aims to ascertain whether the conventional method of measuring FI on a single sagittal MRI slice (scapular Y-view) can represent FI of the whole supraspinatus muscle. The null hypothesis of this study is that FI of a single sagittal slice cannot represent the whole FI of the rotator cuff.
METHODS
Ethical Statements
We conducted this study in compliance with the principles of the Declaration of Helsinki. The protocol of this study was reviewed and approved by the Institutional Review Board of Hallym University Kangnam Sacred Heart Hospital (IRB No. 2015-01-01). Written informed consents were obtained from the reported patients to present their medical data.
Patient Selection
The participants in the study consisted of patients who were admitted to Hallym University Kangnam Sacred Heart Hospital and underwent MRI examination following orthopedic diagnosis and evaluation (Fig. 2).
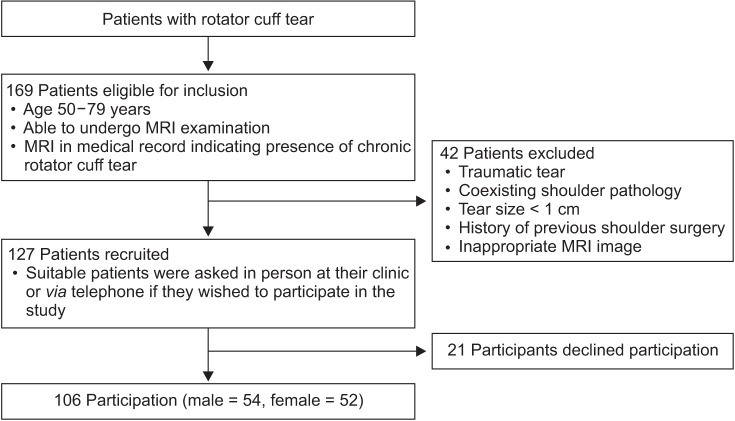
Initially, 169 patients were identified and they underwent surgery at our hospital and pre- and postoperative MRI examinations under the diagnosis of a chronic rotator cuff tear between 50 and 79 years of age. Patients with traumatic tears, coexisting pathology other than a rotator cuff tear, or previous shoulder surgery, were excluded from the study. Based on the anteroposterior length of the torn tendon in the MRI image, patients with small-sized tears (< 1 cm) were also excluded because FI in these patients is often lower than the GC grade 1, and there is no significant correlation between a GC grade of 1 or less and prognosis.21)
Patients who had been screened for preoperative MRI at other hospitals were also excluded, if the images did not show the surface where the scapula and spine formed a Y-shape (Y-view) in the sagittal view MRI. Patient recruitment was performed by asking suitable patients at the clinic to participate in the study in person or via telephone. Twenty-one patients declined participation and 106 patients participated: 54 males (50.9%) and 52 females (49.1%) (Fig. 2).
Depending on the size of the tear, the participants were divided into medium (≥ 1 & < 3 cm), large (≥ 3 & < 5 cm), and massive (≥ 5 cm) groups according to the classification by DeOrio and Cofield.22) Comparative analysis was performed among the groups.
Pilot Study
We had performed a pilot study to analyze the MRI images of 46 patients (mean age, 64.0 years; range, 50 to 79 years) without rotator cuff disease, which included 20 males and 26 females. We initially used the two measurement methods using single Y-view slice and all MRI slices to acquire FI ratios. After devising the three-slice method, we also reanalyzed the FI ratio using the new measurement method. The ratio of muscle mass and fat mass on the Y-view single slice (F1/M1) and the average of the ratio assessed from all MRI slices (FA/MA) were calculated. Then, the average of the ratio derived from the Y-view and slices medial and lateral to the Y-view (F3/M3) were calculated.
F1/M1 (mean, 2.6%; standard deviation [SD], 4.0%) was different from both FA/MA (mean, 4.0%; SD, 4.0%) and F3/M3 (mean, 3.9%; SD, 5.0%) (p = 0.000). However, the differences did not exceed 2%. F3/M3 was not significantly different from FA/MA.
FI Ratios Measured from MRI Examination
MRI examination was performed in all patients in neutral to external rotation position using a 1.5T magnet (Philips Healthcare, Amsterdam, The Netherlands) with an interval of 4 mm for each sagittal slice (1.5T scanner; the echo time = 18 ms; the repetition time = 500 ms; flip angle = 90°; matrix size = 192 × 152; bandwidth = ± 211 kHz; field of view = 150 mm; slice thickness = 4 mm). The total scan time was approximately 15 minutes (1.5T). Measurements were performed using the picture archiving and communication system (PACS) program (Infinitt Healthcare, Seoul, Korea) available in the medical center. Standard T1-weighted images were used for measurements according to the following method.
The average FI ratio of all sagittal MRI image slices (FA/MA) and FI ratio of the scapular Y-view single slice (F1/M1) were measured. The area of the muscle portion in the supraspinatus muscle was established using a free-line region of interest function (Fig. 3A). Then, a pseudo-color mapping function was used to establish the signal intensity of fat showing a high signal intensity on the T1-weighted MRI. This function can alter the color of the area that has a signal intensity higher than the set value (Fig. 3B). Color mapping of the high signal intensity area graphically visualized the FI area (Fig. 3C). By calculating the color-mapped portion in the muscle, the area of muscle, area of fat, and their ratio could be derived (Fig. 3D).
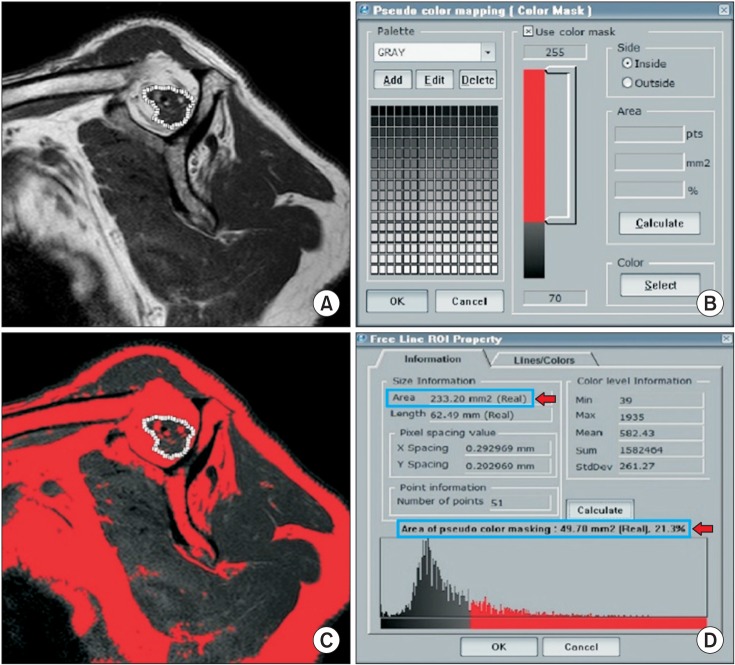 | Fig. 3Measurement of the fatty infiltration ratio in a sagittal magnetic resonance imaging image using the picture archiving and communication system computer program. (A) The area of the muscle portion in the supraspinatus muscle was established using a free line range of interest function. (B) The pseudo-color mapping function was used to establish the parts that showed a signal intensity of fat. (C) The color mapping of the fatty infiltration area was provided. (D) By calculating the color-mapped portion in the muscle, the area of muscle and fat, and their ratio could be derived.
|
Muscle mass (M1), fat mass (F1), and their ratio (F1/M1) on the Y-view single slice were assessed. The Y-view was defined as the most lateral image of the junction of the scapular spine with the scapular body on the oblique sagittal T1-weighted image. Then, the Y-view and all slices medial and lateral to the Y-view, were used to assess the mean muscle mass (MA), mean fat mass (FA), and their ratio (FA/MA).
In the pilot study performed by the authors, FI of a single sagittal slice was statistically different from FI of all slices in non-rotator cuff tear patients. Therefore, we devised a new measurement method to supplement the conventional method. We measured the average FI of three sagittal slices, which consisted of the scapular Y-view and the medial and lateral halves. Since each person has a slightly different shoulder structure and size, the number of slices acquired medial and lateral to the Y-view varied. The mean number of additional medial slices relative to the Y-view was 5.75 ± 1.94. To standardize the method, the middle slice for the medial side was defined as the third slice (8 mm away from the Y-view). The middle slice for the lateral side showing the midpoint of the Y-view and the lateral end of the supraspinatus tendon was defined as the fourth or fifth slice (12 or 16 mm away from the Y-view). These two slices and the Y-view were used to assess the mean muscle mass (M3), mean fat mass (F3), and their ratio (F3/M3) (Fig. 4).

Two orthopedic surgeons (KCN and CJY) calculated the FI ratios. Each evaluator made their measurements twice, 2 weeks apart. All images were randomized and patient information was deidentified.
Statistics
Sample size calculation
A priori sample size calculation was performed, using the software G*power 3.1.2 (Heinrich Heine University, Dusseldorf, Germany) with the following input details: two-tailed; α error problem, α = 0.05; actual power, 90%; effect size d = 1.185.
Before this study, we had performed a pilot study using the same measurement methods. We had analyzed the MRI images of 46 patients (≥ 50 years old) without rotator cuff pathology. In the pilot study, the mean F1/M1 and FA/MA were 0.025 and 0.04, respectively. Standard deviation was 0.04 for each value. They showed a correlation of approximately 0.95. According to these group parameters, the effect size was determined. Based on this calculation, a sample size of at least 10 patients was derived. In this study, there were at least 10 patients in each subgroup.
Statistical analysis
Statistical analysis was performed by a statistician using IBM SPSS ver. 23.0 (IBM Corp., Armonk, NY, USA). Intraclass correlation coefficients (ICCs) were calculated for inter- and intraobserver repeatability of fat and muscle mass measurement. A higher ICC indicated better agreement. Student paired t-test was used to compare FI ratios according to measurement methods (F1/M1 vs. FA/MA, F3/M3 vs. FA/MA, and F1/M1 vs. F3/M3) in all groups.
Go to : 
RESULTS
Sample Status
Participant demographics
A total 106 patients were studied (mean age, 64.2 years; range, 50 to 79 years). There were 17 female (51.5%) and 16 male (48.5%) subjects in the medium group; 20 female (54.1%) and 17 male (45.9%) subjects in the large group; and 15 female (41.7%) and 21 male (58.3%) subjects in the massive group. The patients were divided into age subgroups of 50–59, 60–69, and 70–79 years within each tearsize group (Table 1).

Table 1
Participant Distribution Status
![]()
Intra- and interobserver agreement
ICC values were higher than 0.8 for all measurements indicating high intra- and interobserver reliability (Table 2).
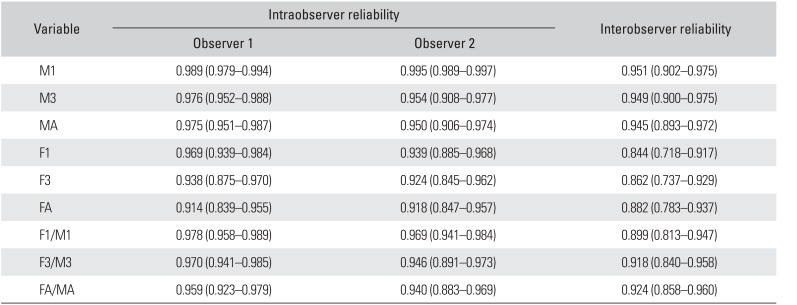
Table 2
Interclass Correlation Coefficient for Intra- and Interobserver Reliability
Values are presented as mean (95% confidence interval).
M1: muscle mass from single slice, M3: mean muscle mass from three slices, MA: mean muscle mass from all slices, F1: fat mass from single slice, F3: mean fat mass from three slices, FA: mean fat mass from all slices, F1/M1: fat mass/muscle mass from single slice, F3/M3: mean fat mass/mean muscle mass from three slices, FA/MA: mean fat mass/mean muscle mass from all slices.
![]()
Comparison of Measurement Methods within Each Tear-Size Group
Single slice method vs. the other two methods
In the medium group, the difference between F1/M1 (mean, 12.4%; SD, 16.5%) and FA/MA (mean, 13.7%; SD, 15.8%) and the difference between F1/M1 and F3/M3 (mean, 13.4%; SD, 16.0%) were statistically significant (p = 0.002).When the subgroup analysis according to sex was performed, F1/M1 was significantly different from FA/MA and F3/M3 in males (p = 0.001 and p = 0.000, respectively), but not in females (p = 0.242 and p = 0.507, respectively). The difference between F1/M1 and other two methods was statistically significant in males with large tears (p = 0.024 and p = 0.023), but no statistically significant differences were observed in females with large tears (p > 0.05) and in both sex subgroups with massive tears (p > 0.05) (Table 3).

Table 3
Testing of the Difference between Three Measurement Methods
![]()
Go to :
DISCUSSION
In this study, FI assessed on the single Y-view was not significantly different from that of the whole supraspinatus muscle except in males with medium and large tears in whom, the differences did not exceed 2%. The 2% difference in FI between F1/M1 and FA/MA would not be of clinical significance.
Many studies report that preoperative FI is the prognostic factor affecting the anatomical and functional outcomes of rotator cuff surgery.810172324) In a retrospective study by Melis et al.25) involving 1,668 patients, the greater FI of the supraspinatus resulted in the faster onset of symptoms. They concluded that rotator cuff repair should be performed before FI development. Goutallier et al.3) studied 220 open rotator cuff tears repaired with sutures through bone tunnels, and reported that a global fatty degeneration index exceeding 2 was associated with higher recurrent tears. In a review article by Kuzel et al.,26) increased FI was associated with increased retear rates and poorer functional outcomes.
There are also questions as to whether the conventional single slice method can represent FI in the whole supraspinatus muscle. It was also found that the conventional method has the potential to produce wrong results.2627) One of the fundamental reasons why such measurement errors can occur is that the conventional measurement of FI may not well represent the entire muscle because of the relatively lateral position of the scapular Y-view slice.28) Moreover, one slice section near the glenoid has the potential to overestimate FI in the rotator cuff muscles, and the slice section can be affected by the retraction in the musculotendinous junction when the rotator cuff muscle is injured.192930) Vidt et al.20) performed manual segmentation along the muscle borders in all MRI image slices and created 3D reproductions of the whole muscle and fat mass of the rotator cuff muscles, which were then compared to traditional scapular Y-view measurements. They reported that the linear relationship between 3D measurements of the FI percentage and mean Goutallier staging and mean Fuchs score was not significant.
However, in this study, we could confirm the predictive value and usefulness of the conventional Y-view single slice of preoperative T1-weighted oblique-sagittal MRI images. It could represent all slices in most patients except in males with medium and large-size cuff tears. Although statistical differences were noted in those groups, the differences did not exceed 2%, and we suggest that such differences should not affect the surgeon's treatment options. Therefore, this conventional method may be regarded as useful, fast, and reliable for predicting FI of the whole muscle. The extent of FI assessed using three sagittal slices was found more precise in this study. However, this takes more time and effort compared to the assessment based on a single sagittal slice and may preclude any clinical benefit that may be obtained.
Our study seems statistically relevant as it included a larger number of patients than previous studies, and comprised relatively homogenous participants in each tear-size group (a total of 106 patients, each group included > 30 patients, each subgroup fulfilled the minimum sample size for statistical power analysis).
Furthermore, we performed quantitative measurements with the aid of computer software. This approach seems more accurate than the GC because it is a semi-quantitative grading system, and its inter-reproducibility is below 60%.731) Nardo et al.7) performed the quantitative assessment of FI in the rotator cuff muscles using water-fat MRI. They used the scapular Y-view, adjacent medial section (first cut of the medial side), and the next two consecutive lateral sections (first and second cuts of the lateral side), which is a similar method to that used in this study. They reported a high correlation between their measurement and the GC score, but they did not compare the entire FI of the muscle.
Limitations
We did not compare the clinical functional score to the FI ratio. Therefore, the results of this study are restricted to the evaluation of imaging diagnosis. To establish the gold standard for muscle and fat mass assessment in the rotator cuff, muscle mass and fat mass on each slice of T1-weighted sagittal MRI were assessed and the mean value obtained from each slice was used for analysis. It is uncertain which method is superior, but there are some differences from the study by Vidt et al.;20) they used a manual segmentation method to obtain whole muscle volume and a custom program to obtain FI percentage. In the three-slice method, the middle slices for the medial and lateral slides were determined as the third and fifth slices based on the mean number of additional slices relative to the Y-view. However, the distances between the Y-view and insertion area of the supraspinatus tendon can vary according to tear size because of the proximal retraction of the tendon. Therefore, the fifth slices from the Y-view slice in this study were not exactly the middle slices for the lateral side.
We found that the FI ratios of female patients were higher than those of male patients in the medium and large tear-size groups, and the difference in the medium size group was statistically significant (the difference in FT/MT values, p = 0.042). In the pilot study, the FI ratios of female individuals were higher than those of male subjects (p = 0.001). According to a review by Kuzel et al.,26) the risk factors of FI progression did not include sex. Other previous studies did not compare the FI ratios according to sex. We consider that there might have been differences in muscle use between males and females. Further studies assessing the influence of sex on FI are required.
In addition, some patients were diagnosed using MRI images of other hospitals when they were admitted to our hospital for the surgery, so they could not be compared completely using MRI images obtained under the same condition as in other patients.
Conclusions
A single sagittal MRI slice can represent the whole extent of FI in chronic rotator cuff tears except in some patient groups. Although the measurement method using the three sagittal slices was more accurate regardless of sex and tear size, we recommend the single sagittal MRI slice measurement method, given the effort required for measuring the three sagittal slices.
Go to :
 XML Download