

 PDF
PDF ePub
ePub Citation
 Print
Print


Obesity is one of the etiological factors in development and progression of osteoarthritis.123456) Literature reports higher incidences of total knee arthroplasty (TKA) in obese patients.78) With increasing life expectancy and prevalence of obesity in general population, the number of obese patients needing TKA is going to increase dramatically in the future.910) The two main issues of concern with TKA in the obese are the functional recovery post-surgery and survival of implant.
Several studies have reported on survival of implant in obese patients. Few studies have compared functional recovery in the obese and morbidly obese, and almost all have made comparison in patients above a certain body mass index (BMI) against those below that BMI.1112) There is no study that has made comparison of functional recovery in obese patients in accordance with the World Health Organization (WHO) classification. WHO has proposed the classification of overweight adults: normal, BMI 18.5 to 24.9 kg/m2; overweight, BMI 25 to 29.9 kg/m2 (class I obese, 30 to 34.9 kg/m2; class II obese, 35 to 39.9 kg/m2, and class III obese, 40 or greater kg/m2 [morbidly obese]).13) BMI is a measure of obesity, calculated as a ratio of a patient's weight in kilograms to the square of the patient's height in meters. Our aims were (1) to study the functional scores in each class of obesity as per the WHO classification and compare against each matched control group of nonobese patients and (2) to study the effect of obesity on flexion achieved post-TKA.
METHODS
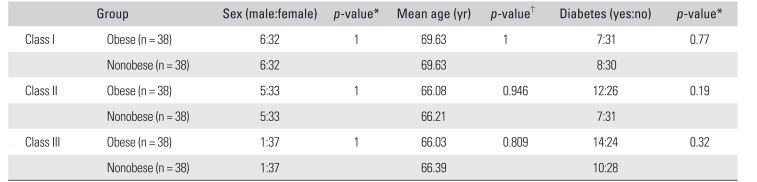
A series of 885 consecutive primary TKA patients (919 knees) operated by a single surgeon (RNM) between March 1, 2010 and September 30, 2012 were considered for this study. After the approval of Lilavati Hospital and Research Center's Institutional Review Board, a retrospective evaluation of the computerized database of these patients was done to identify the study population. As the study was done using the computerized database, no patient consents were taken. The first 35 knees in each class I, class II and class III obesity group during the study period were then matched with a similar number of knees in nonobese TKA patients during the same period with respect to age, sex, diagnosis and laterality (unilateral or bilateral). The data regarding the preoperative diabetic status of these patients was also considered. There were 35 class I obese patients (38 knees), 35 class II obese patients (38 knees) and 35 class III obese patients (38 knees).
The operative technique was the same in all patients. The surgeon used the same PFC Sigma series (Depuy, Warsaw, IN, USA) of implants. All knees were done with computer navigation (Brainlab AG, Munich, Germany). All components were cemented, and all patellae were resurfaced. A tourniquet was used from the beginning of surgery until the cementing of components. Hemostasis was achieved after tourniquet release and closure done. The same postoperative protocol of physiotherapy was followed for all patients. Patients were discharged from the hospital on the fifth postoperative day. All patients received low molecular weight heparin from the first postoperative day till the day of discharge. After discharge, patients were called for follow-up at 2 weeks, 6 weeks, 3 months and at 1 year after surgery.
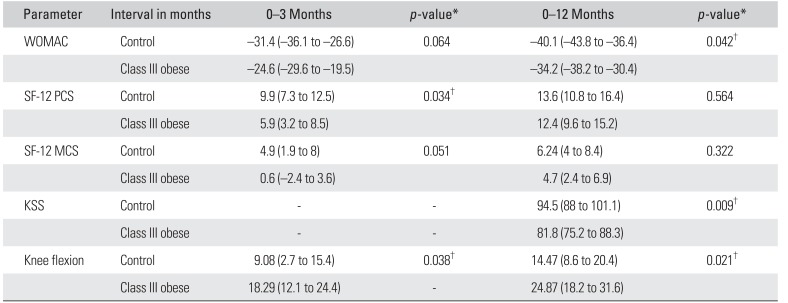
Functional scores studied were as follows: (1) Western Ontario and McMaster Osteoarthritis Index (WOMAC), recorded pre- and postoperatively at 3 months and 1 year. WOMAC indicates knee function, as subjectively assessed; (2) Short-Form Health Survey (SF-12) with physical component subscore (PCS) and mental component subscore (MCS) recorded pre- and postoperatively at 3 months and 1 year. SF-12 score indicates the general physical and mental health, as subjectively assessed; and (3) Knee Society Score (KSS) recorded preoperatively and 12 months postoperatively. KSS is an objective indicator of knee function. Functional improvement was indicated by a decrease in WOMAC score and an increase in SF-12 PCS, SF-12 MCS and KSS scores. It was noted that in the class III obese, the preoperative WOMAC, SF-12 and KSS scores were significantly lower than the control. Thus, in the class III obese, the change in each score over the preoperative value was additionally compared at each follow-up. Lastly, knee flexion recorded pre- and postoperatively at 3 months and 1 year was evaluated. It was noted that in class III obese patients, the preoperative knee flexion was significantly lower than the control, to begin with. Thus, in class III obese patients, the change in flexion over the preoperative value was also compared at each follow-up.
Sex and preoperative diabetic status comparisons were done by the chi-square test and the difference was considered significant if a p-value was less than 0.05. Age, WOMAC, SF-12 PCS, SF-12 MCS, KSS and knee flexion were compared by the two sample t-test (Stata ver. 8.2; Stata Corp., College Station, TX, USA). Changes in each score and knee flexion were compared by analysis of variance (ANOVA). A p-value of less than 0.05 was taken as significant for both two-sample t-test and ANOVA.
We did not calculate the sample size at the start of the study as this was a retrospective study and we were unaware of the number of patients in each BMI group for the period of the study. So, we have instead done a post-hoc power analysis keeping a minimum clinically important difference in WOMAC score (value −15), which leads to a minimal detectable clinical change.14) For the obese, the WOMAC score is around 48 preoperatively and becomes 11 at the end of 12 months. For the nonobese, the WOMAC score is around 46 preoperatively and becomes 15 at the end of 12 months. Hence, the change in WOMAC is 37 (range, 48 to 11) for the obese and 31 (range, 46 to 15) for the nonobese. The difference in change in WOMAC scores between the obese and nonobese is 6 with a standard deviation of 8. With a sample size of 76 for two different groups, the power is 83.4%, which is satisfactory.
RESULTS
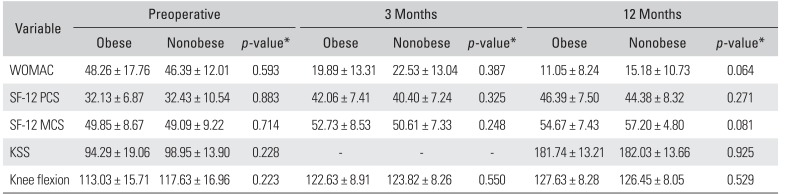
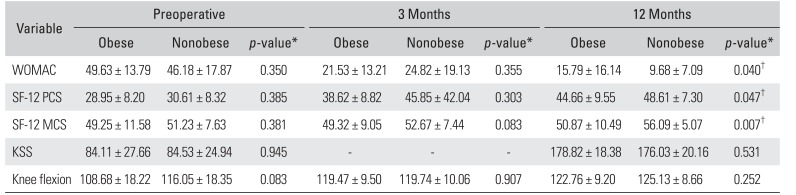
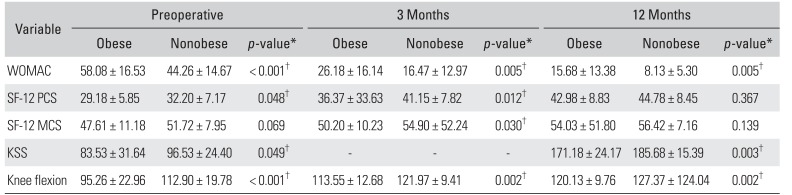
There was no statistical difference in age, sex and diabetic status between each obese class and the nonobese (Table 1). In each class of obesity, the results of each functional score and knee flexion compared against the matched nonobese counterparts, at three assessment points (preoperative, 3 months and 1 year postoperative) were as follows. (1) Class I obese: all parameters showed no statistical difference between the class I obese and nonobese patients at all assessment points (Table 2). These findings suggest that the functional recovery and knee flexion in the class I obese was as good as the nonobese at 3 months and 1 year after surgery. (2) Class II obese: there was no difference in the functional parameters between the class II obese and the nonobese preoperatively and at 3 months after surgery (Table 3). At 1 year after surgery, except for KSS and knee flexion, all parameters suggested lesser recovery in the class II obese than in the nonobese (Table 3). These findings suggest that at 3 months after surgery, the class II obese were as good as the nonobese but at 1 year after surgery, they lagged behind the nonobese. (3) Class III obese: the comparison of the class III obese with the nonobese at all assessment points with regards to functional scores and knee flexion are tabulated in Table 4. Changes in functional scores and knee flexion from the preoperative to 3 months postoperative and from the preoperative to 1-year postoperative intervals are tabulated in Table 5.
The findings suggest that in the class III obese, functional scores (WOMAC, SF-12, and KSS) and knee flexion were poorer than in the nonobese at 3 months and 1 year postoperatively. The fact that they were also significantly poorer than the nonobese preoperatively points to the importance of evaluating their changes over preoperative levels to assess recovery. It was found that the change in WOMAC remained poorer in the class III obese at 1 year after surgery, the change in SF-12 PCS became comparable to the nonobese at 1 year after surgery and the change in SF-12 MCS remained comparable to the nonobese at all assessment points (Table 5). On the other hand, the change in knee flexion over preoperative levels was significantly greater in the class III obese both at 3 months and at 1 year after surgery than in the nonobese (Table 5).
DISCUSSION
We set out to study the functional recovery parameters and knee flexion achieved post-TKA in our obese patients. We compared these parameters in comparison to their nonobese, matched counterparts. We identified the class of obesity where functional recovery is affected post-TKA. Our results showed that the functional recovery post-TKA of the class I obese was as good as that of the nonobese while the functional recovery of the class II and class III obese was less than that of the nonobese.
One of the limitations of our study is the retrospective study design. However, the cohort studied was large and there were adequately matched controls operated by the same surgeon with the same prosthesis, which would justify the comparisons drawn. The study is also limited by the fact that knee flexion in patients with similar BMI can vary depending on fat distribution in the body.15) Generally, male patients show android fat distribution with less fat around the thighs while females tend to have more fat around thighs which could restrict flexion. We have matched our selected obese patients with their nonobese counterparts, taking sex into consideration, thus making the comparisons valid.
The results of the study show that the class I obese (BMI, 30 to 35 kg/m2) have comparable early and late knee function as the nonobese post-TKA, while the class II obese (BMI, 35 to 40 kg/m2) have comparable early, but reduced late knee function compared to nonobese patients. Stevens-Lapsley et al.,13) in their study, reported no relation between functional recovery and BMI less than 40 up to 6 months after TKA. This corroborates our observation on early recovery in class I and II obese patients. Functional recovery post-TKA continues for a longer duration than 6 months. Our study additionally establishes that for class II patients, final functional outcome at 1 year after surgery is lesser than the nonobese. Hawker et al.16) studied that physical function ability in patients with BMI > 30 kg/m2 was reduced at 2–7 years after surgery. This corroborates our observation on late functional recovery post-TKA in class II and class III obese patients.
We found that class III obese patients (BMI > 40 kg/m2) had less functional ability at both early and late assessment points. Considering KSS, Mont et al.17) reported equal function score and knee score in the morbidly obese as compared to the nonobese. Winiarsky et al.18) reported lower knee score and lower function score, while Amin et al.19) and Krushell and Fingeroth20) found equal knee score but lower function score in the morbidly obese. This variability in results can be explained by the report that KSS is less responsive and also susceptible to observer bias.11) In our study, we have used WOMAC and SF-12 in addition to KSS, which are more responsive indicators of the patient's functional and general health status.21) Liao et al.22) found no difference in functional mobility between the obese (class II and class III) and the nonobese but observed significantly reduced postural stability in the obese. Rajgopal et al.'s study,11) the only study so far that used WOMAC score, reported lower function in the morbidly obese both pre- and postoperatively. However, they compared the morbidly obese against all patients with BMI < 40 kg/m2. In our study, we have stratified obesity according to WHO classification to obtain more specific information.
Regarding knee flexion, Gadinsky et al.23) have shown decreased preoperative flexion in all patients with BMI > 25 kg/m2 and decreased postoperative flexion in all categories of obese patients. Our study showed significantly reduced preoperative flexion only in the class III obese (BMI ≥ 40 kg/m2). Our study also found that postoperative flexion in the class I obese (BMI, 30 to 34.9 kg/m2) and in the class II obese (BMI, 35 to 39.9 kg/m2) was comparable to the nonobese. Our study found reduced postoperative flexion only in the class III obese, but it was noteworthy that the change in flexion in the class III obese over the preoperative levels was significantly more improved at 1 year after surgery as compared to the nonobese. This explained the good SF-12 MCS, indicating patient satisfaction in class III obese patients. Literature studies reporting functional recovery in obese patients have not used Computer Navigation for surgery. In our study, we have operated all our obese patients using Computer Navigation.
This study has helped us have a better understanding and thereby enabled us to give our obese patients undergoing TKA more specific information regarding their functional recovery after surgery. We have concluded that those obese patients with BMI 30 to 35 kg/m2 (i.e., class I) can expect as good early and late functional recovery as the nonobese. Obese patients with BMI 35 to 40 kg/m2 (i.e., class II) can expect comparable early functional recovery as the nonobese but their late functional recovery may be lesser. However, their early and late knee flexion movements would be equally good as the nonobese. Obese patients with BMI > 40 kg/m2 (i.e., class III) would have poorer functional scores and lesser knee flexion after surgery compared to the nonobese. However, when compared to their own preoperative status, they would show definite improvement in functional ability and significantly improved early and late knee flexion movements. It is noteworthy that knee flexion in the class I and II obese is as good as the nonobese and in class III, though it is less, the improvement from the preoperative value is significantly greater than that in the nonobese.
 XML Download