Journal List > J Korean Soc Radiol > v.78(2) > 1095561

Kim, Kim, Kim, Ki, Bae, Kim, and Kim: Factors Affecting Coronary Arterial Calcification in Patients with Chronic Kidney Disease Who Did Not Undergo Treatment with Dialysis

Abstract

Purpose

To investigate risk factors of coronary arterial calcification in chronic kidney disease (CKD) patients who did not undergo hemodialysis or peritoneal dialysis.

Materials and Methods

We enrolled 83 patients of normal renal function (Group I) and 112 patients of CKD [Group II (CKD stage 1–2) and Group III (CKD stage 3–5)], who were assessed coronary artery calcium score (CACS) with cardiac CT. CACS between the groups were compared. Risk factors for coronary artery calcification in patients with CKD including diabetes, hypertension, and smoking were identified as relevant to CACS using logistic regression analysis. Serologic data of electrolytes were analyzed to evaluate effect for coronary calcification in patients with CKD.

Results

Group III showed significant increment of CACS compared to Group I at the CACS level over 400 [odds ratio (OR) = 7.581, p = 0.01]. The OR were decreased in non-diabetic patients group, increased in non-hypertensive patients group, no significant differences in non-current smoker group. Serum phosphorous level was the only factor which showed significant effect for increased CACS (OR of 2.649, p = 0.02).

Conclusion

In CKD patients, higher stage of CKD was associated with increased CACS. Diabetes mellitus and increased serum phosphorous level would be considered as factors influencing coronary arterial calcification in CKD patients.

References

1. Wolfe RA, Port FK, Webb RL, Bloembergen WE, Hirth R, Young EW, et al. Introduction to the 1998 annual data report of the united states renal data system. Am J Kidney Dis. 1998; 32:S1–S3.
crossref
2. Coresh J, Selvin E, Stevens LA, Manzi J, Kusek JW, Eggers P, et al. Prevalence of chronic kidney disease in the United States. JAMA. 2007; 298:2038–2047.
crossref
3. Schiffrin EL, Lipman ML, Mann JF. Chronic kidney disease: effects on the cardiovascular system. Circulation. 2007; 116:85–97.
4. Chronic Kidney Disease Prognosis Consortium. Matsushita K, van der Velde M, Astor BC, Woodward M, Levey AS, et al. Association of estimated glomerular filtration rate and albuminuria with all-cause and cardiovascular mortality in general population cohorts: a collaborative metaanalysis. Lancet. 2010; 375:2073–2081.
5. Wilson PW, Kauppila LI, O'Donnell CJ, Kiel DP, Hannan M, Polak JM, et al. Abdominal aortic calcific deposits are an important predictor of vascular morbidity and mortality. Circulation. 2001; 103:1529–1534.
crossref
6. Okuno S, Ishimura E, Kitatani K, Fujino Y, Kohno K, Maeno Y, et al. Presence of abdominal aortic calcification is significantly associated with all-cause and cardiovascular mortality in maintenance hemodialysis patients. Am J Kidney Dis. 2007; 49:417–425.
crossref
7. Braun J, Oldendorf M, Moshage W, Heidler R, Zeitler E, Luft FC. Electron beam computed tomography in the evaluation of cardiac calcification in chronic dialysis patients. Am J Kidney Dis. 1996; 27:394–401.
8. Wang AY, Wang M, Woo J, Lam CW, Li PK, Lui SF, et al. Cardiac valve calcification as an important predictor for all-cause mortality and cardiovascular mortality in longterm peritoneal dialysis patients: a prospective study. J Am Soc Nephrol. 2003; 14:159–168.
crossref
9. Kramer H, Toto R, Peshock R, Cooper R, Victor R. Association between chronic kidney disease and coronary artery calcification: the Dallas Heart Study. J Am Soc Nephrol. 2005; 16:507–513.
crossref
10. Abedi SA, Tarzamni MK, Nakhjavani MR, Bohlooli A. Effect of renal transplantation on coronary artery calcification in hemodialysis patients. Transplant Proc. 2009; 41:2829–2831.
crossref
11. Barreto DV, Barreto FC, Carvalho AB, Cuppari L, Cendoroglo M, Draibe SA, et al. Coronary calcification in hemodialysis patients: the contribution of traditional and uremia-related risk factors. Kidney Int. 2005; 67:1576–1582.
crossref
12. Stompór T. Coronary artery calcification in chronic kidney disease: an update. World J Cardiol. 2014; 6:115–129.
crossref
13. Janowitz WR, Agatston AS, Kaplan G, Viamonte M Jr. Differences in prevalence and extent of coronary artery calcium detected by ultrafast computed tomography in asymptomatic men and women. Am J Cardiol. 1993; 72:247–254.
crossref
14. Cancela AL, Santos RD, Titan SM, Goldenstein PT, Rochitte CE, Lemos PA, et al. Phosphorus is associated with coronary artery disease in patients with preserved renal function. PLoS One. 2012; 7:e36883.
crossref
15. Dhingra R, Sullivan LM, Fox CS, Wang TJ, D'Agostino RB Sr, Gaziano JM, et al. Relations of serum phosphorus and calcium levels to the incidence of cardiovascular disease in the community. Arch Intern Med. 2007; 167:879–885.
crossref

Fig. 1.
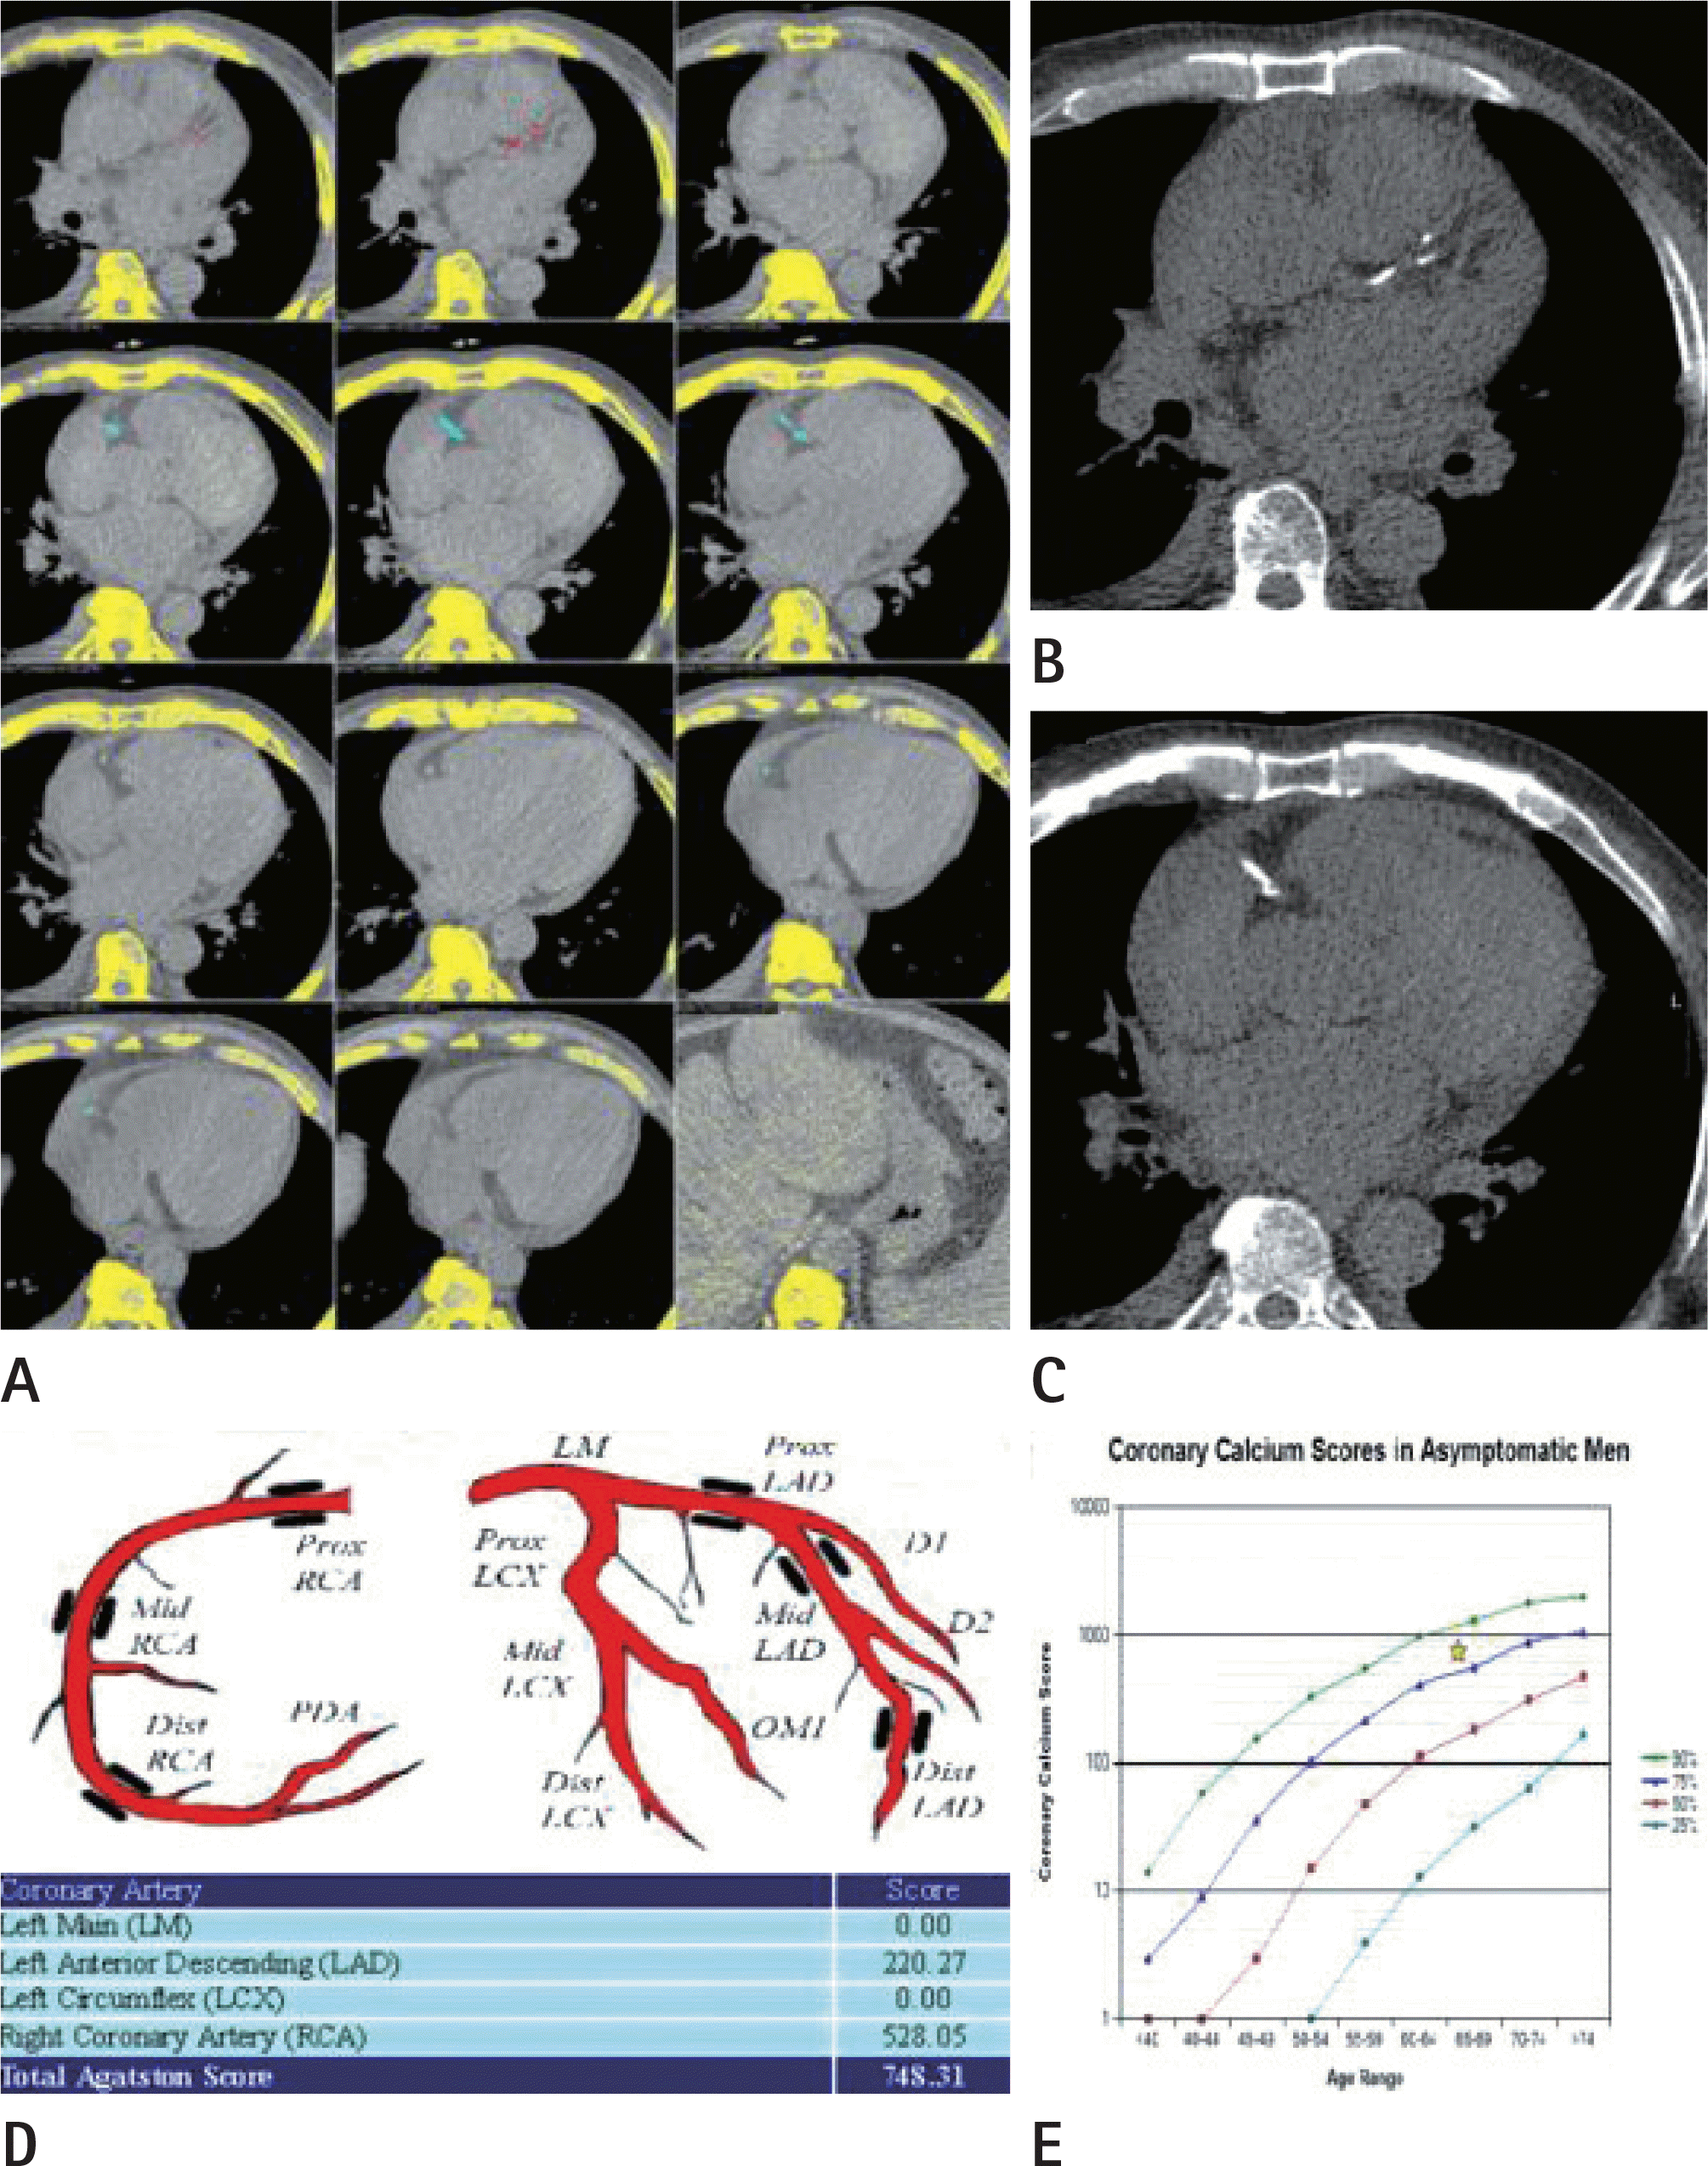
Measurement of Agatston coronary calcium score. Coronary arterial calcifications with attenuation above 130 Hounsfield unit is selected automatically on electrocardiography gated axial CT images (A-C), and Agatston coronary calcium score is calculated (D). Simultaneously patient's calcium score is rated on age-calcium score graphs (E).
jksr-78-88f1.tif
Table 1.
Characteristics of Study Populations by Presence of CKD
Characteristic CKD (+) (n = 112) CKD (−) (n = 83) p-Value
Age (year) 58.09 ± 10.97 62.13 ± 9.40 0.007
Male sex (%) 73 (65.2) 53 (63.9) 0.848
Hypertension (%) 65 (58.0) 28 (33.7) < 0.001
Diabetes mellitus (%) 44 (39.3) 13 (15.7) < 0.001
Dyslipidemia (%) 45 (40.2) 23 (27.7) 0.071
Current smoker (%) 14 (12.5) 21 (25.3) 0.021
Serum creatinine (mg/dL) 1.73 ± 0.91 0.72 ± 0.16 < 0.001
GFR (mL/min/1.73 m2) 47.6 ± 22.41 104.7 ± 20.66 < 0.001
Uric acid (mg/dL) 7.2 ± 5.64 5.0 ± 1.40 < 0.001
Total cholesterol (mg/dL) 175.4 ± 44.87 187.7 ± 38.05 0.040
LDL cholesterol (mg/dL) 105.0 ± 35.20 121.0 ± 34.22 0.002
Triglyceride (mg/dL) 179.2 ± 138.44 133.5 ± 70.20 0.003
Coronary artery calcium 255.4 ± 636.24 106.3 ± 278.38 0.028
score      
Coronary arterial 75 (67.0) 45 (54.2) 0.070
calcification (%)      
LM (%) 21 (18.8) 10 (12.0) 0.206
LAD (%) 63 (56.3) 39 (47.0) 0.200
LCX (%) 32 (28.6) 19 (22.9) 0.372
RCA (%) 53 (47.3) 29 (34.9) 0.083

CKD = chronic kidney disease, GFR = glomerular filtration rate, LAD = left anterior descending artery, LCX = left circumflex artery, LM = left main coronary artery, RCA = right coronary artery

Table 2.
Characteristics of CKD Populations Categorized by Stage of CKD
Characteristic CKD 12 (n = 39) CKD 35 (n = 73) p-Value
Age (year) 58.36 ± 11.12 57.95 ± 10.96 0.850
Male sex (%) 27 (69.2) 46 (63.0) 0.433
Hypertension (%) 21 (53.8) 44 (60.3) 0.511
Diabetes mellitus (%) 10 (25.6) 34 (46.6) 0.031
Dyslipidemia (%) 11 (28.2) 34 (46.6) 0.059
Current smoker (%) 7 (17.9) 7 (9.6) 0.203
Serum creatinine (mg/dL) 0.99 ± 0.15 2.13 ± 0.89 < 0.001
GFR (mL/min/1.73 m2) 73.8 ± 8.8 33.6 ± 12.78 < 0.001
Uric acid (mg/dL) 6.2 ± 1.26 7.7 ± 6.88 0.187
Total cholesterol (mg/dL) 183.5 ± 44.90 171.0 ± 44.55 0.162
LDL cholesterol (mg/dL) 109.2 ± 38.52 102.8 ± 33.37 0.368
Triglyceride (mg/dL) 174.2 ± 141.70 181.8 ± 137.61 0.785
Total calcium (mg/dL) 9.1 ± 0.63 8.8 ± 0.69 0.042
Phosphorus (mg/dL) 3.5 ± 0.55 3.7 ± 0.66 0.091
Coronary artery calcium 154.5 ± 314.55 309.3 ± 750.59 9 0.222
score      
Coronary arterial 24 (61.5) 51 (69.9) 0.372
calcification (%)      
LM (%) 6 (15.4) 15 (20.5) 0.505
LAD (%) 21 (53.8) 42 (57.5) 0.708
LCX (%) 6 (15.4) 26 (35.6) 0.024
RCA (%) 14 (35.9) 39 (53.4) 0.077

CKD = chronic kidney disease, GFR = glomerular filtration rate, LAD = left anterior descending artery, LCX = left circumflex artery, LM = left main coronary artery, RCA = right coronary artery

Table 3.
Odd Ratios for Coronary Arterial Calcification by Presence of CKD in Total and Non-Diabetic and Non-Hypertensive, Non-Current Smoking Study Populations
  CKD Stage 12/Non-CKD p-Value CKD Stage 35/Non-CKD p-Value
Total (n) 39/83   73/83  
CACS > 10 vs. CACS ≤ 10 0.922 (0.335–2.537) 0.874 1.641 (0.696–3.871) 0.258
CACS > 100 vs. CACS ≤ 10 1.625 (0.470–5.621) 0.443 2.376 (0.825–6.844) 0.109
CACS > 400 vs. CACS ≤ 10 1.949 (0.216–17.550) 0.514 7.581 (1.634–35.161) 0.010
Non-diabetic patients (n) 29/70   39/70  
CACS > 10 vs. CACS ≤ 10 0.369 (0.097–1.393) 0.141 0.834 (0.259–2.691) 0.762
CACS > 100 vs. CACS ≤ 10 0.941 (0.158–5.621) 0.947 1.864 (0.376–9.253) 0.446
CACS > 400 vs. CACS ≤ 10 1.139 (0.036–36.289) 0.941 3.209 (0.302–34.094) 0.347
Non-hypertensive patients (n) 18/55   29/55  
CACS > 10 vs. CACS ≤ 10 0.914 (0.175–4.770) 0.915 1.599 (0.451–5.667) 0.467
CACS > 100 vs. CACS ≤ 10 3.345 (0.316–35.361) 0.316 5.724 (0.949–34.541) 0.057
CACS > 400 vs. CACS ≤ 10     10.673 (0.563–202.427) 0.115
Non-current smoking patients (n) 32/62   66/62  
CACS > 10 vs. CACS ≤ 10 0.831 (0.260–2.661) 0.756 2.205 (0.805–6.041) 0.124
CACS > 100 vs. CACS ≤ 10 0.996 (0.216–4.587) 0.996 2.676 (0.787–9.095) 0.115
CACS > 400 vs. CACS ≤ 10 1.060 (0.071–15.850) 0.967 7.335 (1.283–41.927) 0.025

CACS = coronary artery calcium score, CKD = chronic kidney disease

Table 4.
Laboratory Findings that Showed Associations with Increased Coronary Calcium Score of Chronic Kidney Disease Patients in Multivariate Logistic Regression Analysis
Laboratory Findings OR (95% CI) p-Value
CACS > 10
Uric acid 1.148 (0.931–1.415) 0.197
Phosphorus 1.599 (0.851–3.006) 0.145
Total calcium   0.623
Total cholesterol   0.259
LDL-cholesterol   0.323
Triglyceride   0.251
CACS > 100
Uric acid 1.200 (0.960–1.499) 0.109
Phosphorus   0.319
Total calcium   0.331
Total cholesterol   0.200
LDL-cholesterol   0.538
Triglyceride 1.002 (0.999–1.006) 0.172
CACS > 400
Uric acid   0.579
Phosphorus 2.649 (1.166–6.017) 0.020
Total calcium   0.800
Total cholesterol   0.922
LDL-cholesterol 0.987 (0.971–1.002) 0.097
Triglyceride   0.555

CACS = coronary artery calcium score, CI = confidence interval, OR = odds ratio

TOOLS
Similar articles