Abstract
Focal eosinophilic infiltration in the liver is often associated with various eosinophil-related conditions. Focal eosinophilic infiltration in the liver is often identified incidentally by radiologic examinations ordered for other reasons, and is usually visualized radiographically as small, ill-defined, oval or round nodules. Focal eosinophilic infiltration in the liver may sometimes mimic hepatic metastases in those patients who present with a history of malignancy. Here, we present two cases of contrast enhanced ultrasonography findings of focal hepatic eosinophilic infiltration using Sonazoid (perfluorobutane; Daiichi-Sankyo, GE, Tokyo, Japan).
Go to : 
References
1. Lee WJ, Lim HK, Lim JH, Kim SH, Choi SH, Lee SJ. Foci of eosinophil-related necrosis in the liver: imaging findings and correlation with eosinophilia. AJR Am J Roentgenol. 1999; 172:1255–1261.

3. Yanagisawa K, Moriyasu F, Miyahara T, Yuki M, Iijima H. Phagocytosis of ultrasound contrast agent microbubbles by Kupffer cells. Ultrasound Med Biol. 2007; 33:318–325.

4. Yoo SY, Han JK, Kim YH, Kim TK, Choi BI, Han MC. Focal eosinophilic infiltration in the liver: radiologic findings and clinical course. Abdom Imaging. 2003; 28:326–332.

5. Yu JS, Yoon SW, Park MS, Lee JH, Kim KW. Eosinophilic hepatic necrosis: magnetic resonance imaging and computed tomography comparison. J Comput Assist Tomogr. 2005; 29:765–771.
6. Kim YK, Kim CS, Moon WS, Cho BH, Lee SY, Lee JM. MRI findings of focal eosinophilic liver diseases. AJR Am J Roentgenol. 2005; 184:1541–1548.

7. Park MS, Kim MJ, Lim JS, Kim SH, Kim HS, Chung YE, et al. Metastasis versus focal eosinophilic infiltration of the liver in patients with extrahepatic abdominal cancer: an evaluation with gadobenate dimeglumine-enhanced magnetic resonance imaging. J Comput Assist Tomogr. 2009; 33:119–124.
8. Ahn SJ, Choi JY, Kim KA, Kim MJ, Baek SE, Kim JH, et al. Focal eosinophilic infiltration of the liver: gadoxetic acid-enhanced magnetic resonance imaging and diffusion-weighted imaging. J Comput Assist Tomogr. 2011; 35:81–85.
Go to : 
 | Fig. 1.Focal hepatic eosinophilic infiltration in a 63-year-old male patient with lung cancer (case 1). A. Portal phase of contrast-enhanced CT scan shows an approximately 1.4 cm low-attenuated lesion on S5 of the liver (arrows). On pre-contrast CT scan and arterial phase of contrast-enhanced CT scan and 3-minute delay phase of contrast-enhanced CT scan, the lesion reveals iso-attenuation to slight low-attenuation. B. B-mode ultrasonography shows an ill-defined low echoic lesion on S5 of the liver (arrow). CT = computed tomography |
 | Fig. 1.Focal hepatic eosinophilic infiltration in a 63-year-old male patient with lung cancer (case 1). C. Forty seconds after injection of Sonazoid, showing an iso-enhanced lesion. Seventy seconds after injection of Sonazoid, showing a hypo-enhanced lesion (arrows). Three minutes after injection of Sonazoid, showing a hypo-enhanced lesion (arrows). In the Kupffer phase (10 minutes after injection of Sonazoid), showing a hypo-enhanced lesion (arrows). D. Photomicrograph of biopsy specimen shows inflammatory cell infiltrations at hepatic parenchyma, predominantly composed of eosinophils (arrows) (hematoxylin and eosin stain, × 200). |
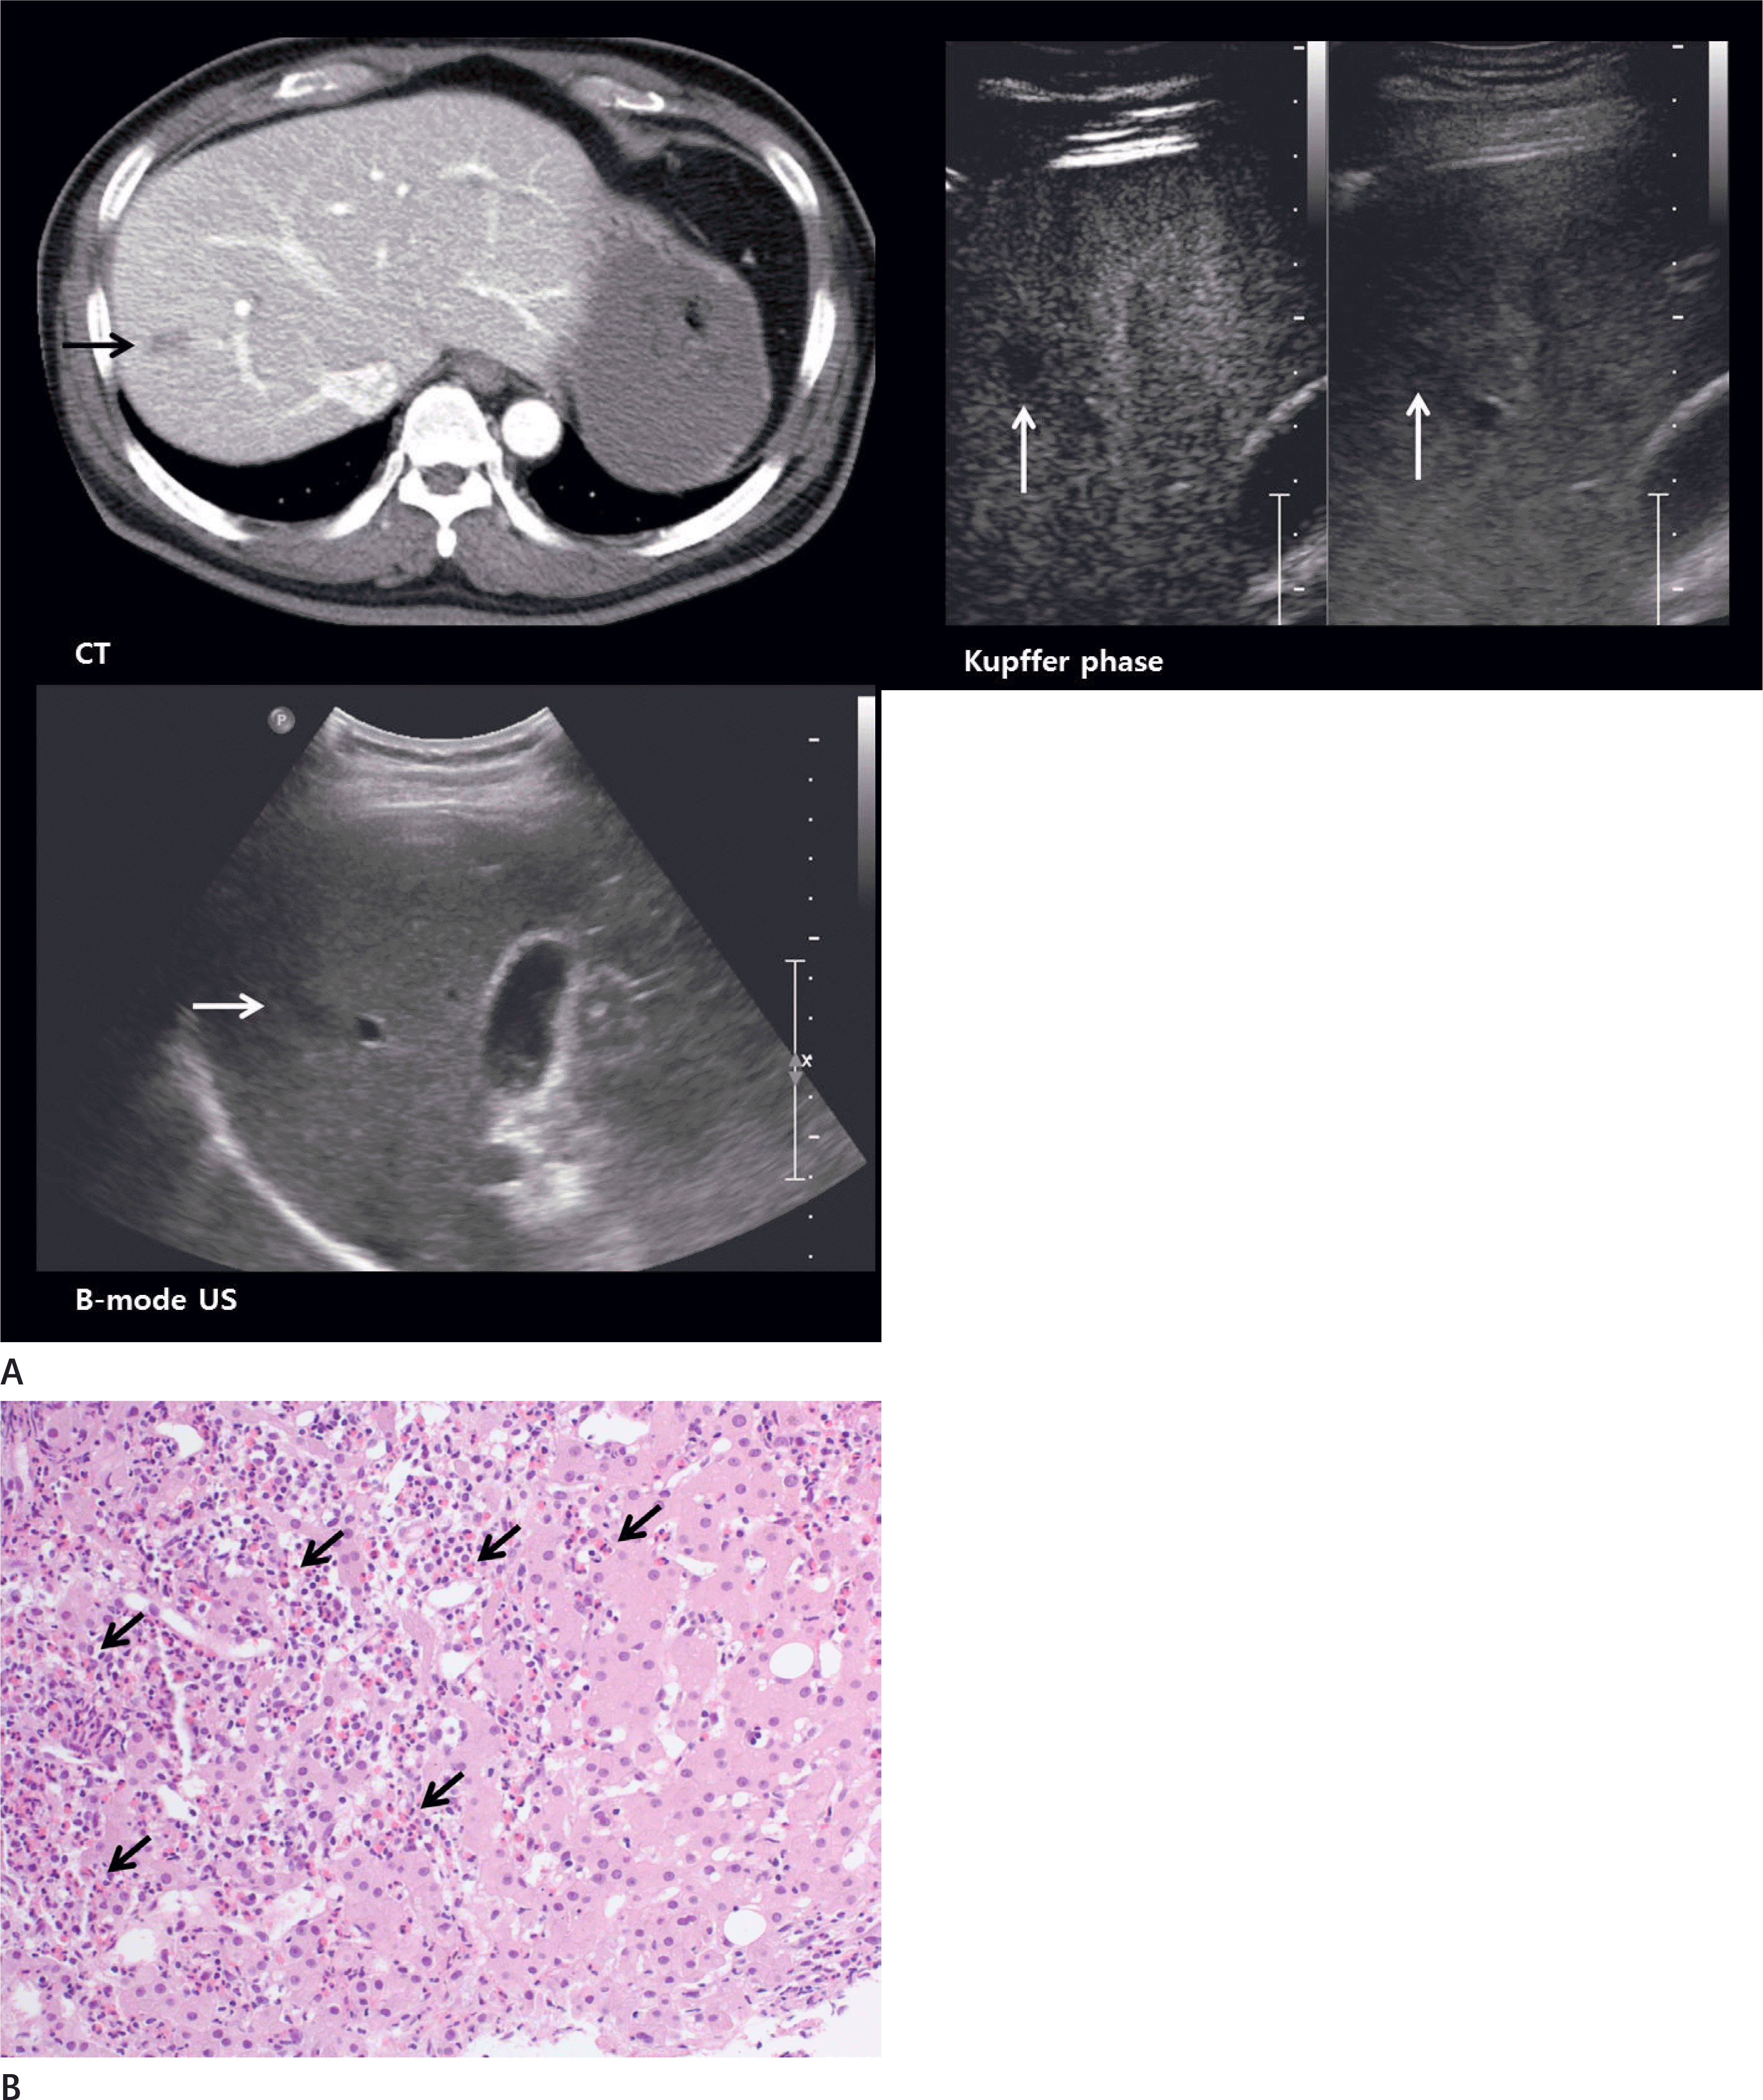
 | Fig. 2.Focal hepatic eosinophlic infiltration in a 55-year-old male with an incidentally found lesion of the liver (case 2). A. Axial contrast-enhanced computed tomography scan shows an approximately 1.7 cm low-attenuation lesion on S8 of the liver (arrow). B-mode ultrasonography shows an ill-defined low echoic lesion on S8 of the liver (arrow). In the Kupffer phase (10 minutes after injection of Sonazoid), showing a hypo-enhanced lesion (arrows). B. Photomicrograph of biopsy specimen shows inflammatory cell infiltrations at hepatic parenchyma, predominantly composed of eosinophils (arrows) (hematoxylin and eosin stain, × 200). |


 PDF
PDF ePub
ePub Citation
 Print
Print


 XML Download