

 PDF
PDF ePub
ePub Citation
 Print
Print


INTRODUCTION
African Americans tend to have a large tongue and loose and flaccid lips that allow the incisors to remain in balance and harmony in a more procumbent position.1 Sushner2 conducted a soft tissue study for 1,000 African Americans by selecting 100 of the most attractive photographs from the group. The results revealed that African Americans have a more protrusive soft tissue profile compared with Caucasians, and that African American men have a more protrusive soft tissue profile compared with women. Sushner2 reported these findings as African American norms, which have served treatment guides for this population since then. Although numerous studies including clinical evaluations of African American faces have been performed,34567891011 few have focused on the age or generation gap of the evaluators, i.e., orthodontists.
Evidence suggests that perceptions on facial profile attractiveness have changed and will continue to change over time.12131415 Authors have suggested that fuller, more prominent lips may be perceived as more youthful and, consequently, more desirable from an esthetic viewpoint. If this trend is true, it would have potentially important consequences for both orthodontic treatment planning and hard and soft tissue surgery, which influences lip prominence, particularly in the field of modern orthodontics continuously demanding an improvement in facial attractiveness.16 Nguyen and Turley14 examined fashion magazine photographs of male models and showed that the perceptions of the male model profile have changed significantly with time, particularly with respect to the lips. There has been a trend towards increasing lip protrusion, lip curl, and vermilion display.
The goal of our research was to investigate whether perceptions on the contemporary African American profile differ between more experienced orthodontists and newer generation of orthodontists using profiles with various degrees. The secondary objective was to investigate the morphometric features of the most favorable soft tissue lip profile for the modern African American orthodontic patient. Diagnosis and treatment planning for lip protrusiveness should take into account both hard and soft tissues along with the ethnic norms. In order to define profiles that are considered balanced and esthetic, the opinion of the orthodontist, not that of the general public, becomes critical because orthodontists are opinion leaders. A comparison of defined profiles according to the experience of the evaluating orthodontist will provide an insight into the most esthetically pleasing features of the African American orthodontic patient. In this preliminary study, we used photographs depicting various degrees of lip protrusiveness in African American patients to test the hypothesis that there is a statistically significant difference between the experienced and new generation orthodontists with regard to the perception of attractiveness of the lip profile of African Americans.
MATERIALS AND METHODS
A total of 20 orthodontists were selected to participate as evaluators to determine favorable African American profiles. The orthodontists were recruited in 2 groups; 10 experienced (or older) and 10 younger generations. The inclusion criteria for the experienced orthodontists were as follows: graduation from an American Dental Association (ADA)-accredited orthodontic residency program, currently practicing or teaching orthodontics, and at least 20 years of experience in the field of orthodontics. The inclusion criteria for the younger orthodontists were as follows: graduation from an ADA-accredited orthodontic residency program, currently practicing or teaching orthodontics, and less than 10 years of experience in the field of orthodontics. The majority of participants were practicing and teaching in the Baltimore and Washington, D.C. metro area.
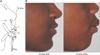
For evaluation, 16 African American faces, including those of seven females and nine males, were selected. All patients had initiated comprehensive orthodontic therapy and had complete orthodontic records taken at our orthodontic clinic. The inclusion criteria were as follows: patients from the University of Maryland orthodontic program, African American females or males aged 9–18 years with a permanent dentition, a pretreatment diagnosis of bimaxillary protrusion with no significant medical history, and no history of facial deformity or asymmetry. The pretreatment profile photographs and cephalometric radiographs were collected, and modified profilograms in color were constructed with equal dimensions for each face (Figure 1) after cropping, such that the lower third of the face including the nose was displayed as previously recommended.1718
Each profile was assessed twice by each evaluator and ranked on a visual analog scale19 measuring 45 mm in length and showing markings from 0 to 5, with 0 representing “unesthetic” and 5 representing “esthetic” (Figure 2). The evaluator was instructed to place a mark along the scale corresponding to their individual perception of attractiveness for each profile. In total, 320 data points were measured on the 16 profiles by 20 orthodontists.
For the assessment of intra-rater reliability, the evaluators were instructed to score the 16 profiles again after a minimum of 2 weeks had lapsed, with guidance provided in accordance with a previous study.19 A millimeter ruler was used to measure each evaluator's markings along the scale. In total, 32 measurements per evaluator were collected twice for the 16 profiles; thus, a total of 640 measurements were used for reliability testing. The intra-rater reliability was calculated using the intra-class correlation coefficient.
Cephalometric measurements
A total of 11 cephalometric measurements were selected per profile from the clinic records. The variables used for assessing lip protrusiveness are shown in Figure 3A. Soft tissue variables included upper lip protrusion, lower lip protrusion, upper lip thickness, lower lip thickness, upper lip to E-line, lower lip to E-line, the nasolabial angle, and the mentolabial sulcus depth, while hard tissue variables included the lower incisor to mandibular plane angle (IMPA), upper incisor to Nasion-A point angle (U1-NA), and interincisal angle.
Statistical analyses
Differences in the perception of the African American profile between the older and younger orthodontists were assessed using t-tests and mixed-effects linear regression models. A mixed model is a statistical model containing both fixed effects and random effects. This model is useful for repeated measurements. In this model, the rating for the ith profile by the jth rater was denoted as Yij. Each rating by the 20 orthodontists for the 16 profiles resulted in the formation of a large matrix. Linear regressing processes on scattered data points generated the following model;
where “Generation” indicating of whether the jth rater is in the older generation. ai is the distributed N (0, σp) (profile effect), bi is the distributed N (0, σR) (rater effect), and εif is the distributed N (0, σε) (residuals). In this model, β1 can be interpreted as the difference in the mean rating between the older and younger orthodontists.
To determine the morphometric features and dimensions of the most favorable lip profile for the modern African American orthodontic patient, we examined the association between profile features and ratings by plotting the mean rating for a profile against the value of the morphometric feature for that profile. Correlation coefficients were separately calculated for each feature and for older and younger orthodontists.
Next, we added statistical terms to the above model as follows;
where the “Morphometric feature value” was the score for the feature of the ith profile. This mixed-effect model assumed a linear relationship between the measurements on facial features and attractiveness scores.20 If this assumption was not valid, more complex relationships could be modeled. The p-values for the statistical significance of β2 terms indicate the strength of evidence that the feature is associated with attractiveness. Finally, to assess whether the relationship between feature and attractiveness varied between the two groups of orthodontists, we added an interaction term to the model as follows;
RESULTS
A total of 16 male and 4 female orthodontists were recruited. The older group included only male orthodontists, while the younger group included six male orthodontists and four female orthodontists. The average number of years of experience in practice was 37.2 for the older orthodontists and 3.8 for the younger orthodontists.
Intra-class reliability
Table 1 summarizes the intra-rater correlation coefficients at different time points, derived from the same rater for the same profile. Consistency (or repeatability) expressed by coefficients of correlation between a set of paired measurements was higher than 80%. Interestingly, younger orthodontists showed higher consistency (by 13% overall) in judging compared with the older orthodontists. In particular, the discrepancy in the consistency of judgments for female profiles was greater than 20% between the two groups.
Differences in average ratings between the younger and the older generation
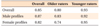
Table 2 shows comparisons of the mean and standard deviation (SD) values of ratings according to the experience of the evaluator and the evaluated profile. There was no significant difference in ratings between the older and younger generation. The SD between ratings (based on a mixed-effects model) was somewhat higher for the older generation raters compared to the younger generation.
Association between cephalometric values and ratings
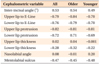
The relationships between morphometric features and ratings are summarized in Table 3. Upper lip protrusion measurements showed the strongest correlation with attractiveness, with a Pearson's correlation coefficient (r) of −0.82. The association with attractiveness decreased linearly as the protrusiveness of the upper lip increased. The upper lip position relative to Steiner's E-line in each profile proved to be the most influential (r = −0.84) factor for determining the level of attractiveness for the older orthodontists, whereas upper lip protrusion showed the highest association for the younger orthodontists (r = −0.81). No other soft and hard tissue measurements were shown to have a significant association with perception of attractiveness.
Comparisons of attractiveness ratings between older and younger orthodontists
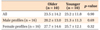
First, variations in attractiveness ratings and morphometric features were linearly regressed. Mean differences in attractiveness ratings with regard to morphometric features between the older and younger orthodontist groups are summarized in Table 4, which shows whether the relationship between morphometric features and attractiveness ratings varies in accordance with the generation of orthodontists on the basis of the following model;
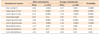
The mean values in the second and fourth columns of Table 4 indicate the mean β2 terms in the regression equation. The interincisal angle, upper lip to E-Line, lower lip to E-line, upper lip protrusion, lower lip protrusion, and mentolabial sulcus were significantly contributory to the models (as indicated by p-values). All variables except the mentolabial sulcus and upper lip thickness differed significantly when the β2 terms for the older group were compared with those for the younger group, as indicated in the last column, Probability.
DISCUSSION
In the present study, we investigated whether contemporary perceptions on African American profiles differ between experienced orthodontists and newly trained orthodontists using profiles with various degrees. Previous studies reported a significant disparity in opinions on facial esthetics between raters with varying ethnic backgrounds, sexual orientations, sociocultural background, and professions.21222324 However, to the best of our knowledge, no study has reported a significant disparity in the perception of attractiveness of facial features between orthodontists from different generations. Although Toureno et al.21 did not find any effect of age, we found that variations in the reproducibility of ratings, as judged by correlation coefficients, were greater among older, more experienced orthodontists. This result was confirmed by the measurement of total variations in ratings. One of the reasons why the older generation showed greater variations in perceptions compared with the younger generation is their wider age range according to our definition. Other conceivable reasons would be a wider variation in their backgrounds/training philosophies as well as a wider range of exposure to/experience in social media depending on age.
When cephalometric values were used for evaluation, the generation gap in opinions was more conspicuous. The younger orthodontists considered the E-line to be far less (20%) significant as a reference line to judge lip protrusiveness compared with the older orthodontists. The amount of variation in the perception of attractiveness between younger and older orthodontists was similar for upper and lower lip protrusion. This may indicate that younger orthodontists may believe that the E-line connecting the nose tip and the chin point is no longer a salient reference line. However, profiles with upper lips that fell just slightly behind the E-line were deemed most attractive. As lip position beyond the line increased, the perception of attractiveness decreased linearly.
Trends or directions in opinions on attractiveness did not differ between the younger and the older orthodontists, as indicated by the mean values in Table 4. There were differences in the magnitude of association, not the direction. Contribution of the directions to the overall variation for each group was not significant; however, differences in the nasolabial angle measurements between the older and younger groups emerged (at p = 0.0074, −0.07 vs. +0.07). We do not know if nasolabial angle measurements reflect the ongoing changes in opinions regarding attractiveness in African American faces. Nevertheless, nasolabial angle values should be evaluated in future studies. Profile #6F (Figure 3B) proved to be the most attractive female profile and the most attractive profile overall, with an average attractiveness rating of 40.3. The most attractive male profile was #5M (Figure 3B), with an average attractiveness rating of 32.2. These two profiles are strongly agreed with what the results of our statistical analyses indicate. We cannot explain this difference in ratings for female and male patients, where the average rating for the female patient is notably high. One reason could be that orthodontists are more exposed to female attractiveness than male attractiveness in social media.
For group comparisons, we used mixed regression models rather than other parametric statistical methods for practicality in dealing with repeated measurements and because of the limited number of raters. Including sufficient numbers of female evaluators with various backgrounds could yield more generalized results. Nevertheless, this mixed linear regression model fits the regression parameters for the data using the maximum likelihood approach, which allows statistical robustness.
CONCLUSION
Because of ever-evolving demographics and perceptions of beauty in the United States and worldwide, orthodontists have become more conscious while determining a favorable lip profile for the African American patient. The results of this study are significant because they indicate that the perception of attractiveness in African American faces changes amonjg orthodontists along with changes in social perception, and that relative influence of the nose and the chin to protrusiveness of the lips in African American faces appears to be reduced among younger orthodontists.


 XML Download