

 PDF
PDF ePub
ePub Citation
 Print
Print


INTRODUCTION
Cyclosporine A (CsA) is one of the most commonly used systemic medications for the treatment of psoriasis as evidenced by the clinical trial results and prolonged experience12. Although a considerable amount of clinical data have accumulated in favor of the efficacy of CsA for treating psoriasis, studies primarily designed to address the laboratory side effects of CsA have not been performed. Rather, there have only been individual and cross-sectional observational reports of various side effects of CsA but no long-term longitudinal observational studies for estimating the risk factors for laboratory side effects3456.
The reporting of side effects was variable, and there are well-known complications such as hypertension, nephrotoxicity, prolonged immunosuppression, hyperkalemia, and hypomagnesemia7. Therefore, it is necessary to monitor patients' medical statuses including laboratory studies during treatment to prevent adverse reactions and identify any signs of developing toxicity. In clinical practice, it is recommended that laboratory values be checked monthly after therapy is started5789.
To the best of our knowledge, no clinical study to date has focused on the changes of laboratory test results and related risk factors in patients with psoriasis treated with prolonged CsA therapy. The frequency of the changes in and detailed adverse effects on laboratory test results have not been characterized or well documented. We investigated the changes of laboratory values in patients with psoriasis treated with CsA in real-world clinical practice. Furthermore, we assessed the possible risk factors predicting adverse effects of CsA on laboratory tests.
MATERIALS AND METHODS
Subjects
Records of patients with various forms of psoriasis who were treated with CsA at an outpatient clinic between January 2009 and June 2014 were retrospectively collected. All of these patients were administered CsA only, whereas other anti-psoriatic medications such as methotrexate or retinoids were not concomitantly administered with the exception of topical treatments. In a real-world setting, only those whose baseline (pre-CsA) laboratory test findings were normal were included, but despite a chronic glomerulonephritis in one patient, he was treated with CsA for the generalized psoriasis after a nephrology consultation. Three patients with chronic hepatitis B received both lamivudine and CsA treatment.
The initial CsA dosage was generally 3 to 4 mg/kg/d given in two divided doses210. Once a patient's psoriasis was in remission, every 2 weeks the dosage was decreased to the lowest possible dose that maintained disease control. In cases of relapse, the dosage was increased again to the smallest possible degree.
Extracted data included demographic details, body mass index (BMI), disease duration, psoriasis severity before starting CsA evaluated by the psoriasis area and severity index (PASI), CsA medication duration and dose, and comorbidities. We defined the disease duration as total days suffering since the onset of psoriasis. The study was approved by Seoul National University Bundang Hospital Institutional Review Board (No. B-1412-278-120).
Laboratory tests
Before starting CsA, all patients underwent sample collection for laboratory tests including complete blood cell (CBC) count, aspartate aminotransferase (AST), alanine aminotransferase (ALT), uric acid, serum creatinine (Cr), blood urea nitrogen (BUN), and urinalysis. Tests for hepatitis B and C viruses were also performed for all patients. Laboratory tests were also performed 1 month after treatment and every 2 months thereafter. Changes in laboratory values during treatment were assessed through the review of laboratory test results.
We defined normal results as follows: white blood cell count, 4,000~10,000/mm3; red blood cell count, 4,000,000~5,400,000/mm3 for women and 4,200,000~6,300,000/mm3 for men; hemoglobin level, 12~16 g/dl for women and 13~17 g/dl for men; platelet count, 130,000~400,000/mm3; AST and ALT levels, 0~40 IU/L; uric acid level, 3.0~7.0 mg/dl; serum Cr level, 0.7~1.4 mg/dl; and BUN level, 10~26 mg/dl. The definition of normal urinalysis findings was consistent with that of our hospital's laboratory reference values.
Statistical analysis
Data were analyzed using SAS software (ver. 9.3; SAS Institute, Cary, NC, USA) using methods appropriate for time-to-event data. The time to a defined event in days was measured from the initial date CsA was taken to the date laboratory abnormalities were detected. Data for patients with normal laboratory findings at the time of the final analysis were considered right-censored. A Cox proportional hazards regression model was used to determine whether there was a significant difference in laboratory result abnormalities among patients with psoriasis based on baseline characteristics, while Firth's correction was applied to analyze specific variables. Baseline data included demographic information, BMI, disease duration, psoriasis severity according to PASI score, CsA therapy dose and duration, and the presence of comorbidities. Hazard ratios (HRs) were estimated with 95% confidence intervals (CIs). Values of p<0.05 were considered statistically significant.
RESULTS
Patients' demographic data and clinical features
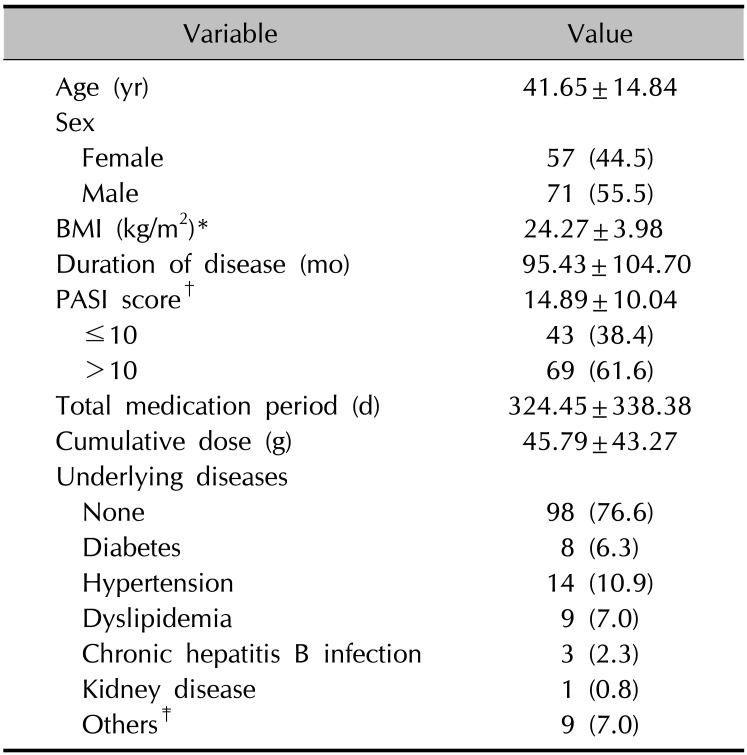
A total of 128 patients with psoriasis (mean age, 41.65 years; range, 13~82 years) were evaluated; of them, 71 patients (55.5%) were men. The mean BMI was 24.27 kg/m2 (range, 16.41~33.78 kg/m2). The mean disease duration between psoriasis outbreak and first CsA use was 95.43 months (range, 0.3~420.0 months). At the start of CsA treatment, the mean PASI score was 14.89 (range, 1.5~56.0). The presence of comorbid conditions is listed in Table 1. CsA was administered for an average 324.45 days (range, 27.0~2,150.0 days), and the mean cumulative CsA dose was 45.79 g (range, 3.15~225.75 g).
Laboratory result abnormalities and risk factors
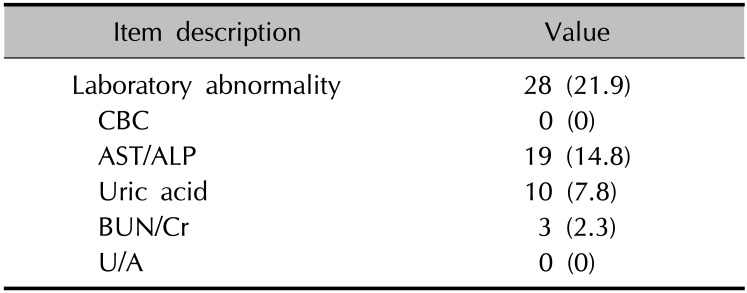
Of the 128 patients included in this study, 28 patients
(21.9%) showed laboratory test abnormalities (Table 2). Laboratory abnormalities occurred at the following frequencies: AST/ALT, 19 patients (14.8%); uric acid, 10 patients (7.8%); and BUN/Cr, three patients (2.3%). No abnormalities were observed in CBC count or urinalysis findings. Six of nineteen patients with transaminitis showed transaminases greater than twice the upper limit of normal (>2 ULN) and 13 patients ≤2 ULN. One of 3 patients had a greater than 30% increase in serum Cr compared with baseline and 2 patients less than 30%.
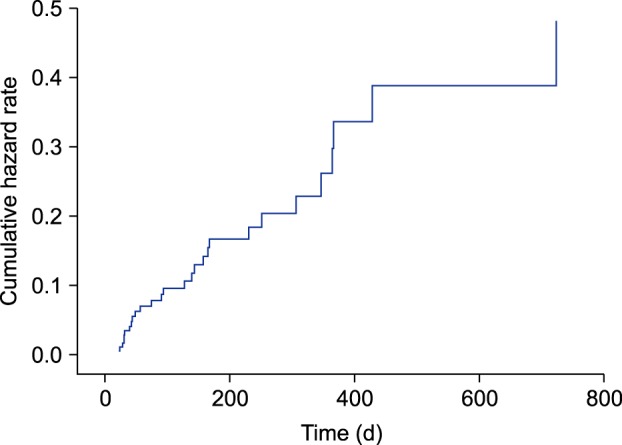
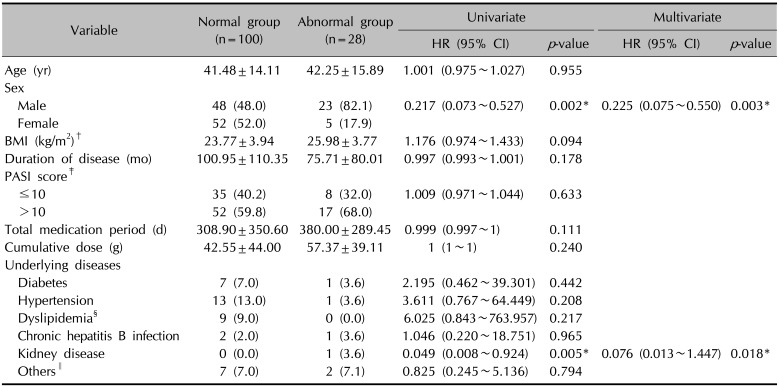
Factors related to total laboratory abnormalities were evaluated (Table 3). Among the variables studied, the only independent risk factors of overall laboratory abnormality were male sex (HR, 0.225; 95% CI, 0.075~0.550; p=0.003) and kidney disease (HR, 0.076; 95% CI, 0.013~1.447; p=0.018). Meanwhile, age, BMI, disease duration, disease severity, total treatment period, cumulative dose, and presence of comorbidities such as diabetes, hypertension, dyslipidemia, and chronic hepatitis B infection did not appear to be associated with laboratory abnormalities. Analysis of the cumulative HR for laboratory abnormalities with adjustment for covariates (sex and the presence of kidney disease) also showed a time-dependent pattern (Fig. 1).
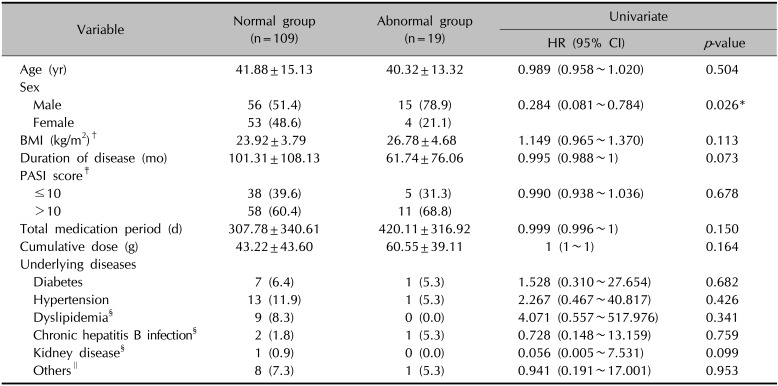
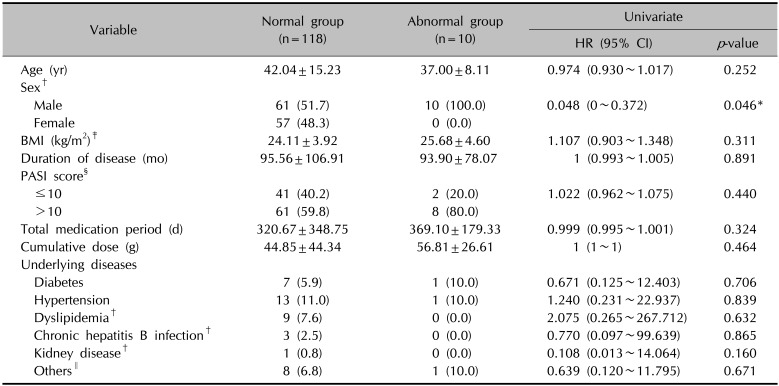
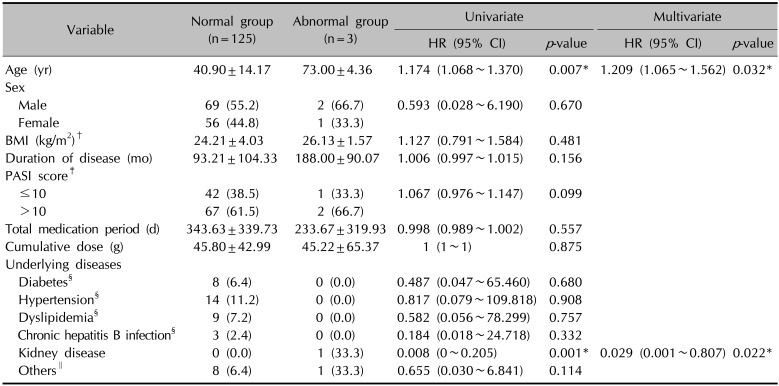
We also individually evaluated the factors related to abnormalities of each laboratory item (Table 4, 5, 6). On univariate Cox proportional hazards regression analysis, male sex was the only factor related to a significantly increased risk of AST/ALT and uric acid abnormalities (Table 4, 5). Age and the presence of kidney disease increased the risk of BUN/Cr abnormalities on univariate analysis and remained significant risk factors on multivariate analysis (Table 6).
DISCUSSION
Various results regarding adverse reactions related to CsA administration for psoriasis detected during laboratory monitoring. In one study3, Cr elevations >30% of baseline values were found in 20 of 28 patients (71%) who were treated with CsA for a mean 55.5 months. In the majority of these patients, Cr levels stabilized but did not return to baseline levels after the CsA dosage was decreased3. On the contrary, García-Bustínduy et al.4 reported that serum Cr levels were transiently elevated in six of 53 cases (11.3%) treated with CsA for a mean 31.4 months. After the CsA dose reduction, all cases returned to normal Cr levels, and no cases required treatment withdrawal.
Reports about the changes in other CsA treatment-related hematological and biochemical parameters are extremely limited. Lebwohl et al.5 reported that hypomagnesemia, hyperkalemia, and hyperuricemia were observed and that triglyceride and cholesterol elevations occurred in approximately 15% and <3% of patients, respectively. For the most part, these laboratory abnormalities were reversible with CsA cessation5. A recent study reported that increased liver enzyme levels and hyperuricemia were observed in 18.9% and 20.7% of patients, respectively, while high cholesterol and triglyceride levels were found in 11.3% and 3.8% of patients, respectively4.
There were some Korean data related with adverse reactions of CsA treatment for various skin diseases. In a study of patients with psoriasis treated with CsA for 12 weeks, microscopic hematuria were reported in 3.3%, abnormal liver function test and hyperuricemia in 1.6%, respectively11, and in other study of patients with psoriasis, increase in serum Cr and abnormal liver function test were reported in 2%, respectively12. On the other hand, none of the 27 patients with chronic idiopathic urticaria treated with CsA for 12 weeks had laboratory abnormalities13. Of the 61 patients with atopic dermatitis who received with CsA treatment for a mean 13.5 months, one patient (1.6%) had an increase in serum Cr of more than 30% above the baseline level and returned to normal after 4 months of discontinuation of CsA treatment14. A study of 1,335 dermatologic patients with CsA treatment in Korea reported hypercholesterolemia (30 patients, 2.2%) and hypertriglyceridemia (12 patients, 0.9%)15. Both adverse effects were more frequent in adults, psoriasis patients, and at more than 3 months of treatment, and were reversible after discontinuation of therapy.
In our study of 128 Korean patients with psoriasis treated with CsA, the laboratory abnormality rate was 21.9% for a mean medication period of 11.6 months. Among them, liver enzyme elevations occurred most frequently in 19 patients (14.8%), followed by changes in uric acid and BUN/Cr levels in 10 patients (7.8%) and three patients (2.3%), respectively. Nephrotoxicity has traditionally been considered the main clinical side effect of CsA treatment. However, our results suggest that transient transaminitis and hyperuricemia occur more often than kidney function impairments when CsA is used for up to 1 year, and these rates should not be ignored. Importantly, CsA was stopped in six of the 19 patients with liver function abnormalities because the liver enzyme levels increased above 2 ULN, and the levels did not return to baseline in one of the 6 patients until 1 month after drug discontinuation. Liver function abnormalities were reversible with a dose reduction in the other 13 patients. In most patients who showed hyperuricemia during treatment, uric acid levels continued to fluctuate or increase despite a dose reduction.
Increases in BUN or Cr levels were reversible after the CsA dosage was decreased. Due to a significantly higher risk of developing irreversible renal damage, current guidelines limit the continuous use of CsA in the United States to 1 year, while those in the United Kingdom and Europe recommend a limit of 2 years 2516. Our finding of renal function changes being reversible when CsA use was limited to 1 year was consistent with these general principles.
Here we analyzed the risk factors associated with changes in laboratory test results for patients with psoriasis treated with CsA. It has been generally known that increasing age, decreased renal function, and baseline hypertension are predictors of severe adverse effects on renal function56. As expected, older age and pre-existing kidney disease significantly increased the risk of renal dysfunction. Male sex was the only significant risk factor for liver enzyme and uric acid abnormalities. The potential difference between male and female might be associated with alcohol drinking habits. Interestingly, our data showed that BMI, disease severity, total medication period, and cumulative dose were not significantly related to laboratory abnormalities. In contrast, Markham et al.3 reported that Cr increases were related to cumulative dose and therapy duration. Most patients in our study continued on CsA therapy for up to 1 year, while some required intermittent short-term intervals beyond 1 year. For this reason, our results showed that laboratory changes seemed not to be influenced by total medication period or cumulative CsA dose. As dosage per body weight is essential for CsA administration, the dose is higher in obese patients. Nevertheless, the relation between BMI and adverse events was not statistically significant, which also supports the finding that CsA dose used within a year does not affect laboratory abnormality.
In conclusion, this is an in-depth study to evaluate laboratory changes and related risk factors in patients with psoriasis treated with CsA. We assessed demographic and clinical factors inducing adverse effects according to each laboratory item. Our data suggest that advanced age, male sex, and the presence of kidney disease are risk factors associated with laboratory abnormalities during CsA treatment. For patients taking CsA for up to 1 year, transaminase and uric acid level elevations should be carefully monitored.
 XML Download