

 PDF
PDF ePub
ePub Citation
 Print
Print


INTRODUCTION
Optic neuritis (ON) is a common feature of multiple sclerosis (MS) and neuromyelitis optica spectrum disorder (NMOSD). ON in NMOSD leads to greater axonal injury and more-severe visual impairment than ON in MS.1 ON is a core clinical characteristic in the revised diagnostic criteria for NMOSD and has been added as one of the five critical lesions in the recently revised diagnostic criteria for MS.23 Detecting ON has become increasingly important for diagnosing both MS and NMOSD.23
Optical coherence tomography (OCT) and visual evoked potentials (VEPs) have been used to assess visual pathways in patients with ON.45 OCT can be used to noninvasively measure the thickness of the retinal nerve fiber layer (RNFL), which is composed of unmyelinated optic nerve axons. OCT is advantageous because it has a high resolution (8–10 µm) and good reproducibility.67 A thin RNFL determined using OCT is considered indicative of axonal damage of the optic nerve,6 which is more severe in NMOSD than in MS.158 Fullfield VEP waveforms with preserved amplitude but delayed latency—which are suggestive of optic nerve demyelination—are typical features in MS.491011 However, studies of VEP waveforms in NMOSD have produced conflicting results. One study found that waveforms with reduced amplitude but preserved latency (suggestive of optic nerve axonal damage) are typical in NMOSD,12 while another study found that, as in MS, those exhibiting delayed latency are common in NMOSD.13 Additional studies are thus required to clarify the typical VEP patterns in NMOSD.
While many studies have evaluated the pathophysiology and clinical severity of MS or NMOSD using OCT and VEPs, few studies have examined the other potential clinical applications of these two techniques, particularly in patients with NMOSD. Moreover, little is known about the sensitivities of these techniques for detecting visual pathway abnormalities in NMOSD, and studies investigating the comparative sensitivities of OCT and VEPs for detecting ON have produced conflicting results. One study showed that VEPs were superior to OCT for detecting clinical and subclinical ON in mixed demyelinating diseases (mainly MS),4 but another study found that VEPs exhibited similar sensitivity to OCT for detecting clinical ON in MS.9 We therefore evaluated the comparative sensitivities of OCT and VEPs with the aim of determining the relative usefulness of these two techniques as markers of the disease burden in NMOSD.
Go to : 
METHODS
Patients
All patients testing positive for the antibody to aquaporin-4 were enrolled regardless of past clinical episodes of ON. Patients who had an episode of ON within the last 6 months were excluded to minimize the effect of optic disc swelling by acute ON.14 Subjects were also excluded from the analysis if they had a history of glaucoma, diabetes, or retinal disease, which may affect OCT measurements. All patients underwent a full ophthalmologic assessment including a visual acuity (VA) test, color vision test, slit-lamp biomicroscopy, and fundus examination. This cross-sectional study was approved by the local Human Research Protection Office/Institutional Review Board (IRB No. 2009-36), and all subjects provided written informed consent.
Evaluations
The best-corrected VA was measured using a retroilluminated Snellen chart. VA was measured on a decimal scale but then transformed into the logarithm of the minimum angle of resolution (logMAR) for the statistical analysis.
OCT was used to measure the peripapillary RNFL thickness with the aid of the Stratus OCT-3 device with version 4.0 software (Carl Zeiss Meditec, Dublin, CA, USA). Fast RNFL thickness protocols were used. Scans were accepted for the analysis if they met the criteria of good-quality scans defined in the Stratus OCT-3 user manual, including signal strengths of 7 or higher (on a score with a maximum of 10), correct centering, and uniform brightness. Abnormal thinning of the RNFL was detected via comparisons with reference values provided in the built-in Zeiss Stratus OCT database. Values that were two standard deviations below the normal mean were considered to indicate abnormal thinning. The data were stratified by age.
VEPs induced by a pattern reversal (with a visual angle of 30 minutes of arc) were recorded over electrode Oz of the international 10–20 system, with Cz as the reference. The latency and amplitude of the P100 component were measured. A prolonged absolute latency (normal limit: 111.53 ms), large interside difference in latency (normal limit: 5.75 ms), or absence of the P100 component was considered abnormal. If the waveform was absent owing to ON-related poor vision, a value of 250 ms was used since this represents the most-prolonged waveform obtainable with the measuring device used.
Statistical analysis
All statistical analyses were performed using SPSS (version 20, IBM Corp., Armonk, NY, USA). The McNemar test was used to compare whether dichotomized proportions were equivalent. Correlation analyses were performed using the parametric Pearson's coefficient (r). The cutoff for statistical significance was set at p<0.05.
Go to :
RESULTS
Clinical characteristics
Data from 73 patients with NMOSD (43 patients had bilateral ON and 15 patients had unilateral ON) were analyzed. Of the 146 eyes, 101 were affected by ON (60 eyes with a single ON episode and 41 eyes with multiple ON episodes) and 45 were unaffected by ON. The demographic and clinical characteristics of the patients are presented in Table 1.
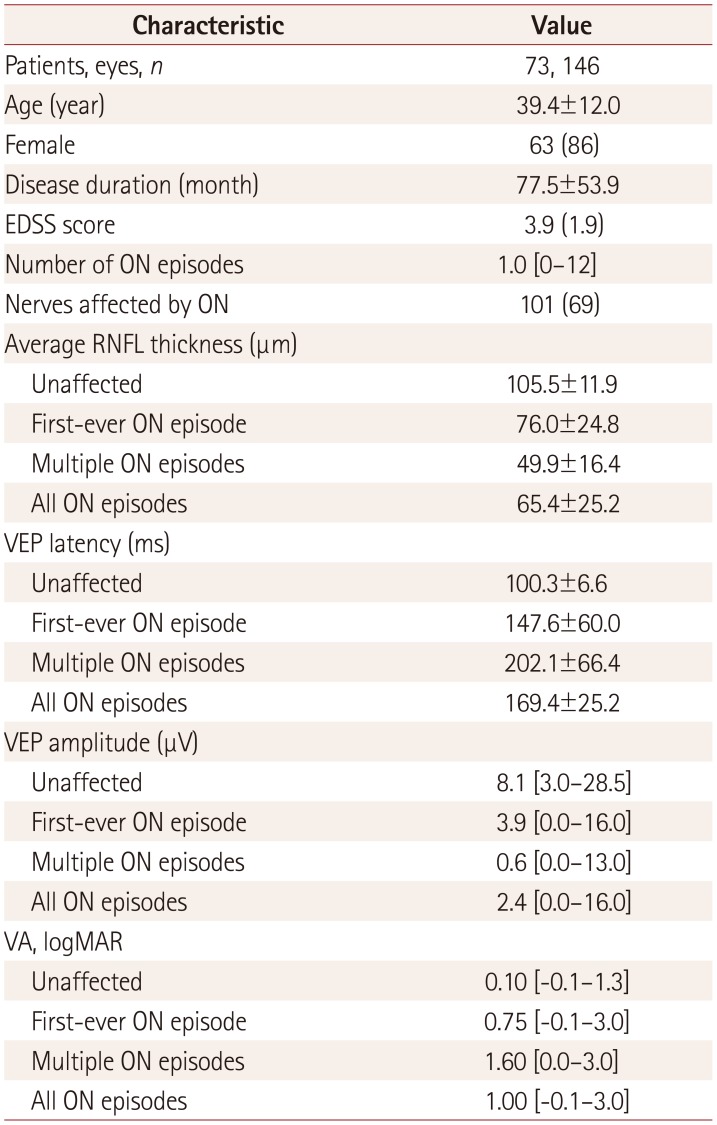
Table 1
Demographic and clinical characteristics of the patients
We classified eyes into unaffected (n=45), first-ever ON episode (n=60), and multiple ON episodes (n=41).
Data are mean±standard-deviation, n (%), or median [range] values (except where indicated).
EDSS: Expanded Disability Status Scale, logMAR: logarithm of the minimum angle of resolution, ON: optic neuritis, RNFL: retinal nerve fiber layer, VA: visual acuity, VEP: visual evoked potential.
![]()
Sensitivities of OCT and VEPs
The findings of OCT and VEP examinations were abnormal in 68% and 73% of the 101 eyes with a history of ON, respectively (McNemar test, p=0.42). Of the 101 eyes affected by ON, 10 (10%) were identified by OCT alone, 15 (15%) were identified by VEPs alone, and 59 (58%) were identified by applying both techniques together. The combination of these two techniques detected abnormalities in 83% of the eyes and significantly improved the sensitivity relative to using either technique alone (p<0.01, Fig. 1).
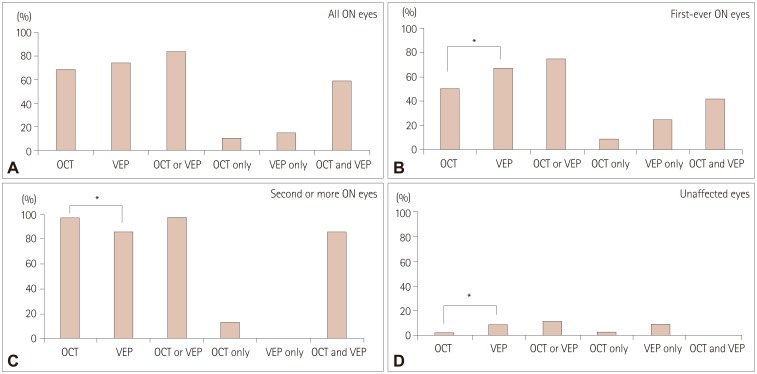 | Fig. 1Percentages of abnormal tests in all 101 eyes with a history of ON (A), in 60 eyes with first-ever ON (B), in 41 eyes with multiple ON episodes (C), and in 45 unaffected eyes (D). Abnormal findings in VEP tests were more frequent in eyes with subclinical or first-ever ON, while abnormal findings in OCT tests were more frequent in eyes with multiple ON episodes. OCT or VEP, eyes with at least one abnormal OCT or VEP finding; OCT only, eyes with abnormal OCT and normal VEP findings; VEP only, eyes with abnormal VEP and normal OCT findings; OCT and VEP, eyes with abnormal OCT and abnormal VEP findings. *p<0.05. OCT: optical coherence tomography, ON: optical neuritis, VEP: visual evoked potential.
|
The sensitivity of each technique was dependent on the number of ON episodes. After a single ON episode (n=60), VEPs were more sensitive than OCT, with abnormalities detected in 67% versus 50% of eyes, respectively (McNemar test, p=0.041). Abnormalities were detected in 5 eyes (8%) by OCT alone, 15 eyes (25%) by VEPs alone, and 25 eyes (42%) by both techniques. The combination of VEPs and OCT detected abnormalities in 75% of eyes and improved the sensitivity relative to OCT alone (McNemar test, p<0.01) or VEPs alone (McNemar test, p=0.06) (Fig. 1).
After multiple ON episodes (n=41), 95% and 83% of eyes had abnormal OCT and VEP results, respectively, indicating that OCT seemed to be superior to VEPs in detecting abnormalities (McNemar test, p=0.06). Abnormalities were detected in 5 eyes (12%) by OCT alone, in no eyes by VEPs alone, and in 34 eyes (83%) by both techniques. Ninety-five percent of eyes with multiple ON episodes had an abnormality in either OCT or VEPs, which was better than VEPs alone (McNemar test, p=0.06) and did not differ from the sensitivity for OCT alone (Fig. 1).
Five (11%) of the 45 eyes without a history of ON had abnormalities in either VEPs or OCT. One eye (2%) was identified by OCT alone and four eyes (9%) were identified by VEPs alone (Fig. 1). VEPs seemed to be superior for detecting subclinical ON, although no significant difference was noted (McNemar test, p=0.38) due to an insufficient number of eyes with subclinical ON.
Correlations
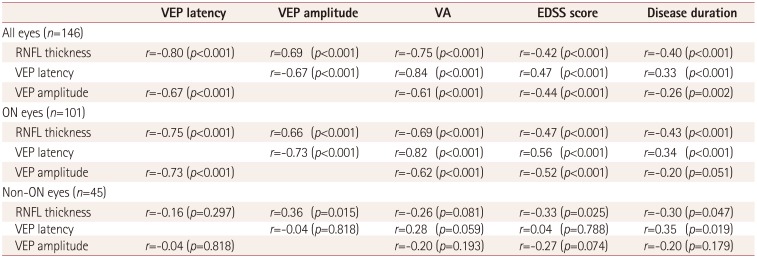
When evaluating all 146 eyes, the RNFL thickness was strongly and linearly correlated with VEP latency and amplitude (Table 2, Fig. 2). The RNFL thickness, VEP latency, and VEP amplitude were each significantly correlated with VA, Expanded Disability Status Scale (EDSS) score, and disease duration.
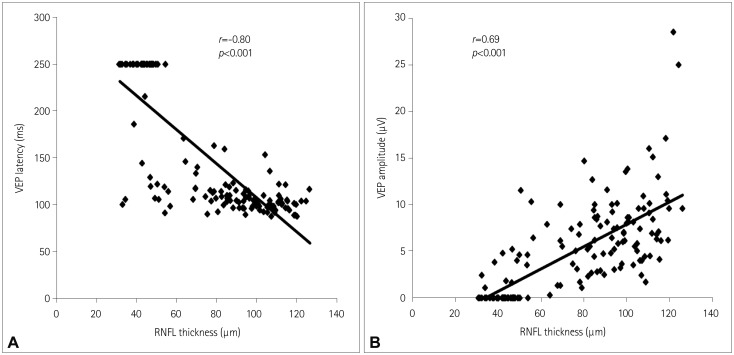 | Fig. 2Correlations (in all eyes) between the RNFL thickness and VEP latency (r=−0.80, p<0.001) (A) and between the RNFL thickness and VEP amplitude (r=0.69, p<0.001) (B). RNFL: retinal nerve fiber layer, VEP: visual evoked potential.
|
Table 2
Correlations among RNFL thickness, VEP amplitude, VEP latency, VA, EDSS score, and disease duration
![]()
In eyes with a history of ON (n=101), the RNFL thickness was significantly correlated with VEP latency and amplitude. In addition, the RNFL thickness, VEP latency, and VEP amplitude were significantly correlated with VA, EDSS score, and disease duration (Table 2).
In eyes without a history of ON (n=45), the RNFL thickness was significantly correlated with VEP amplitude, EDSS score, and disease duration. When using VEPs, a significant correlation was only observed between VEP latency and disease duration (Table 2).
Go to :
DISCUSSION
This study investigated the utility and limitations of OCT and VEPs for detecting ON in NMOSD. VEPs appeared to be more sensitive for subclinical and first-ever ON, while OCT was more sensitive in eyes with multiple ON episodes.
OCT can potentially be used to detect ON and assess the risk of future visual disability as a marker of axonal damage in the brain.4568 The sensitivity of OCT for detecting abnormalities in eyes with a clinical ON episode was 60% in a study of 65 patients with demyelinating diseases (including 40 patients with MS and 20 with neuromyelitis optica) and 68% in a study of 40 patients with MS.49 In our study of 73 patients with NMOSD, the overall sensitivity of OCT for detecting abnormalities after a clinical ON episode was 68%, which is consistent with the above-mentioned sensitivities in MS. However, the sensitivity of OCT was 50% in eyes with first-ever ON and 95% in eyes with multiple ON. Our normal OCT findings in about half of the eyes with first-ever ON suggest that optic nerve damage caused by a single ON episode is not sufficient to result in an abnormally thin RNFL. Abnormal OCT results were observed in most eyes with multiple ON episodes, which might be attributable to the RNFL being thinned to below the normal range owing to the accumulation of axonal damage induced by repeated ON. Therefore, the sensitivity of OCT appears to be affected by the number of ON episodes rather than by the disease type (i.e., MS versus NMOSD).
A VEP evaluation is currently the standard method used to confirm the presence of clinical and subclinical ON.15 The sensitivity of VEPs after an ON episode is reported to be range from 60% to 87% regardless of the type of demyelinating disease. 41215 In the present study, the VEPs were abnormal in 73% of eyes of patients with NMOSD and a history of ON (67% in eyes with first-ever ON and 83% in eyes with multiple ON episodes). Although the sensitivity of the VEP evaluations increased with the number of ON episodes in this study, our VEP sensitivities remained similar to those reported previously. Therefore, the sensitivity of VEPs did not appear to be significantly affected by the number of ON episodes or disease type.
OCT and VEPs were similarly sensitive at detecting ON in NMOSD in this study. However, the comparative sensitivities of these techniques varied with the number of ON episodes; specifically, VEPs were more sensitive for detecting subclinical or first-ever ON, while OCT was more sensitive in eyes with a history of multiple ON episodes. Thus, the sensitivity of VEPs or OCT may depend on the nature of the ON under examination (e.g., number of ON episodes). This could provide an explanation of the previous inconsistent results and should be considered when planning or interpreting future studies that analyze the sensitivities of these two technologies.
While an RNFL thickness reduction of ~7 µm was found in the eyes of patients with MS and without a history of ON,16 normal RNFL thicknesses have been repeatedly found in eyes of patients with NMOSD and without a history of ON.817181920 The present study found subclinical involvement in five eyes without a history of ON (11%), and the sensitivity was higher for VEPs (9%) than for OCT (2%) in these cases. These detection rates were lower than a previous report of subclinical ON being identified in 44% of the eyes of patients with MS and without a history of ON (40% by VEPs and 19% by OCT),9 indicating that subclinical ON in NMOSD is uncommon and that VEPs are better than OCT for detecting subclinical ON.
Previous studies have found that using VEPs and OCT together increases the detection sensitivity for ON in patients with MS, since VEPs and OCT provide detailed information regarding the status of myelin and axons after ON, respectively.9 Indeed, we found that using both OCT and VEPs resulted in a significantly higher sensitivity for the detection of ON in NMOSD relative to using either test alone.
Consistent with previous reports,171821 we identified a strong correlation between RNFL thickness and EDSS score in patients with NMOSD. The correlations between OCT or VEP parameters and clinical disability measurements support the potential utility of these techniques in monitoring NMOSD.
Our study was subject to some limitations. First, the small number of unaffected eyes might have prevented the detection of between-group differences. Second, we used the traditional time-domain OCT device, since our study began before the new spectral-domain OCT device was available worldwide. Spectral-domain OCT may provide a higher resolution, although the coefficients of variation for repeated measures of 2.5% to 3.5% with time-domain OCT are sufficient to enable our results to be interpreted meaningfully.
In conclusion, we found that the comparative sensitivities of OCT and VEPs vary depending on the severity of ON. Researchers should therefore consider differences in the number of ON episodes when they design and interprete their studies. VEPs were superior in detecting subclinical or first-ever ON, while OCT was more sensitive in patients with repeated ON episodes. This study has provided insight into the optimal method for evaluating optic nerve involvement in NMOSD and has confirmed that OCT and VEPs may be used as markers of the disease burden in NMOSD.
Go to :
 XML Download