

 PDF
PDF ePub
ePub Citation
 Print
Print


INTRODUCTION
Memory impairment is the most common and earliest symptoms of Alzheimer's disease (AD). Atrophy of the mesial temporal lobe–and especially of the hippocampus–as detected in neuroimaging is known to be related to episodic memory impairment, and thus is used as an important marker for the clinical diagnosis of AD. The hippocampus1 is structurally complex and composed of the four parts of the cornus ammonis (CA1–4), the dentate gyrus (DG), and the subiculum. These regions have different structures234 as determined by in-vitro and ex-vivo histological methods.1 The small size of the hippocampus makes it difficult to identify and segment the hippocampal subdivisions in magnetic resonance imaging (MRI). MRI at 3 tesla (T) provides performance that is sufficient for general cases but not for delineating the hippocampal subdivisions, and so studies employing 3-T MRI have focused on structural and functional changes in the entire hippocampi and other brain regions.5 However, 7-T MRI provides a higher signal-to-noise ratio and thus a high spatial resolution, which allows better segmentation of the subdivisions of the human hippocampus.67 For example, volumetric analyses of hippocampal subdivisions in AD patients have revealed significant volume losses in CA1 and the entorhinal cortex,8 with these losses being correlated with memory performance.9
Positron-emission tomography (PET) with 18F-fluorodeoxyglucose (FDG) is commonly used for clinical imaging in AD and is an important indicator of neuronal injury,1011 but its usefulness is restricted by its relatively low spatial resolution. Recently introduced brain-dedicated, high-resolution research tomograph (HRRT) PET scanners12 have a spatial resolution of up to 2.5 mm full width at half maximum, but even this is inadequate for identifying important small brain subdivisions. However, Cho et al.13 combined anatomical information obtained by high-resolution MRI with HRRT-PET images to successfully assess glucose metabolism in the hippocampal subdivisions of healthy subjects.
The present study applied the same combination of high-resolution two-dimensional T2*-weighted gradient-echo MRI and FDG-PET imaging protocols to mild-AD patients and cognitively healthy subjects in order to determine whether these technologies in combination could identify changes in glucose metabolism within the hippocampal subdivisions in AD patients.
METHODS
Participants
This study included 19 participants, comprising 9 early-stage AD patients and 10 healthy control subjects. The AD patients met the National Institute of Neurological and Communicative Diseases and Stroke/Alzheimer's Disease and Related Disorders Association criteria for probable AD.14 The cognitive statuses in both groups were assessed using the Seoul Neuropsychological Screening Battery,15 which is used as a standardized neuropsychological battery in Korea that includes the Korean version of the Mini Mental State Examination and the digit span test, the Rey Complex Figure Test and Recognition Trial, the Seoul Verbal Learning Test, and the Controlled Oral Word Association Test. Age-matched healthy controls that met the following conditions were included: 1) no history of a neurological or psychiatric disorder, 2) normal cognitive function as determined by neuropsychological tests, and 3) able to perform the normal activities of daily living. The study was approved by the Institutional Review Board of Gil Medical Center, and all participants signed an informed-consent form (IRB No. H-0907-014-038).
Neuroimaging data acquisition
Data were acquired using systematically calibrated HRRT-PET (Siemens, Knoxville, TN, USA) and 7.0-T MRI (Siemens, Erlangen, Germany) scanners as described previously.13 Forty minutes after the intravenous injection of 185 MBq of FDG, participants underwent a 30-minute HRRT-PET scan and a 6-minute transmission scan for attenuation correction. HRRT-PET images were reconstructed using the three-dimensional ordinary Poisson ordered-subsets expectation-maximization algorithm. The imaging resolution was 1.22×1.22×1.22 mm3. MRI scans were then conducted at 7.0 T16 using an in-house-manufactured eight-channel radiofrequency transmitter and receiver coil. Two-dimensional T2*-weighted gradient-echo images were obtained using the following parameters: repetition time, 750 ms; echo time, 21 ms; flip angle, 30°; resolution, 0.2×0.2×2.0 mm3; imaging orientation, coronal; and 17 slices. The imaging orientation in the coronal plane was perpendicular to the longitudinal axis of the hippocampal body. Imaging planes were set on the hippocampal body at a uniform distance of 4 mm, which included a 2-mm interplane gap.
Data analysis
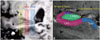
This study analyzed only the hippocampal body (i.e., not the head or tail) due to the limitation of the number of slices at the high resolution used. The middle slice of the 17 slices was placed at the middle of the longitudinal axis of the hippocampus. The hippocampal body was divided equally along the longitudinal axis into three divisions: anterior, middle, and posterior (Fig. 1A). The first five slices toward the hippocampal head covered the anterior part, the last five slices toward the hippocampal tail covered the posterior part, and the middle five slices excluding both ends covered the middle part. Regions of interest (ROIs) were drawn in the following hippocampal subfields: CA1, CA2/3, CA4/DG, and subiculum (Fig. 1B). The hippocampal subfields were segmented based on previously described criteria.17 CA4/DG were drawn as an almost elliptical shape in the middle of the hippocampus. A line crossing CA4/DG from the hippocampal sulcus to the outer edge of the temporal horn was drawn as the reference line. An upward perpendicular line dividing the reference line in half indicated the boundary between CA2/3 and CA1. CA1 extended until meeting the hippocampal sulcus at the edge of CA4/DG. The end of the subiculum was positioned at the most-medial point of the temporal cortex.
To allow comparisons with conventional analyses, ROIs of the entire hippocampal body in each subfield were synthesized from longitudinally segmented ROIs. The FDG uptake values in the hippocampal subdivisions were measured using the corresponding ROIs. Standardized uptake values were calculated as ratios relative to the standardized uptake value for the pons, and were obtained by manually drawing ROIs in the five sagittal planes. Hippocampus and pons ROIs were drawn manually on 7.0-T MRI images using Vinci software (version 2.54, Max Planck Institute for Neurological Research, Cologne, Germany) by two trained specialists. The intrarater reliability was considered satisfactory when the intraclass correlation coefficient was >0.85, as calculated using SPSS Statistics software (version 21, IBM Corp., Armonk, NY, USA). Group comparisons were performed using the Mann-Whitney U test implemented in SPSS software. An asymptotic two-tailed significance probability of <0.05 was considered statistically significant.
RESULTS
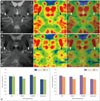
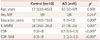
As indicated in Table 1, cognitive functioning was significantly worse in AD patients than in controls. The standardized uptake ratios of the entire hippocampal body revealed that glucose metabolism was significantly lower in the AD group than in the control group in the left CA2/3 (p=0.027) and CA4/DG (p=0.018) (Fig. 2).
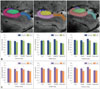
The AD group showed significantly lower glucose metabolism in CA2/3 of the middle (p=0.050) and posterior (p=0.034) regions of the right hippocampal body compared to controls. In the left hippocampal body, glucose metabolism was significantly lower in the anterior (p=0.027) and posterior (p=0.007) regions of CA2/3, the anterior (p=0.027) and posterior (p=0.014) regions of CA4/DG, and the middle (p=0.011) and posterior (p=0.034) regions of CA1 in AD patients (Fig. 3).
DISCUSSION
This study measured glucose metabolism in hippocampal subdivisions along the longitudinal axis of the hippocampus using high-resolution FDG-PET and 7.0-T MRI in early-stage AD patients and healthy controls. Until recently, the resolving power of FDG-PET was inadequate for studying changes in the metabolism of glucose in the hippocampal subdivisions of AD patients. However, the high spatial resolution of HRRT-PET and 7.0-T MRI systems has made it possible to segment and assess glucose metabolism in the hippocampal subfields. T2*-weighted MRI at 7.0 T makes it possible to delineate hippocampal substructures with higher definition, making hippocampal segmentation possible.17 In a previous study, we were able to assess glucose metabolism in the hippocampus subdivisions in healthy control subjects using these high-spatial-resolution imaging systems.13
The present study identified differences in glucose metabolism between cognitively normal subjects and AD patients along the longitudinal axis of the hippocampus body in specific hippocampal subfields. Overall, glucose hypometabolism in the AD group was more dominant in the left than the right hippocampus and more pronounced in the CA2/3 region than in the other hippocampal subdivisions.
In the CA1 region, which is known to be affected during early-stage AD,81819 the glucose metabolism was significantly lower in the middle and posterior body of the left hippocampus in the AD group. The glucose metabolism in the CA2/3 region was significantly lower in the middle and posterior body of the right hippocampus and in the anterior and posterior body of the left hippocampus. In the CA4/DG region, the glucose metabolism in the AD group was significantly lower in the anterior and posterior body of the left hippocampus. It is well established that volume loss of the hippocampus is most frequently observed in the CA1 region in AD patients,20 although CA2/3, CA4/DG, and the subiculum have been shown to be dominantly affected in several studies of mild cognitive impairment (MCI) and AD.21222324 In addition, the higher degree of glucose hypometabolism in the left hippocampus is consistent with the loss of gray matter in the left hemisphere was associated with impaired language function in MCI and AD patients.25
A notable feature of our results is that they differ from those of previous studies because our data directly reflect functional changes (i.e., differences in glucose metabolism) rather than structural changes in the hippocampus. There is evidence from several studies that the relation between functional and structural changes is dependent on the level of progression in many diseases, including AD. The present study minimized the effects of hippocampal atrophy and the partial volume effect by using manual segmentation and a point-spread-function deconvolution algorithm, respectively. Nonetheless, the CA2/3 region could still have been affected by such confounders due to its diminutive size. Furthermore, our analysis was applied to subdivisions of the hippocampal body rather than the entire hippocampi, and the hippocampal head constitutes a major part of CA1; this means that a sizeable part of CA1 was not included in our analysis.
This study was subject to several limitations. First, due to its preliminary nature, the number of subjects was too small to allow clinical conclusions to be drawn. Studies involving larger numbers of subjects are therefore required to confirm our findings. Second, our evaluation was limited by excluding the hippocampal head and tail, which was due to the limitation of the number of slices at the resolution used. Third, the AD patients enrolled were relatively young (mostly younger than 65 years), and hippocampal sparing is common in early-onset AD.26 The intergroup differences in glucose metabolism were therefore probably smaller than might have been expected. Nonetheless, despite these limitations, this study has demonstrated that it is possible to observe structural and metabolic changes in the hippocampal subdivisions of AD patients.
In conclusion, high-resolution PET-MRI fusion images enabled the identification of hippocampal subdivisions and assessments of glucose metabolism in the CA1, CA2/3, CA4/DG, and subiculum subfields in healthy control subjects and early-stage AD patients. Our findings suggest that the combination of high-resolution PET and MRI may be a useful tool for early AD detection.
 XML Download