Abstract
Background and Purpose
Methods
Results
Conclusions
References
Supplementary Materials
Supplementary Fig. 1
Supplementary Fig. 2
Fig. 2
Relative risk (RR) and 95% confidence interval (CI) values for exhibiting good functional outcomes in females versus males with stroke who received thrombolysis; fixed-effects model.
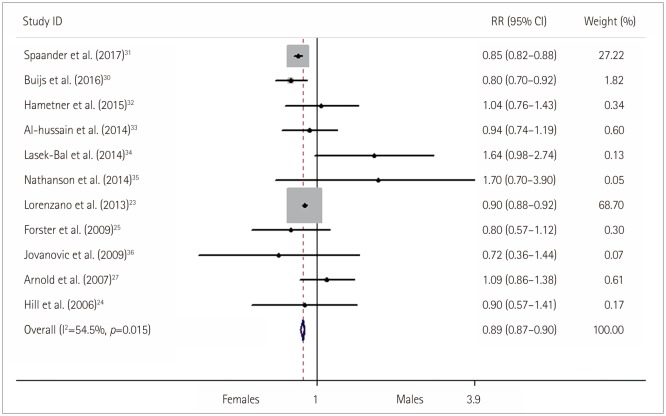
Fig. 3
Subgroup analysis of the method of thrombolysis for the likelihood of exhibiting a good functional outcomes in females versus males with stroke who received thrombolysis. CI: confidence interval, IAT: intra-arterial thrombolysis, IVT: intravenous thrombolysis, RR: relative risk.
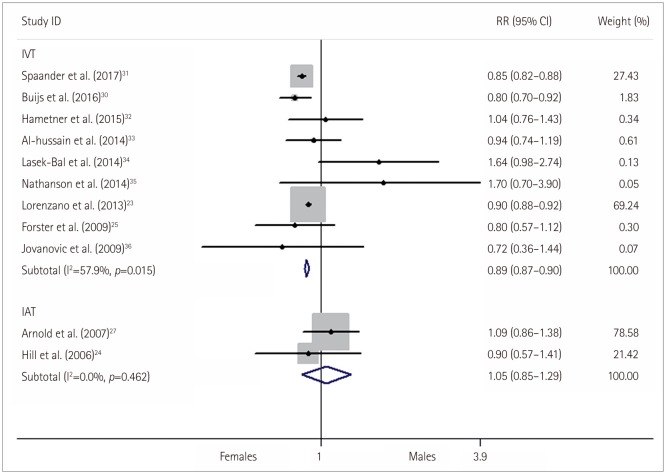
Fig. 4
Relative risk (RR) and 95% confidence interval (CI) values for exhibiting an excellent functional outcome in females versus males with stroke who received thrombolysis; fixed-effects models.
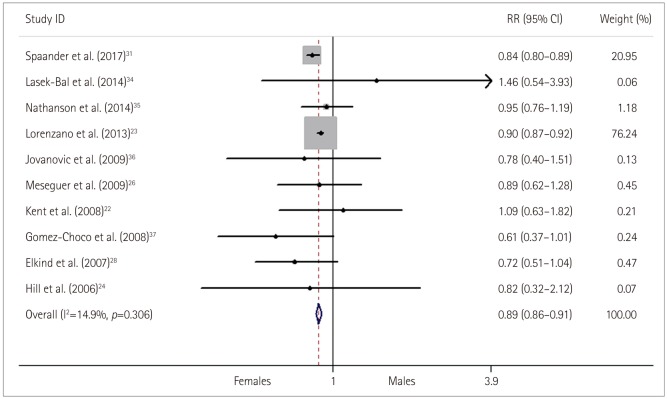
Fig. 5
Relative risk (RR) and 95% confidence interval (CI) values for exhibiting a poor functional outcome in females versus males with stroke who received thrombolysis; fixed-effects models.
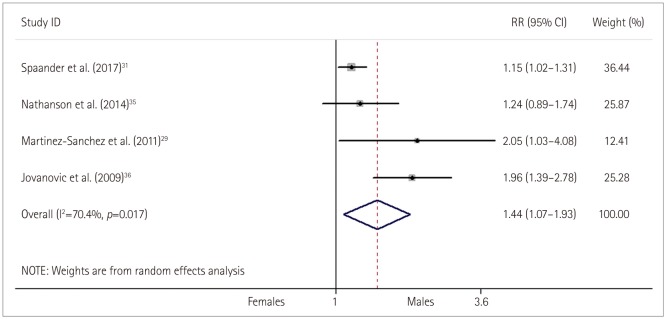
Fig. 6
Relative risk (RR) and 95% confidence interval (CI) values for exhibiting a symptomatic intracranial hemorrhage (sICH) and recanalization in females versus males with stroke who received thrombolysis; fixed-effects models.
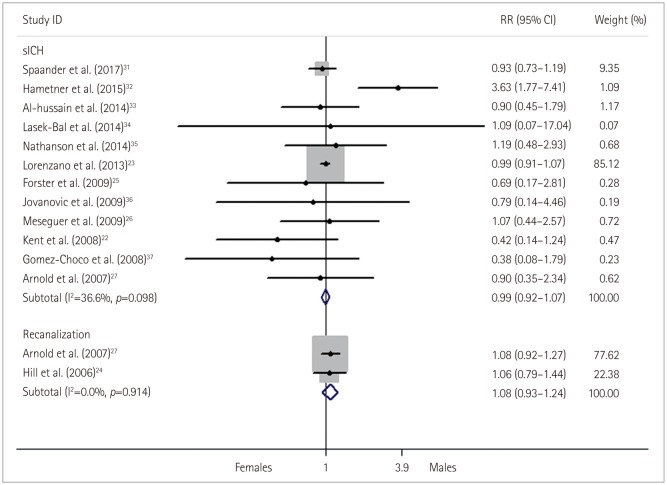
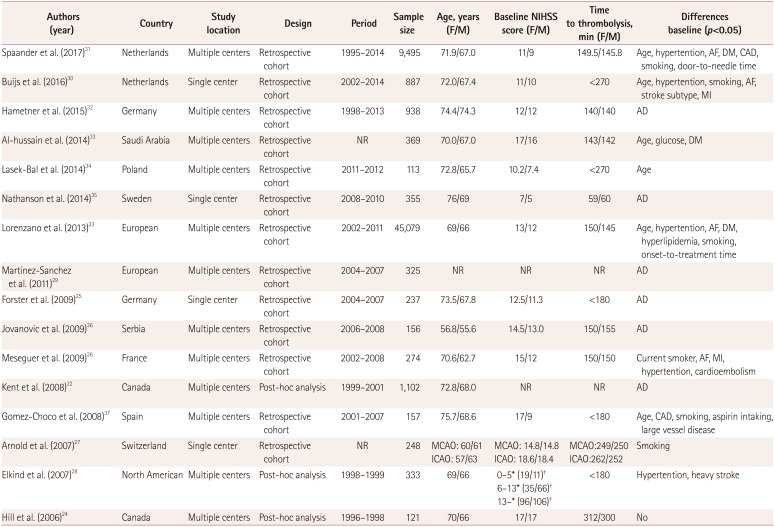
Table 1
Characteristics of clinical trials included in the meta-analysis
| Authors (year) | Country | Study location | Design | Period | Sample size | Age, years (F/M) | Baseline NIHSS score (F/M) | Time to thrombolysis, min (F/M) | Differences baseline (p<0.05) |
|---|---|---|---|---|---|---|---|---|---|
| Spaander et al. (2017)31 | Netherlands | Multiple centers | Retrospective cohort | 1995–2014 | 9,495 | 71.9/67.0 | 11/9 | 149.5/145.8 | Age, hypertention, AF, DM, CAD, smoking, door-to-needle time |
| Buijs et al. (2016)30 | Netherlands | Single center | Retrospective cohort | 2002–2014 | 887 | 72.0/67.4 | 11/10 | <270 | Age, hypertention, smoking, AF, stroke subtype, MI |
| Hametner et al. (2015)32 | Germany | Multiple centers | Retrospective cohort | 1998–2013 | 938 | 74.4/74.3 | 12/12 | 140/140 | AD |
| Al-hussain et al. (2014)33 | Saudi Arabia | Multiple centers | Retrospective cohort | NR | 369 | 70.0/67.0 | 17/16 | 143/142 | Age, glucose, DM |
| Lasek-Bal et al. (2014)34 | Poland | Multiple centers | Retrospective cohort | 2011–2012 | 113 | 72.8/65.7 | 10.2/7.4 | <270 | Age |
| Nathanson et al. (2014)35 | Sweden | Single center | Retrospective cohort | 2008–2010 | 355 | 76/69 | 7/5 | 59/60 | AD |
| Lorenzano et al. (2013)23 | European | Multiple centers | Retrospective cohort | 2002–2011 | 45,079 | 69/66 | 13/12 | 150/145 | Age, hypertention, AF, DM, hyperlipidemia, smoking, onset-to-treatment time |
| Martinez-Sanchez et al. (2011)29 | European | Multiple centers | Retrospective cohort | 2004–2007 | 325 | NR | NR | NR | AD |
| Forster et al. (2009)25 | Germany | Single center | Retrospective cohort | 2004–2007 | 237 | 73.5/67.8 | 12.5/11.3 | <180 | AD |
| Jovanovic et al. (2009)36 | Serbia | Multiple centers | Retrospective cohort | 2006–2008 | 156 | 56.8/55.6 | 14.5/13.0 | 150/155 | AD |
| Meseguer et al. (2009)26 | France | Multiple centers | Retrospective cohort | 2002–2008 | 274 | 70.6/62.7 | 15/12 | 150/150 | Current smoker, AF, MI, hypertention, cardioembolism |
| Kent et al. (2008)22 | Canada | Multiple centers | Post-hoc analysis | 1999–2001 | 1,102 | 72.8/68.0 | NR | NR | AD |
| Gomez-Choco et al. (2008)37 | Spain | Multiple centers | Retrospective cohort | 2001–2007 | 157 | 75.7/68.6 | 17/9 | <180 | Age, CAD, smoking, aspirin intaking, large vessel disease |
| Arnold et al. (2007)27 | Switzerland | Single center | Retrospective cohort | NR | 248 | MCAO: 60/61 ICAO: 57/63 | MCAO: 14.8/14.8 ICAO: 18.6/18.4 | MCAO:249/250 ICAO:262/252 | Smoking |
| Elkind et al. (2007)28 | North American | Multiple centers | Post-hoc analysis | 1998–1999 | 333 | 69/66 | 0–5*(19/11)† | <180 | Hypertention, heavy stroke |
| 6–13* (35/66)† | |||||||||
| 13–* (96/106)† | |||||||||
| Hill et al. (2006)24 | Canada | Multiple centers | Post-hoc analysis | 1996–1998 | 121 | 70/66 | 17/17 | 312/300 | No |
*NIHSS score range, †The number of female and male.
AD: adjusted data with a difference baseline, AF: atrial fibrillation, CAD: coronary artery disease, DM: diabetes mellitus, F: females, ICAO: internal carotid artery occlusion, M: males, MCAO: middle cerebral artery occlusion, MI: myocardial infarction, NIHSS: National Institutes of Health Stroke Scale, NR: not reported.
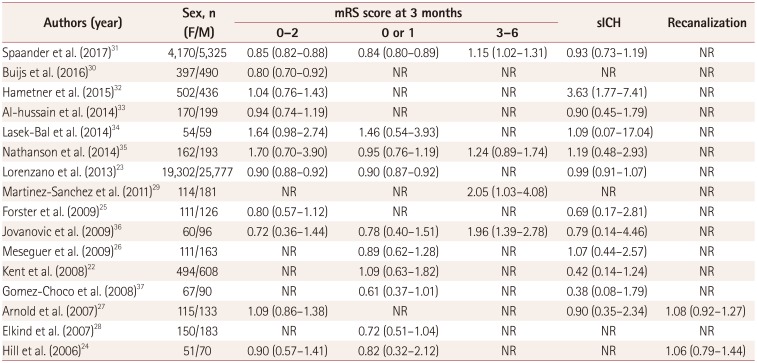
Table 2
Various outcomes in the clinical trials
| Authors (year) | Sex, n (F/M) | mRS score at 3 months | sICH | Recanalization | ||
|---|---|---|---|---|---|---|
| 0–2 | 0 or 1 | 3–6 | ||||
| Spaander et al. (2017)31 | 4,170/5,325 | 0.85 (0.82–0.88) | 0.84 (0.80–0.89) | 1.15 (1.02–1.31) | 0.93 (0.73–1.19) | NR |
| Buijs et al. (2016)30 | 397/490 | 0.80 (0.70–0.92) | NR | NR | NR | NR |
| Hametner et al. (2015)32 | 502/436 | 1.04 (0.76–1.43) | NR | NR | 3.63 (1.77–7.41) | NR |
| Al-hussain et al. (2014)33 | 170/199 | 0.94 (0.74–1.19) | NR | NR | 0.90 (0.45–1.79) | NR |
| Lasek-Bal et al. (2014)34 | 54/59 | 1.64 (0.98–2.74) | 1.46 (0.54–3.93) | NR | 1.09 (0.07–17.04) | NR |
| Nathanson et al. (2014)35 | 162/193 | 1.70 (0.70–3.90) | 0.95 (0.76–1.19) | 1.24 (0.89–1.74) | 1.19 (0.48–2.93) | NR |
| Lorenzano et al. (2013)23 | 19,302/25,777 | 0.90 (0.88–0.92) | 0.90 (0.87–0.92) | NR | 0.99 (0.91–1.07) | NR |
| Martinez-Sanchez et al. (2011)29 | 114/181 | NR | NR | 2.05 (1.03–4.08) | NR | NR |
| Forster et al. (2009)25 | 111/126 | 0.80 (0.57–1.12) | NR | NR | 0.69 (0.17–2.81) | NR |
| Jovanovic et al. (2009)36 | 60/96 | 0.72 (0.36–1.44) | 0.78 (0.40–1.51) | 1.96 (1.39–2.78) | 0.79 (0.14–4.46) | NR |
| Meseguer et al. (2009)26 | 111/163 | NR | 0.89 (0.62–1.28) | NR | 1.07 (0.44–2.57) | NR |
| Kent et al. (2008)22 | 494/608 | NR | 1.09 (0.63–1.82) | NR | 0.42 (0.14–1.24) | NR |
| Gomez-Choco et al. (2008)37 | 67/90 | NR | 0.61 (0.37–1.01) | NR | 0.38 (0.08–1.79) | NR |
| Arnold et al. (2007)27 | 115/133 | 1.09 (0.86–1.38) | NR | NR | 0.90 (0.35–2.34) | 1.08 (0.92–1.27) |
| Elkind et al. (2007)28 | 150/183 | NR | 0.72 (0.51–1.04) | NR | NR | NR |
| Hill et al. (2006)24 | 51/70 | 0.90 (0.57–1.41) | 0.82 (0.32–2.12) | NR | NR | 1.06 (0.79–1.44) |
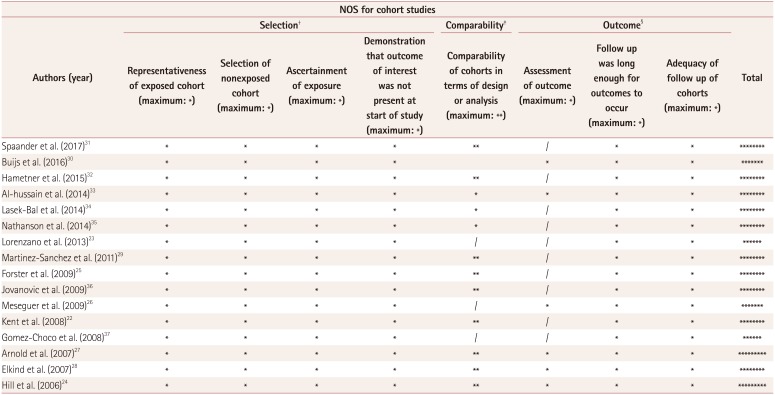
Table 3
Quality assessment of included studies using the NOS
| NOS for cohort studies | |||||||||
|---|---|---|---|---|---|---|---|---|---|
| Authors (year) | Selection† | Comparability‡ | Outcome§ | Total | |||||
| Representativeness of exposed cohort (maximum: *) | Selection of nonexposed cohort (maximum: *) | Ascertainment of exposure (maximum: *) | Demonstration that outcome of interest was not present at start of study (maximum: *) | Comparability of cohorts in terms of design or analysis (maximum: **) | Assessment of outcome (maximum: *) | Follow up was long enough for outcomes to occur (maximum: *) | Adequacy of follow up of cohorts (maximum: *) | ||
| Spaander et al. (2017)31 | * | * | * | * | ** | / | * | * | ******** |
| Buijs et al. (2016)30 | * | * | * | * | * | * | * | ******* | |
| Hametner et al. (2015)32 | * | * | * | * | ** | / | * | * | ******** |
| Al-hussain et al. (2014)33 | * | * | * | * | * | * | * | * | ******** |
| Lasek-Bal et al. (2014)34 | * | * | * | * | * | / | * | * | ******** |
| Nathanson et al. (2014)35 | * | * | * | * | * | / | * | * | ******** |
| Lorenzano et al. (2013)23 | * | * | * | * | / | / | * | * | ****** |
| Martinez-Sanchez et al. (2011)29 | * | * | * | * | ** | / | * | * | ******** |
| Forster et al. (2009)25 | * | * | * | * | ** | / | * | * | ******** |
| Jovanovic et al. (2009)36 | * | * | * | * | ** | / | * | * | ******** |
| Meseguer et al. (2009)26 | * | * | * | * | / | * | * | * | ******* |
| Kent et al. (2008)22 | * | * | * | * | ** | / | * | * | ******** |
| Gomez-Choco et al. (2008)37 | * | * | * | * | / | / | * | * | ****** |
| Arnold et al. (2007)27 | * | * | * | * | ** | * | * | * | ********* |
| Elkind et al. (2007)28 | * | * | * | * | ** | * | * | * | ******** |
| Hill et al. (2006)24 | * | * | * | * | ** | * | * | * | ********* |
For our outcome, the points for confounding were allocated as follows: 1 point for baseline stroke severity and an additional point for coronary artery disease, prior smoking, atrial fibrillation, antiplatelets, prior anticoagulation, previous stroke, DM, hypertension, and hyperlipidemia; adjusted data were allocated 2 points.
We designated the lowest score for the outcome without controlling all the items. The final comparability score was the minimum score that a study received for all the outcomes. /, study did not fulfill the listed criteria; *, study fulfilled the listed criteria.
†Representativeness of exposed cohort: *, cohort was representative of average female patient with stroke in the community; /, cohort was selected based on convenience (i.e., volunteers) or if there was no description of the derivation of the cohort. Selection of nonexposed cohort: *, nonexposed cohort was male patients drawn from the same community as the exposed cohort; /, was nonexposed cohort drawn from a different source or there was no description of the cohort derivation. Exposure ascertainment: *, obtained from secure record (hospital chart); /, written self-report or no description given.
‡*, Study controlled for or adjusted for baseline stroke severity; additional * if controlled for or adjusted for CAD, prior smoking, atrial fibrillation, antiplatelets, prior anticoagulation, previous stroke, DM, hypertension, and hyperlipidemia.
§Assessment of outcome: *, independent blind assessment or evidence of record linkage (i.e., through medical records by specialist); /, self-report or no description. Adequacy of follow-up of cohorts: *, complete follow-up and all participants accounted for or if loss to follow-up was small and unlikely to introduce bias (follow-up rate >90% or description provided of those lost); /, follow-up rate <90%, no description of those lost.
CAD: coronary artery disease, DM: diabetes mellitus, NOS: Newcastle-Ottawa Scale.


 PDF
PDF ePub
ePub Citation
 Print
Print


 XML Download