

 PDF
PDF ePub
ePub Citation
 Print
Print


Introduction
Approximately 20 million children suffer from severe malnutrition worldwide [1]. However, the wide variety of influences that nutrition has on bone development and growth remains largely unknown. According to Ndiaye et al. [2] and Branca et al. [3], malnutrition contributes to decreased stature of adults in impoverished societies, as a reduction in bone turnover is prevalent among malnourished children. However, it is difficult to isolate this parameter, as bone and growth development can also be influenced by genetics [4], ethnicity [567], environmental factors [8], and socioeconomic status [9]. The important relationship between diet and bone health is well-established, and nutritional habits can be influenced both culturally and geographically. Bonjour et al. [10] reviewed over 180 studies to investigate the effect of minerals and vitamins on bone health, and detailed the beneficial effects that calcium, vitamin D, phosphorus, vitamin K, and magnesium all have on bone health. Many nutrients, such as calcium, also need to be monitored in adolescents, and an example of this was demonstrated through a survey in France where young girls between 8 and 18 years old had mean calcium intakes of 820 mg/day [10] which was far below the recommended 1,200 mg/day.
Besides minerals and vitamins, protein also appears to be particularly important in development, where it is required in the building and maintenance of all cells in the body [11]. For example, osteocalcin is a vitamin K–dependent protein that has been recognised in bone health and development [12]. Synthesized by osteoblasts, osteocalcin is the most profuse non-collagenous protein of the bone extracellular matrix and is proposed to be an important factor of bone accrual and bone loss [13]. It is unclear exactly what forms of development are influenced by a lack of protein, although Hediger et al. [14] investigated the effects on bone development in boys with autism spectrum disorder whose parents had restricted casein (protein found in milk) in their diets, and found a significantly lower cortical thickness in their metacarpal bones.
To determine if a child is developing at a normal rate, several methods can be utilized, including assessing X-rays of the long bones, or creating growth-charts of a child's stature as they age. Investigations into stature estimation from the length of limbs or limb segments began at the end of the 19th century [15]. Not only is human stature crucial for providing information regarding nutrition, health and genetics of a certain population, but it is also a valuable set of the parameters for personal identification. Gryfe et al. [16] put forward the possibility that other anatomical measurements could be used to estimate stature in children, with particular interest in the metacarpal bones. The first study to investigate the use of the left hand metacarpals was conducted by Himes et al. [17], who aimed to examine the reliability of second metacarpal (2-MTC) length as an estimation of stature in children aged 1–7 years, for the purpose of forensic and archeological reconstruction. This longitudinal study consisted of 372 boys and 338 girls from rural Guatemala. 2-MTC length was measured from left hand-wrist X-rays and anthropometric examinations were conducted. The findings concluded that the 2-MTC length may be a realistic estimator of stature in young children [17].
Researchers have become increasingly reliant upon the metacarpal bones as a measure of skeletal health and development. This is now in widespread use as it has been recognized to provide reliable results of height that are comparable to those established from long bones [18]. Accurate skeletal measurements, and a clearer understanding skeletal growth is also important in areas such as forensic analyses, where calculations for extrapolating morphometric features are conducted from skeletal remains, and modern education systems utilizing 3D modelling visualizations to represent skeletal ages [19]. This study aims to investigate the influence on growth of females from two populations in Papua New Guinea: Pari Coastal Village, where fish and seafood provided a wealth of additional protein; and Bundi Highlands Village, where minimal protein was available. At the time of the study, both diets were highly restrictive, and have been well-classified [2021]. Growth patterns from children in these restrictive diets will be compared to females who maintained a highly varied diet, from Brisbane, Australia. Furthermore, this study will investigate whether the metacarpal bones of the left hand can be used as a practical estimator of stature in juvenile females.
Materials and Methods
The hand and wrists of 353 juvenile females were radiographed between 1968 and 1983 as part of the International Biological Program (IBP). Established in 1964, the IBP was a worldwide multinational study to determine human adaptability with a main objective of examining and comparing different ethnic and economic groups. To be consistent between studies, all IBP data was collected to anatomical standards at the time. These included methods used to measure stature, arm length, head breadth, and other anthropometrical features. All subjects in this study were assessed using the parameters outlined from the IBP. Three regions were assessed as part of the IBP, although the data collected over the >10 years was never assessed or processed. These regions included a coastal village, Pari, which was relatively isolated and located South East from the capital, Port Moresby. The second location, Bundi, was a small village in the highlands of Papua New Guinea. This village was not on any major roads, and heavily isolated from outside interference or contact. The third location was from high schools in a capital city, Brisbane, Australia, and acted as a control group for all measurements.
Subjects examined in this study included 229 females from Pari, 20 females from Bundi, and 142 females from the city of Brisbane in Australia. The 20 Bundi, and 229 Pari females constituted all females living in the village between 7 and 17 years old. The Brisbane female control subjects were selected randomly from volunteers attending three all-girls high schools across the city. The 2-MTC and third metacarpal (3-MTC) bones were examined in this study as they are the most commonly recommended long-bones to assess for childhood development in previous research. Additionally, the 2-MTC is one of the largest and most durable bones of the hand [22]. Over recent years, metacarpal morphometry has reclaimed its recognition as the measurements obtained from these bones have been suggested to be valid indicators of appositional bone growth in juveniles [14]. The radiographs remained in storage under laboratory conditions and data from these has never been published prior to this study. X-rays were digitised using a ScanMaker 9800XL+ (Microtek, Hsinchu, Taiwan) and the second and third metacarpals measured using ImageJ v1.48 software (NIH, Bethesda, MD, USA). Further analysis of the results was undertaken using GraphPad Prism v6 (GraphPad, San Diego, CA, USA). Anthropometrical measurements and metacarpal parameters were graphed using calculations of the mean (±SD). Correlations of metacarpal parameters between Bundi, Brisbane, and Pari were analysed and a Pearson's correlation coefficient was applied to test for significance. A table of critical values for Pearson's ‘r’ was tested with P<0.05 being significant.
To assess significance between group data relating to Brisbane, Pari, and Bundi, an ordinary one-way analysis of variance (ANOVA) with a Tukey's post-test was applied. An ordinary one-way ANOVA was also used to compare morphometric parameters when the individual groups were matched by age. Where appropriate, an unpaired two-tailed, Student's t test was used to assess height, weight and metacarpal parameters for significance with P<0.05 being significant. Ethics was approved by the Bond University Ethics Committee.
Locations
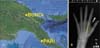
Juveniles from two locations in Papua New Guinea were analysed in this study, Pari and Bundi (Fig. 1). Pari Coastal Village is located approximately 10 km southeast of Port Moresby [21]. The X-rays used in this project were extracted from a sample taken of 2,056 children aged 0 to 17 years old. Participants were from three different schools: 1,110 in Pari primary school, 601 in Hagara primary school and 345 in Badihagwa secondary school. All Pari children used in this study were known to be of Motuan ancestry [21]. Data assessed also included anthropometrical measurements of the Pari children, including their standing height and weight. Bundi Highland Village is located in the Madang District of PNG [20]. At the time of data collection, the Bundi villagers were living at altitudes of 600–2,000 m. A total of 1,741 children, aged from birth to 24 years, were examined and anthropometrical measurements were conducted. Hand-wrist X-rays of the Bundi school children were also taken by Dr. Wood as part of the study (Fig. 1). Brisbane, the capital of Queensland, Australia, is situated in the southeast corner of the state. X-rays and anthropometrical data was collected from 663 girls aged 8 to 17 years.
Results
Suitability of the 2-MTC or 3-MTC bones for determination of height
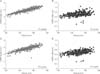
To ascertain whether the 2-MTC or 3-MTC would be an appropriate measure for stature determination, X-rays of females between 7 to 17 years old (n=353) were analyzed. The height of the subjects ranged from 107 to 173 cm, whilst 2-MTC and 3-MTC lengths ranged from 2.9 to 7.4 cm, and widths ranged from 0.3 to 1.0 cm. It was observed that as subjects' stature increased, 2-MTC length increased (r=0.91, R2=0.829, P<0.01), and 3-MTC length also increased (r=0.86, R2=0.737, P<0.01) (Fig. 2). Similarly, 2-MTC width (r=0.46, R2=0.215, P<0.01) and 3-MTC width (r=0.50, R2=0.254, P<0.01) also increased as stature increased (Eqs. 1, 2, scatterplot depicted in Fig. 2).
Formula for estimation of height in juveniles between 7- and 17-years-old derived from subject heights and radiographs analysed in this study (n=353).
Variations in weight between Pari, Bundi, and Brisbane females
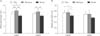
Brisbane female subjects had increased weights when compared to both Pari and Bundi subjects (P<0.001). When compared between age group, the lowest weight recording was seen within the Bundi population (Fig. 3). In the 13-year-old age group, the same trend persisted, as Brisbane females continued to be heavier than Pari females (P<0.001). There was no statistical difference in weight between 14-year old Pari and Brisbane subjects (P>0.05). Bundi females had only one subject with weight recorded in each of the 12-year-old and 14-year-old age groups and therefore statistical analysis could not be conducted for these two age groups (Fig. 3). From 11 to 14 years of age, the weight of the subjects followed a similar trend, as Brisbane females were consistently heavier in comparison to females from PNG. Furthermore, coastal females from Pari were heavier than highland females from Bundi.
Variations in height between Pari, Bundi, and Brisbane females
Brisbane females were tallest among all age groups, followed by Pari females, then Bundi females as the shortest (Fig. 4). The minimum height in all age groups was 107 cm (Bundi), whilst the maximum height was 173 cm (Brisbane). Significant differences were found in height when comparing 11-year old females from all three regions (P<0.001 for all) (Fig. 4). Significant differences were observed in the 12-, 13- and 14-year-old age groups for Pari and Brisbane females (P<0.001 for all) (Fig. 4). Similar to the weight data, Bundi could not be analysed for significance in these age groups due to the lack of height recordings within this population.
Metacarpal growth patterns by age
11 years old
For 11-year-old female subjects, significant differences were seen in 2-MTC and 3-MTC mean lengths between Pari and Bundi (P<0.001), and between Brisbane and Bundi (P<0.001). However, there were no significant differences between Pari and Brisbane (P>0.05). The only significant difference within MTC width was between Pari and Bundi in the 2-MTC.
12 years old
For the 12-year-old female subjects, significant differences were seen between all three populations in both the 2-MTC and 3-MTC lengths. The strongest differences were between the Pari and Bundi subjects (2-MTC length: P<0.001) and Brisbane and Bundi subjects (2-MTC and 3-MTC length: P<0.001). For MTC widths however, the only significant difference
was seen in 3-MTC width between Pari and Brisbane.
13 years old
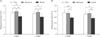
Results indicated a significant difference in 2-MTC length for all three populations (Fig. 5). The significant differences in 3-MTC length were seen between Pari and Brisbane (P<0.01), and Bundi and Brisbane (P<0.01). However, no significant difference was seen between Pari and Bundi (P>0.05) (Fig. 5) Both Pari and Bundi, and Brisbane and Bundi, showed significant differences in 2-MTC width (P<0.05 for both) (Fig. 4).
14 years old
All three populations were significantly different for both 2-MTC length and 3-MTC length. In both 2-MTC width and 3-MTC width significant differences were seen between, Pari and Bundi, and Brisbane and Bundi (Fig. 6).
Discussion
The suitability of using 2-MTC length as a measure of stature
According to Haiter-Neto et al. [23] the area of the hand and wrist is thought to be the most indicative region to assess skeletal maturation, particularly due to the numerous ossification centres in this area. However, there is a paucity of research into using the MTC bones as a predictor of stature. Himes et al. [17] investigated whether the 2-MTC length would be an appropriate estimator of stature in young children, with results suggesting the 2-MTC as a potential estimator of stature. However, this study was only completed on one population, rural Guatemalan children, and Himes et al. [17] concluded that the estimation equation generated from 2-MTC length is unlikely to be comparable to those from other populations. Furthermore, the measurements made from the hand-wrist X-rays were performed using a dial-read caliper. In contrast, this thesis used modern computer software ImageJ, developed by the Unites States National Institute of Health, which has far greater accuracy than calipers or other manual methods used in the past [24].
2-MTC and 3-MTC lengths were significantly correlated with stature for the Pari and Brisbane populations in the 12- and 13-year-old age groups, and the 14-year-old Pari females, indicating MTC length to be a reliable measure of stature. However, the results showed no association between MTC width and stature for these populations and age groups (P>0.05). The 14-year-old Brisbane female population showed MTC width as an additional measure of stature, however due to an increased number of outliers, this correlation was not as strong as the relationship between MTC length and stature. Additionally, Bundi's significantly smaller MTC bone parameters, suggests that using 2-MTC length as an estimator for stature would be highly inaccurate.
Early literature has determined that stature estimation equations derived from one population are not universally applicable to other populations with the same degree of certainty [46252627]. However, the 2-MTC length between Pari and Brisbane in the 11-year-old age group, presented no significant differences (P>0.05).
The following sections provide hypotheses to explain the reasons for the stunted growth exhibited in the Bundi population.
Genetics
The variations observed in height between two different populations has raised an ongoing challenge for investigators when determining precisely which factors are involved. Although genetics and environmental influences normally present the strongest impact, it is unclear as to the extent that each of these imparts on a developing child. It was interesting to observe that there were similarities between the growth and development of the Brisbane and Pari subjects, whilst great differences occurred between the Bundi and Pari populations. Pari and Bundi were geographically separated by less than 500 km, which suggests that their genetics and family histories would be more closely related, when comparing either of these populations to the Brisbane children. Therefore, this observed difference in height is not likely to be due to major genetic variations. This finding is in slight contrast to several past studies, which estimate that most the variation in height among individuals may come down to genetic factors [282930]. However, these key papers focused solely on research on twins to identify heritability of body height, with the exact influence of genetics between populations remaining uncertain. It is interesting to note that height variability has also been found to be a result of environmental factors, such as nutritional differences and disease exposure [31]. This finding supports other research, which backs up these claims and besides nutrition and disease, socioeconomic status, locality and climate also have vast influences on height [32]. The lack of variation between Brisbane and Pari, the genetically dissimilar groups assessed in our study, and the significant variation in height between Bundi and Pari, strongly suggests one or more of the other variables caused stunted growth in the Bundi population. Silventoinen et al. [8] stated that environmental factors were more significant with regards to height among females than among males, and further demonstrated that altering environmental factors affects heritability of height. Being situated in the PNG highlands, the people of Bundi were living at high altitudes, and according to Wilcox [33] it is common for infants born at higher altitudes to be smaller due to decreased oxygen saturation in the air [32]. However, even the highest points of Bundi are under 2,000 m and therefore it is unlikely to have caused substantial growth inhibition. There was a significant variation between mean heights of 11-year-old Pari and Brisbane subjects (P<0.001), taking into consideration the dissimilarity of the two populations in terms of their genetics and environments, these results were expected. The possible effects of inbreeding should also be considered, as it is known that inbred communities can be shorter in stature, however, in these communities in Papua New Guinea, inbreeding is culturally forbidden, and no marriages are allowed between sub-clans. Even with the remoteness of the Bundi location in the highlands, there maintains sufficient movement of members (particularly females) between tribes.
Environmental factors
The current study presented surprising results, as children from Bundi were found to have stunted growth with significantly lower height, weight and MTC parameters. According to Tanner [34], height is a widely accepted marker of population health. Several studies have shown that adult height is negatively associated with morbidity and mortality from various diseases [35363738]. A study conducted by Davey Smith et al. [35] observed an inverse relationship between height and mortality from respiratory, cardiovascular disease and cancer. Further studies have indicated that individuals with shorter stature, much like the people of Bundi, are at a higher risk of developing type 2 diabetes, heart disease and osteoarthritis [3940]. Tanner and Davies [41] stated that the first two years of life are exceptionally significant for a child's height development. It is during these two years that children form the fastest growth in the entire postnatal life [41]. This is a critical time for growth and development of children, and therefore, factors that have a negative influence on growth would have detrimental impacts during this period. A more recent review by Victora et al. [42] investigated the association between maternal and child undernutrition and the negative effects on adult health, and concluded that poor growth in the first two years of life continues into adulthood. Additionally, earlier studies have observed a strong relationship between early life undernutrition and shorter adult height [43]. Adequate nutrition is crucial for the proper development of infants and children [44]. Nutritional supplementation has shown clear benefits on the developments of a child, including practical reasoning, eye and hand coordination, hearing and speech, and general performance [45]. Throughout the time of this study, the diet of the Bundi people consisted mostly of low-protein foods such as corn, beans, tomatoes and bananas during the dry season, whilst the wet season diet was limited to green leafy vegetables and sweet potato. Unlike the people living in the coastal village of Pari who had access to fishing, sources of protein were scarce in the highland village of Bundi. Protein sources in Bundi were limited to a variety of insects, spiders, frogs and other small forms of animal life which Malcolm [20] has stated is insufficient to meet the needs of the children.
Protein intake
As a coastal village, fishing was the primary method of obtaining protein for the community of Pari [21]. In the highland village of Bundi, however, fishing, or substantial animal farming of any sort was not possible. Brisbane subjects, situated in a capital city, had a varied diet that commonly included seafood and other sources of protein. In Bundi, therefore, the lack of easily obtainable sources of protein was likely the major differentiating factor to induce the limited growth and development compared to the other regions. Although protein is the main candidate for the observed stunted growth in Bundi, additional benefits of seafood consumption cannot be ruled out. For example, seafood would have been a source other trace elements such as of iodine, and is also rich in omega-3, an essential dietary nutrient. Lowered intake of seafood and protein could not only affect the direct skeletal growth of a child as they age, but may also induce stunted development from the womb. Studies have shown that maternal diet is a significant factor of foetal growth [46]. This includes a Norwegian study consisting of 62,033 women, conducted to investigate the influence of maternal intakes of seafood and subtypes of seafood, in infant birth weight, length and head circumference [47]. The results from this study showed a positive association between seafood consumption, and birthweight and head circumference, with the relative risk of delivering a small baby lowered in women who commonly ate seafood [47]. As such, it should be noted that there could be other benefits from having a seafood-rich diet, compared to simply considering it as solely a source of protein.
This current study indicated that although the children of Pari and Bundi share the same nationality, it is assumed that the significant difference in height and weight is due to the two populations dietary intakes. The diverse nutritional intake and diet has been strongly represented, not only in the height and weight measurements, but also in the MTC parameters. Protein deficiency in the Bundi population was likely to be caused by limited access to food sources containing protein, particularly fish. In further support of this finding Leonard [48] has noted that even seasonal food scarcities can induce stunted growth rates. Therefore, it is possible that the inhibited growth and development of the Bundi children, when compared to the Pari and Brisbane children, was caused in a large part, by a protein deficiency due to the unavailability of fish.
This present study supports past research identifying the MTC bones as appropriate measures of stature, and has found that the 2-MTC in particular is the most accurate of these bones. An additional outcome has been the finding that the length of the 2-MTC is a more effective estimator of stature when compared to MTC width. In addition, the importance of nutrition in normal skeletal development was highlighted, and one cause for stunted growth of the Bundi Highlands Village population appears to have been the lack of available nutrition. This is possibly due to the absence of high amounts of protein from the diet, in contrast to the other regions. These results may assist with the considerations that paediatric, radiographic or forensic or academic assessors utilise when determining the healthy rate of a child's growth and development in the future.


 XML Download